SlideShare a Scribd company logo
Financial Ratio
2017A 2018A 2019A 2020A 2021A 2022F 2023F 2024F 2025F 2026F
Growth Rates (%)
Sales 41.1% 1.2% 20.0% 17.2% 26.0% 9.9% 13.9% 9.3% 9.7% 13.1%
COGS 43.0% 6.8% 39.5% 22.5% 20.4% 17.2% 10.1% 7.4% 6.8% 10.1%
Gross profit 39.7% -3.2% 3.1% 11.0% 33.3% 1.5% 19.0% 11.6% 13.3% 16.5%
Selling expenses 46.9% 56.2% -3.0% 36.5% 49.4% -5.9% 19.7% 11.5% 6.5% 14.6%
Administration expenses 22.3% 25.8% 30.6% 0.8% 49.1% 7.6% 15.2% 10.0% 10.5% 14.0%
EBITDA 49.6% -23.9% 4.4% -10.6% -44.7% 36.9% 5.6% 11.9% 54.5% 26.1%
Depreciation and
Amortization 14.0% 14.6% 48.5% 26.3% -15.3% 12.2% -8.6% 5.1% 19.4% 14.4%
EBIT / Operating profit 42.9% -52.6% -11.6% -33.2% -78.8% 151.2% 34.8% 21.4% 97.2% 34.6%
EBT (Earning before tax
growth) 71.9% -62.6% 47.7% -38.1% -35.8% -12.5% 64.0% -19.8% 95.7% 33.3%
NPAT (Net income
growth) 71.5% -61.2% 75.0% -63.1% 208.1% -82.7% 62.0% -20.7% 93.3% 33.3%
Profitability
Gross profit margin 56.2% 53.8% 46.2% 43.8% 46.3% 42.8% 44.7% 45.6% 47.1% 48.5%
EBITDA margin 23.6% 17.7% 15.4% 11.8% 5.2% 6.4% 6.0% 6.1% 8.6% 9.6%
EBIT margin / Operating
profit margin 27.8% 13.0% 9.6% 5.5% 0.9% 2.1% 2.5% 2.8% 5.0% 5.9%
EBT margin 27.1% 10.0% 12.3% 6.5% 3.3% 2.6% 3.8% 2.8% 5.0% 5.9%
NPAT margin 32.3% 12.4% 18.1% 5.7% 13.9% 2.2% 3.1% 2.3% 4.0% 4.7%
Return on Assets (ROA) 35.3% 11.7% 15.7% 4.6% 12.5% 1.9% 2.8% 2.0% 3.5% 4.2%
Return on Equity (ROE) 43.4% 14.6% 20.5% 6.2% 17.8% 2.9% 4.6% 3.5% 6.4% 8.0%
ROIC 47.2% 17.1% 19.9% 5.0% 20.8% 1.9% 2.7% 1.9% 3.3% 3.8%
Financial leverage
Debt Equity Ratio 0.00 0.00 0.00 0.00 0.03 0.24 0.37 0.47 0.53 0.61
Debt to Total Asset ratio 0.00 0.00 0.00 0.00 0.02 0.15 0.21 0.26 0.28 0.31
Equity Multiplier 0.81 1.27 1.32 1.36 1.49 1.57 1.71 1.81 1.87 1.95
Liquidity
Quick Ratio 2.81 2.79 2.79 3.17 2.46 2.86 2.39 2.12 2.00 1.90
Current Ratio 3.61 3.44 3.32 3.78 3.06 2.89 2.41 2.14 2.02 1.92
Financial Ratio
2017A 2018A 2019A 2020A 2021A 2022F 2023F 2024F 2025F 2026F
Coverage ratios
Interest coverage
(EBITDA/interest) #DIV/0! #DIV/0! #DIV/0! #DIV/0! #DIV/0! #DIV/0! #DIV/0! #DIV/0! #DIV/0! #DIV/0!
CFO/Current liabilities 3.8 2.0 1.6 3.3 0.3 0.1 0.0 0.0 0.1 0.1
CFO/Interest bearing debt No debt No debt No debt No debt 35.9 No debt No debt
No
debt
No
debt No debt
Efficiency
Receivable Turnover 14.0 12.8 13.9 12.9 11.1 10.8 11.8 11.6 11.6 11.8
Days Receivable
Outstanding 26 29 26 28 33 34 31 32 31 31
Inventory Turnover 137.1 138.3 132.1 122.1 55.0 46.4 57.7 57.0 56.8 57.7
Days Inventory
Outstanding 3 3 3 3 7 8 6 6 6 6
Payables Turnover 11.0 7.7 6.5 7.1 7.0 6.4 7.4 7.3 7.3 7.4
Days Payable
Outstanding 33 47 56 51 52 57 49 50 50 49
Business Cycle (4) (16) (27) (20) (12) (15) (12) (12) (12) (12)
Current Asset Turnover 1.6 1.3 1.2 1.1 1.1 1.1 1.1 1.1 1.1 1.1
Fixed Asset Turnover 28.1 20.1 12.5 10.9 14.4 14.5 14.4 14.4 14.9 16.5
Asset Turnover 1.1 0.9 0.9 0.8 0.9 0.9 0.9 0.9 0.9 0.9
Financial Ratio
COST BREAKDOWN (%) 2016A 2017A 2018A 2019A 2020A 2021A
Outsourcing Fees 607,373 955,125 1,473,396 1,669,572 2,164,891 3,058,783
Payroll Expense 696,731 845,027 1,059,012 1,307,161 1,532,494 2,105,860
Sofware Licences 614,496 941,076 912,115 1,272,446 1,463,330 1,905,733
Depreciation Expense 156,381 178,291 204,357 303,398 383,295 324,818
Goodwill 2,794 1,567 1,567 1,567 (936) 1,168
Tools and supplies 23,040 40,299 62,573 88,296 88,296 63,720
Others (Material,ect) 93,122 120,538 42,402 39,207 106,136 118,841
COST BREAKDOWN (%) 2016A 2017A 2018A 2019A 2020A 2021A
Outsourcing Fees 28% 31% 39% 36% 38% 40%
Payroll Expense 32% 27% 28% 28% 27% 28%
Sofware Licences 28% 31% 24% 27% 26% 25%
Depreciation Expense 7% 6% 5% 6% 7% 4%
Goodwill 0% 0% 0% 0% 0% 0%
Tools and supplies 1% 1% 2% 2% 2% 1%
Others (Material,ect) 4% 4% 1% 1% 2% 2%
Financial Ratio
2016A 2017A 2018A 2019A 2020A 2021A
Revenue/Payroll 4.34 5.05 4.08 3.96 3.96 3.63
16% -19% -3% 0% -8%
Revenue/Adjusted-Payroll 4.16 4.94 3.90 3.72 3.65 3.44
Revenue/Sofware Licences 4.79 4.46 4.69 4.05 4.13 4.01
-7% 5% -14% 2% -3%
Revenue/Adjust-Sofware Licences 4.37 4.10 4.23 3.60 3.68 3.70
-6% 3% -15% 2% 1%
Revenue Forecast
Revenue Forecast
Capex
Income Statement Forecast
Operating Assumtions

More Related Content

Similar to VinaGame - Ratio.pdf

Valuation Of Maruti Suzuki
Valuation Of Maruti SuzukiValuation Of Maruti Suzuki
Valuation Of Maruti SuzukiAakash Singh
 
Valuation Of Maruti Suzuki
Valuation Of Maruti SuzukiValuation Of Maruti Suzuki
Valuation Of Maruti SuzukiAakash Singh
 
Cfa research presentation university at buffalo
Cfa research presentation university at buffalo Cfa research presentation university at buffalo
Cfa research presentation university at buffalo Ke Guo
 
KENYA AIRWAYS STATEMENT ANALYSIS- CIFA LUDENYO
KENYA AIRWAYS STATEMENT ANALYSIS- CIFA LUDENYOKENYA AIRWAYS STATEMENT ANALYSIS- CIFA LUDENYO
KENYA AIRWAYS STATEMENT ANALYSIS- CIFA LUDENYOJESSELUDENYO
 
Webcast 2Q17
Webcast 2Q17Webcast 2Q17
Webcast 2Q17Localiza
 
Zydus Wellness reports a subdued quarter, hold - Nirmal Bang
Zydus Wellness reports a subdued quarter, hold - Nirmal BangZydus Wellness reports a subdued quarter, hold - Nirmal Bang
Zydus Wellness reports a subdued quarter, hold - Nirmal BangIndiaNotes.com
 
Example Presentation Of Financial Reports PowerPoint Presentation Slides
Example Presentation Of Financial Reports PowerPoint Presentation Slides Example Presentation Of Financial Reports PowerPoint Presentation Slides
Example Presentation Of Financial Reports PowerPoint Presentation Slides SlideTeam
 
Example Presentation Of Financial Reports Powerpoint Presentation Slides
Example Presentation Of Financial Reports Powerpoint Presentation SlidesExample Presentation Of Financial Reports Powerpoint Presentation Slides
Example Presentation Of Financial Reports Powerpoint Presentation SlidesSlideTeam
 
Valuation Of ASHOK LEYLAND
Valuation Of ASHOK LEYLANDValuation Of ASHOK LEYLAND
Valuation Of ASHOK LEYLANDAakash Singh
 
Erin Parker Atvidcf V1
Erin Parker Atvidcf V1Erin Parker Atvidcf V1
Erin Parker Atvidcf V1Caneskid05
 
Financial Statement Analysis PowerPoint Presentation Slides
Financial Statement Analysis PowerPoint Presentation SlidesFinancial Statement Analysis PowerPoint Presentation Slides
Financial Statement Analysis PowerPoint Presentation SlidesSlideTeam
 
Maybank - proposed dividend reinvestment plan EGM 14 may 2010
Maybank - proposed dividend reinvestment plan EGM 14 may 2010Maybank - proposed dividend reinvestment plan EGM 14 may 2010
Maybank - proposed dividend reinvestment plan EGM 14 may 2010guest6398289
 
2 q13 investor presentation
2 q13 investor presentation2 q13 investor presentation
2 q13 investor presentationBancoABCRI
 
Rr q4 2016_presentation_final
Rr q4 2016_presentation_finalRr q4 2016_presentation_final
Rr q4 2016_presentation_finalRamirent Group
 

Similar to VinaGame - Ratio.pdf (20)

Valuation Of Maruti Suzuki
Valuation Of Maruti SuzukiValuation Of Maruti Suzuki
Valuation Of Maruti Suzuki
 
Valuation Of Maruti Suzuki
Valuation Of Maruti SuzukiValuation Of Maruti Suzuki
Valuation Of Maruti Suzuki
 
Cfa research presentation university at buffalo
Cfa research presentation university at buffalo Cfa research presentation university at buffalo
Cfa research presentation university at buffalo
 
KENYA AIRWAYS STATEMENT ANALYSIS- CIFA LUDENYO
KENYA AIRWAYS STATEMENT ANALYSIS- CIFA LUDENYOKENYA AIRWAYS STATEMENT ANALYSIS- CIFA LUDENYO
KENYA AIRWAYS STATEMENT ANALYSIS- CIFA LUDENYO
 
Webcast 2Q17
Webcast 2Q17Webcast 2Q17
Webcast 2Q17
 
Zydus Wellness reports a subdued quarter, hold - Nirmal Bang
Zydus Wellness reports a subdued quarter, hold - Nirmal BangZydus Wellness reports a subdued quarter, hold - Nirmal Bang
Zydus Wellness reports a subdued quarter, hold - Nirmal Bang
 
Wmt Model Template
Wmt Model TemplateWmt Model Template
Wmt Model Template
 
Presentation 4Q09
Presentation 4Q09Presentation 4Q09
Presentation 4Q09
 
Investors' Meeting Presentation - 4Q09 Results
Investors' Meeting Presentation - 4Q09 ResultsInvestors' Meeting Presentation - 4Q09 Results
Investors' Meeting Presentation - 4Q09 Results
 
Example print out-efm-de
Example print out-efm-deExample print out-efm-de
Example print out-efm-de
 
Example Presentation Of Financial Reports PowerPoint Presentation Slides
Example Presentation Of Financial Reports PowerPoint Presentation Slides Example Presentation Of Financial Reports PowerPoint Presentation Slides
Example Presentation Of Financial Reports PowerPoint Presentation Slides
 
Example Presentation Of Financial Reports Powerpoint Presentation Slides
Example Presentation Of Financial Reports Powerpoint Presentation SlidesExample Presentation Of Financial Reports Powerpoint Presentation Slides
Example Presentation Of Financial Reports Powerpoint Presentation Slides
 
Valuation Of ASHOK LEYLAND
Valuation Of ASHOK LEYLANDValuation Of ASHOK LEYLAND
Valuation Of ASHOK LEYLAND
 
Erin Parker Atvidcf V1
Erin Parker Atvidcf V1Erin Parker Atvidcf V1
Erin Parker Atvidcf V1
 
Financial Statement Analysis PowerPoint Presentation Slides
Financial Statement Analysis PowerPoint Presentation SlidesFinancial Statement Analysis PowerPoint Presentation Slides
Financial Statement Analysis PowerPoint Presentation Slides
 
Maybank - proposed dividend reinvestment plan EGM 14 may 2010
Maybank - proposed dividend reinvestment plan EGM 14 may 2010Maybank - proposed dividend reinvestment plan EGM 14 may 2010
Maybank - proposed dividend reinvestment plan EGM 14 may 2010
 
Q2 2011 financial_highlights
Q2 2011 financial_highlightsQ2 2011 financial_highlights
Q2 2011 financial_highlights
 
2 q13 investor presentation
2 q13 investor presentation2 q13 investor presentation
2 q13 investor presentation
 
Rr q4 2016_presentation_final
Rr q4 2016_presentation_finalRr q4 2016_presentation_final
Rr q4 2016_presentation_final
 
Apimec 3 q05 results
Apimec   3 q05 resultsApimec   3 q05 results
Apimec 3 q05 results
 

Recently uploaded

Cracking the Change Management Code Main New.pptx
Cracking the Change Management Code Main New.pptxCracking the Change Management Code Main New.pptx
Cracking the Change Management Code Main New.pptxWorkforce Group
 
The Inspiring Personality To Watch In 2024.pdf
The Inspiring Personality To Watch In 2024.pdfThe Inspiring Personality To Watch In 2024.pdf
The Inspiring Personality To Watch In 2024.pdfinsightssuccess2
 
Understanding UAE Labour Law: Key Points for Employers and Employees
Understanding UAE Labour Law: Key Points for Employers and EmployeesUnderstanding UAE Labour Law: Key Points for Employers and Employees
Understanding UAE Labour Law: Key Points for Employers and EmployeesDragon Dream Bar
 
NewBase 24 May 2024 Energy News issue - 1727 by Khaled Al Awadi_compresse...
NewBase   24 May  2024  Energy News issue - 1727 by Khaled Al Awadi_compresse...NewBase   24 May  2024  Energy News issue - 1727 by Khaled Al Awadi_compresse...
NewBase 24 May 2024 Energy News issue - 1727 by Khaled Al Awadi_compresse...Khaled Al Awadi
 
Event Report - IBM Think 2024 - It is all about AI and hybrid
Event Report - IBM Think 2024 - It is all about AI and hybridEvent Report - IBM Think 2024 - It is all about AI and hybrid
Event Report - IBM Think 2024 - It is all about AI and hybridHolger Mueller
 
Potato Flakes Manufacturing Plant Project Report.pdf
Potato Flakes Manufacturing Plant Project Report.pdfPotato Flakes Manufacturing Plant Project Report.pdf
Potato Flakes Manufacturing Plant Project Report.pdfhostl9518
 
Falcon Invoice Discounting Setup for Small Businesses
Falcon Invoice Discounting Setup for Small BusinessesFalcon Invoice Discounting Setup for Small Businesses
Falcon Invoice Discounting Setup for Small BusinessesFalcon investment
 
Hyundai capital 2024 1quarter Earnings release
Hyundai capital 2024 1quarter Earnings releaseHyundai capital 2024 1quarter Earnings release
Hyundai capital 2024 1quarter Earnings releaseirhcs
 
anas about venice for grade 6f about venice
anas about venice for grade 6f about veniceanas about venice for grade 6f about venice
anas about venice for grade 6f about veniceanasabutalha2013
 
Copyright: What Creators and Users of Art Need to Know
Copyright: What Creators and Users of Art Need to KnowCopyright: What Creators and Users of Art Need to Know
Copyright: What Creators and Users of Art Need to KnowMiriam Robeson
 
HR and Employment law update: May 2024.
HR and Employment law update:  May 2024.HR and Employment law update:  May 2024.
HR and Employment law update: May 2024.FelixPerez547899
 
Byrd & Chen’s Canadian Tax Principles 2023-2024 Edition 1st edition Volumes I...
Byrd & Chen’s Canadian Tax Principles 2023-2024 Edition 1st edition Volumes I...Byrd & Chen’s Canadian Tax Principles 2023-2024 Edition 1st edition Volumes I...
Byrd & Chen’s Canadian Tax Principles 2023-2024 Edition 1st edition Volumes I...ssuserf63bd7
 
India’s Recommended Women Surgeons to Watch in 2024.pdf
India’s Recommended Women Surgeons to Watch in 2024.pdfIndia’s Recommended Women Surgeons to Watch in 2024.pdf
India’s Recommended Women Surgeons to Watch in 2024.pdfCIOLOOKIndia
 
Team-Spandex-Northern University-CS1035.
Team-Spandex-Northern University-CS1035.Team-Spandex-Northern University-CS1035.
Team-Spandex-Northern University-CS1035.smalmahmud11
 
RMD24 | Retail media: hoe zet je dit in als je geen AH of Unilever bent? Heid...
RMD24 | Retail media: hoe zet je dit in als je geen AH of Unilever bent? Heid...RMD24 | Retail media: hoe zet je dit in als je geen AH of Unilever bent? Heid...
RMD24 | Retail media: hoe zet je dit in als je geen AH of Unilever bent? Heid...BBPMedia1
 
The-McKinsey-7S-Framework. strategic management
The-McKinsey-7S-Framework. strategic managementThe-McKinsey-7S-Framework. strategic management
The-McKinsey-7S-Framework. strategic managementBojamma2
 
Unlock Your TikTok Potential: Free TikTok Likes with InstBlast
Unlock Your TikTok Potential: Free TikTok Likes with InstBlastUnlock Your TikTok Potential: Free TikTok Likes with InstBlast
Unlock Your TikTok Potential: Free TikTok Likes with InstBlastInstBlast Marketing
 
Global Interconnection Group Joint Venture[960] (1).pdf
Global Interconnection Group Joint Venture[960] (1).pdfGlobal Interconnection Group Joint Venture[960] (1).pdf
Global Interconnection Group Joint Venture[960] (1).pdfHenry Tapper
 
Using Generative AI for Content Marketing
Using Generative AI for Content MarketingUsing Generative AI for Content Marketing
Using Generative AI for Content MarketingChuck Aikens
 
sales plan presentation by mckinsey alum
sales plan presentation by mckinsey alumsales plan presentation by mckinsey alum
sales plan presentation by mckinsey alumzyqmx62fgm
 

Recently uploaded (20)

Cracking the Change Management Code Main New.pptx
Cracking the Change Management Code Main New.pptxCracking the Change Management Code Main New.pptx
Cracking the Change Management Code Main New.pptx
 
The Inspiring Personality To Watch In 2024.pdf
The Inspiring Personality To Watch In 2024.pdfThe Inspiring Personality To Watch In 2024.pdf
The Inspiring Personality To Watch In 2024.pdf
 
Understanding UAE Labour Law: Key Points for Employers and Employees
Understanding UAE Labour Law: Key Points for Employers and EmployeesUnderstanding UAE Labour Law: Key Points for Employers and Employees
Understanding UAE Labour Law: Key Points for Employers and Employees
 
NewBase 24 May 2024 Energy News issue - 1727 by Khaled Al Awadi_compresse...
NewBase   24 May  2024  Energy News issue - 1727 by Khaled Al Awadi_compresse...NewBase   24 May  2024  Energy News issue - 1727 by Khaled Al Awadi_compresse...
NewBase 24 May 2024 Energy News issue - 1727 by Khaled Al Awadi_compresse...
 
Event Report - IBM Think 2024 - It is all about AI and hybrid
Event Report - IBM Think 2024 - It is all about AI and hybridEvent Report - IBM Think 2024 - It is all about AI and hybrid
Event Report - IBM Think 2024 - It is all about AI and hybrid
 
Potato Flakes Manufacturing Plant Project Report.pdf
Potato Flakes Manufacturing Plant Project Report.pdfPotato Flakes Manufacturing Plant Project Report.pdf
Potato Flakes Manufacturing Plant Project Report.pdf
 
Falcon Invoice Discounting Setup for Small Businesses
Falcon Invoice Discounting Setup for Small BusinessesFalcon Invoice Discounting Setup for Small Businesses
Falcon Invoice Discounting Setup for Small Businesses
 
Hyundai capital 2024 1quarter Earnings release
Hyundai capital 2024 1quarter Earnings releaseHyundai capital 2024 1quarter Earnings release
Hyundai capital 2024 1quarter Earnings release
 
anas about venice for grade 6f about venice
anas about venice for grade 6f about veniceanas about venice for grade 6f about venice
anas about venice for grade 6f about venice
 
Copyright: What Creators and Users of Art Need to Know
Copyright: What Creators and Users of Art Need to KnowCopyright: What Creators and Users of Art Need to Know
Copyright: What Creators and Users of Art Need to Know
 
HR and Employment law update: May 2024.
HR and Employment law update:  May 2024.HR and Employment law update:  May 2024.
HR and Employment law update: May 2024.
 
Byrd & Chen’s Canadian Tax Principles 2023-2024 Edition 1st edition Volumes I...
Byrd & Chen’s Canadian Tax Principles 2023-2024 Edition 1st edition Volumes I...Byrd & Chen’s Canadian Tax Principles 2023-2024 Edition 1st edition Volumes I...
Byrd & Chen’s Canadian Tax Principles 2023-2024 Edition 1st edition Volumes I...
 
India’s Recommended Women Surgeons to Watch in 2024.pdf
India’s Recommended Women Surgeons to Watch in 2024.pdfIndia’s Recommended Women Surgeons to Watch in 2024.pdf
India’s Recommended Women Surgeons to Watch in 2024.pdf
 
Team-Spandex-Northern University-CS1035.
Team-Spandex-Northern University-CS1035.Team-Spandex-Northern University-CS1035.
Team-Spandex-Northern University-CS1035.
 
RMD24 | Retail media: hoe zet je dit in als je geen AH of Unilever bent? Heid...
RMD24 | Retail media: hoe zet je dit in als je geen AH of Unilever bent? Heid...RMD24 | Retail media: hoe zet je dit in als je geen AH of Unilever bent? Heid...
RMD24 | Retail media: hoe zet je dit in als je geen AH of Unilever bent? Heid...
 
The-McKinsey-7S-Framework. strategic management
The-McKinsey-7S-Framework. strategic managementThe-McKinsey-7S-Framework. strategic management
The-McKinsey-7S-Framework. strategic management
 
Unlock Your TikTok Potential: Free TikTok Likes with InstBlast
Unlock Your TikTok Potential: Free TikTok Likes with InstBlastUnlock Your TikTok Potential: Free TikTok Likes with InstBlast
Unlock Your TikTok Potential: Free TikTok Likes with InstBlast
 
Global Interconnection Group Joint Venture[960] (1).pdf
Global Interconnection Group Joint Venture[960] (1).pdfGlobal Interconnection Group Joint Venture[960] (1).pdf
Global Interconnection Group Joint Venture[960] (1).pdf
 
Using Generative AI for Content Marketing
Using Generative AI for Content MarketingUsing Generative AI for Content Marketing
Using Generative AI for Content Marketing
 
sales plan presentation by mckinsey alum
sales plan presentation by mckinsey alumsales plan presentation by mckinsey alum
sales plan presentation by mckinsey alum
 

VinaGame - Ratio.pdf

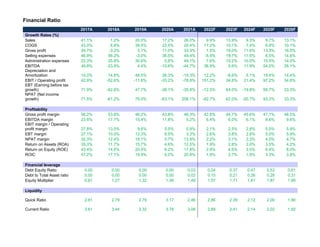
  • 1. Financial Ratio 2017A 2018A 2019A 2020A 2021A 2022F 2023F 2024F 2025F 2026F Growth Rates (%) Sales 41.1% 1.2% 20.0% 17.2% 26.0% 9.9% 13.9% 9.3% 9.7% 13.1% COGS 43.0% 6.8% 39.5% 22.5% 20.4% 17.2% 10.1% 7.4% 6.8% 10.1% Gross profit 39.7% -3.2% 3.1% 11.0% 33.3% 1.5% 19.0% 11.6% 13.3% 16.5% Selling expenses 46.9% 56.2% -3.0% 36.5% 49.4% -5.9% 19.7% 11.5% 6.5% 14.6% Administration expenses 22.3% 25.8% 30.6% 0.8% 49.1% 7.6% 15.2% 10.0% 10.5% 14.0% EBITDA 49.6% -23.9% 4.4% -10.6% -44.7% 36.9% 5.6% 11.9% 54.5% 26.1% Depreciation and Amortization 14.0% 14.6% 48.5% 26.3% -15.3% 12.2% -8.6% 5.1% 19.4% 14.4% EBIT / Operating profit 42.9% -52.6% -11.6% -33.2% -78.8% 151.2% 34.8% 21.4% 97.2% 34.6% EBT (Earning before tax growth) 71.9% -62.6% 47.7% -38.1% -35.8% -12.5% 64.0% -19.8% 95.7% 33.3% NPAT (Net income growth) 71.5% -61.2% 75.0% -63.1% 208.1% -82.7% 62.0% -20.7% 93.3% 33.3% Profitability Gross profit margin 56.2% 53.8% 46.2% 43.8% 46.3% 42.8% 44.7% 45.6% 47.1% 48.5% EBITDA margin 23.6% 17.7% 15.4% 11.8% 5.2% 6.4% 6.0% 6.1% 8.6% 9.6% EBIT margin / Operating profit margin 27.8% 13.0% 9.6% 5.5% 0.9% 2.1% 2.5% 2.8% 5.0% 5.9% EBT margin 27.1% 10.0% 12.3% 6.5% 3.3% 2.6% 3.8% 2.8% 5.0% 5.9% NPAT margin 32.3% 12.4% 18.1% 5.7% 13.9% 2.2% 3.1% 2.3% 4.0% 4.7% Return on Assets (ROA) 35.3% 11.7% 15.7% 4.6% 12.5% 1.9% 2.8% 2.0% 3.5% 4.2% Return on Equity (ROE) 43.4% 14.6% 20.5% 6.2% 17.8% 2.9% 4.6% 3.5% 6.4% 8.0% ROIC 47.2% 17.1% 19.9% 5.0% 20.8% 1.9% 2.7% 1.9% 3.3% 3.8% Financial leverage Debt Equity Ratio 0.00 0.00 0.00 0.00 0.03 0.24 0.37 0.47 0.53 0.61 Debt to Total Asset ratio 0.00 0.00 0.00 0.00 0.02 0.15 0.21 0.26 0.28 0.31 Equity Multiplier 0.81 1.27 1.32 1.36 1.49 1.57 1.71 1.81 1.87 1.95 Liquidity Quick Ratio 2.81 2.79 2.79 3.17 2.46 2.86 2.39 2.12 2.00 1.90 Current Ratio 3.61 3.44 3.32 3.78 3.06 2.89 2.41 2.14 2.02 1.92
  • 2. Financial Ratio 2017A 2018A 2019A 2020A 2021A 2022F 2023F 2024F 2025F 2026F Coverage ratios Interest coverage (EBITDA/interest) #DIV/0! #DIV/0! #DIV/0! #DIV/0! #DIV/0! #DIV/0! #DIV/0! #DIV/0! #DIV/0! #DIV/0! CFO/Current liabilities 3.8 2.0 1.6 3.3 0.3 0.1 0.0 0.0 0.1 0.1 CFO/Interest bearing debt No debt No debt No debt No debt 35.9 No debt No debt No debt No debt No debt Efficiency Receivable Turnover 14.0 12.8 13.9 12.9 11.1 10.8 11.8 11.6 11.6 11.8 Days Receivable Outstanding 26 29 26 28 33 34 31 32 31 31 Inventory Turnover 137.1 138.3 132.1 122.1 55.0 46.4 57.7 57.0 56.8 57.7 Days Inventory Outstanding 3 3 3 3 7 8 6 6 6 6 Payables Turnover 11.0 7.7 6.5 7.1 7.0 6.4 7.4 7.3 7.3 7.4 Days Payable Outstanding 33 47 56 51 52 57 49 50 50 49 Business Cycle (4) (16) (27) (20) (12) (15) (12) (12) (12) (12) Current Asset Turnover 1.6 1.3 1.2 1.1 1.1 1.1 1.1 1.1 1.1 1.1 Fixed Asset Turnover 28.1 20.1 12.5 10.9 14.4 14.5 14.4 14.4 14.9 16.5 Asset Turnover 1.1 0.9 0.9 0.8 0.9 0.9 0.9 0.9 0.9 0.9
  • 3. Financial Ratio COST BREAKDOWN (%) 2016A 2017A 2018A 2019A 2020A 2021A Outsourcing Fees 607,373 955,125 1,473,396 1,669,572 2,164,891 3,058,783 Payroll Expense 696,731 845,027 1,059,012 1,307,161 1,532,494 2,105,860 Sofware Licences 614,496 941,076 912,115 1,272,446 1,463,330 1,905,733 Depreciation Expense 156,381 178,291 204,357 303,398 383,295 324,818 Goodwill 2,794 1,567 1,567 1,567 (936) 1,168 Tools and supplies 23,040 40,299 62,573 88,296 88,296 63,720 Others (Material,ect) 93,122 120,538 42,402 39,207 106,136 118,841 COST BREAKDOWN (%) 2016A 2017A 2018A 2019A 2020A 2021A Outsourcing Fees 28% 31% 39% 36% 38% 40% Payroll Expense 32% 27% 28% 28% 27% 28% Sofware Licences 28% 31% 24% 27% 26% 25% Depreciation Expense 7% 6% 5% 6% 7% 4% Goodwill 0% 0% 0% 0% 0% 0% Tools and supplies 1% 1% 2% 2% 2% 1% Others (Material,ect) 4% 4% 1% 1% 2% 2%
  • 4. Financial Ratio 2016A 2017A 2018A 2019A 2020A 2021A Revenue/Payroll 4.34 5.05 4.08 3.96 3.96 3.63 16% -19% -3% 0% -8% Revenue/Adjusted-Payroll 4.16 4.94 3.90 3.72 3.65 3.44 Revenue/Sofware Licences 4.79 4.46 4.69 4.05 4.13 4.01 -7% 5% -14% 2% -3% Revenue/Adjust-Sofware Licences 4.37 4.10 4.23 3.60 3.68 3.70 -6% 3% -15% 2% 1%