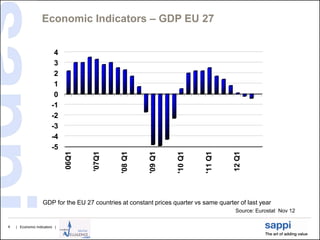
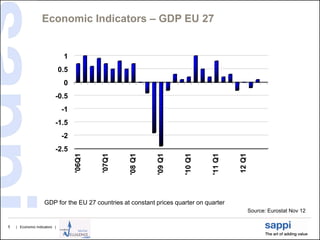
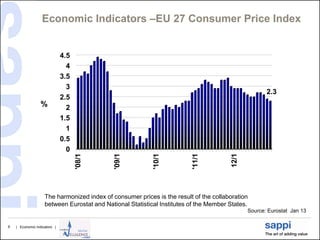
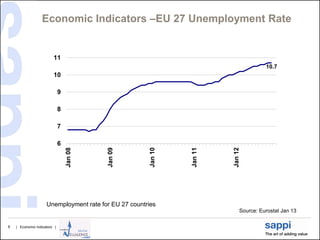
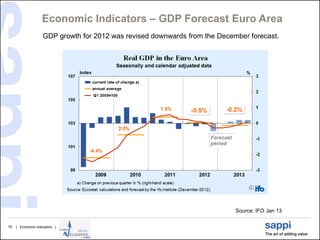
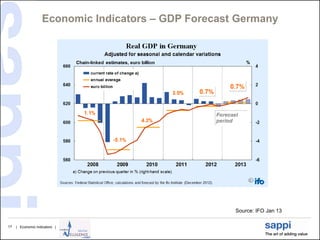
Economic Indicators
                                                          Last update 18.01.2013


1   | [Presentation title] | [Client Name] | [Date]
Economic Outlook Monthly Overview – January 2013

                    Europe:
                    • Consensus January GDP forecast for WE decreased from 0,2% to 0,1% for 2013. Forecast for
                       2014 is on 1,2%.
                    • While the EU industrial confidence improved slightly in December, the consumer confidence
                       indicator decreased somewhat.
                    • The IFO Business Climate index for Germany rose again in December. While companies
                       assessed their current business situation as somewhat less favorable they were considerable
                       less pessimistic about future business developments.
                    • The Euro area’s return to recession in Q4 2011 may well have extended through to end 2012.
                       Consensus predicts only a muted 2014 recovery in GDP after the declines in 2012 and 2013.

                    US:
                    • Consensus January GDP forecast for the US improved from 1,9% to 2,0% for 2013. Forecast
                       for 2014 is 2,8%
                    • The ‘fiscal cliff’ was averted as a late deal on taxes was reached. However, negotiations over
                       Federal spending cuts and the debt ceiling are postponed to February-March, extending
                       uncertainty over the outlook. Business activity remains fragile four years after the 2008 financial
                       crisis.

                    Japan:
                    • The January GDP growth forecast for Japan improved from 0,6% to 0,7% for 2013. Forecast for
                       2014 is 1,0%.
                    • Latest data show few signs of improvement in the Japanese economy.


2   | Economic Indicators |
Eurostat Data


3   | Economic Indicators |
Economic Indicators – GDP EU 27


                         4
                         3
                         2
                         1
                         0
                        -1
                        -2
                        -3
                        -4
                        -5
                                     '07Q1
                              06Q1


                                                                    '10 Q1
                                               '08 Q1


                                                         '09 Q1


                                                                              '11 Q1


                                                                                        12 Q1
                   GDP for the EU 27 countries at constant prices quarter vs same quarter of last year
                                                                                         Source: Eurostat Nov 12

4   | Economic Indicators |
Economic Indicators – GDP EU 27


                               1
                              0.5
                               0
                          -0.5
                               -1
                          -1.5
                               -2
                          -2.5


                                                                                         12 Q1
                                    '06Q1


                                            '07Q1


                                                             '09 Q1
                                                    '08 Q1


                                                                      '10 Q1


                                                                                '11 Q1
                    GDP for the EU 27 countries at constant prices quarter on quarter
                                                                                                 Source: Eurostat Nov 12

5   | Economic Indicators |
Economic Indicators –EU 27 Consumer Price Index


                              4.5
                                4
                              3.5
                                3
                                                                                                      2.3
                              2.5
                  %             2
                              1.5
                                1
                              0.5
                                0


                                                                                        12/1
                                    '08/1


                                             '09/1


                                                           '10/1


                                                                         '11/1
                    The harmonized index of consumer prices is the result of the collaboration
                    between Eurostat and National Statistical Institutes of the Member States.
                                                                                               Source: Eurostat Jan 13

6   | Economic Indicators |
Economic Indicators – ECB interest rate

                       5,5
                       5,0
                       4,5
                       4,0
                       3,5
                       3,0                                                                                           Dec 12; 2,2
                       2,5
                       2,0                                Eurozone inflation
                       1,5
                                   FED rate                                                                                Jan 13; 0,75
                       1,0
                       0,5                                                     ECB short-term rate                             Jan 13; 0,25
                       0,0
                      -0,5
                              Jan 08


                                                 Jan 09


                                                                      Jan 10


                                                                                         Jan 11


                                                                                                            Jan 12


                                                                                                                                  Jan 13
                                       July 08


                                                             Jul.09


                                                                                Jul.10


                                                                                                  July 11


                                                                                                                      Jul.12


                                                                                                                                           Jul.13
                                                                                                                     Source: ECB, FED Jan 13

7   | Economic Indicators |
Economic Indicators –EU 27 Unemployment Rate


                         11
                                                                                         10.7
                         10

                              9

                              8

                              7

                              6
                                  Jan 08


                                           Jan 09


                                                        Jan 10


                                                                 Jan 11


                                                                          Jan 12
                     Unemployment rate for EU 27 countries
                                                                               Source: Eurostat Jan 13

8   | Economic Indicators |
Economic Indicators – Industrial Confidence Ind EU
                   Industrial confidence within EU 27 improved again in December.


                         10
                          5
                          0
                         -5
                        -10
                        -15
                        -20
                        -25
                        -30
                        -35
                        -40
                                       Jan 07


                                                                           Jan 11
                              Jan 06


                                                Jan 08


                                                         Jan 09


                                                                  Jan 10


                                                                                    Jan 12
                   The Industrial Confidence Indicator is the arithmetic average of the answers to the
                   questions on production expectations, order books and stocks.
                                                                                             Source: Eurostat Jan 13

9   | Economic Indicators |
Economic Indicators – Consumer Confidence Ind EU
                   Consumer Confidence within EU 27 decreased slightly in December.


                                 0
                                -5
                               -10
                               -15
                               -20
                               -25
                               -30
                               -35
                                     Jan 06


                                              Jan 07


                                                       Jan 08


                                                                Jan 09


                                                                         Jan 10


                                                                                  Jan 11


                                                                                           Jan 12
                      The Consumer Confidence Indicator is the arithmetic average of the answers to the questions
                      on the financial situation of households and general economic situation (past and future)
                      together with that on the advisability of making major purchases.
                                                                                                    Source: Eurostat Jan 13

10   | Economic Indicators |
Economic Indicators – Capacity Utilization
                   in Manufacturing Industry in % - EU 27


                               85

                               80

                            75
                           %
                            70

                               65

                               60
                                    04Q1

                                           05Q1

                                                  06Q1

                                                         07Q1

                                                                08Q1

                                                                       09Q1

                                                                              10Q1

                                                                                      11Q1

                                                                                              12Q1
                    The capacity utilization in manufacturing industry gives the level of capacity utilization
                    in percent, as assessed by managers in manufacturing industry.
                                                                                                     Source: Eurostat Nov 12

11   | Economic Indicators |
Ifo Data


12   | Economic Indicators |
Economic Indicators – IFO World Economic Climate
                    The Ifo World Economic climate worsened again in the 4th quarter 2012


                      This indicator is being updated on a quarterly basis.
                                                                              Source: IFO Nov 12

13   | Economic Indicators |
Economic Indicators – IFO WE Economic Climate
                    The economic climate for Western Europe worsened again in the
                    4th quarter 2012.


                         This indicator is being updated on a quarterly basis.
                                                                                 Source: IFO Nov 12

14   | Economic Indicators |
Economic Indicators – IFO NA Economic Climate


                    This indicator is being updated on a quarterly basis.
                                                                            Source: IFO Nov 12

15   | Economic Indicators |
Economic Indicators – GDP Forecast Euro Area
                    GDP growth for 2012 was revised downwards from the December forecast.


                                                                            Source: IFO Jan 13

16   | Economic Indicators |
Economic Indicators – GDP Forecast Germany


                                                     Source: IFO Jan 13

17   | Economic Indicators |
Economic Indicators – Exchange rate $ vs €


                                                       Source: IFO Jan 13

18   | Economic Indicators |
Economic Indicators –
                   Ifo business situation and 6 month expectations

                    Business situation                                          6 months expectations
             125                                                         115
             120                                                         110
             115                                                         105
             110                                                         100
             105
                                                                          95
             100
              95                                                          90
              90                                                          85
              85                                                          80
              80                                                          75
                   Jan 08


                               Jan 09


                                        Jan 10


                                                 Jan 11


                                                          Jan 12


                                                                               Jan 08


                                                                                        Jan 09


                                                                                                 Jan 10


                                                                                                          Jan 11


                                                                                                                        Jan 12
                     The Ifo Business Climate index for Germany rose again in December. While companies assessed
                     their current business situation as somewhat less favorable than last month, they were
                     considerably less pessimistic about future business developments. German companies are more
                     confident about the future.
                     The IFO-Institut für Wirtschaftsforschung business situation index shows the current evaluation of the
                     economic situation, while the 6 month expectations index shows the expectations of the companies for the next
                     6 months. Over 7000 companies are being interviewed.
                                                                                                                   Source: IFO Jan 13

19   | Economic Indicators |
Economic Indicators – IFO Assessment of Current
                   Business Situation


                     The Ifo Business Climate index for Germany rose again in December. While companies assessed
                     their current business situation as somewhat less favorable than last month, they were
                     considerably less pessimistic about future business developments. German companies are more
                     confident about the future.
                                                                                              Source: IFO Jan 13

20   | Economic Indicators |
Economic Indicators – IFO business climate index
                   printing industry
                    The business climate within the printing industry improved slightly from -9 to -7 in December.


                                20
                                10
                                 0
                               -10
                               -20
                               -30
                               -40
                               -50
                               -60
                                     Jan 08


                                                  Jan 09


                                                                 Jan 10


                                                                               Jan 11


                                                                                              Jan 12
                    The IFO-Institut für Wirtschaftsforschung business climate index for the printing industry is based on a
                    monthly representative questionnaire to 300 German printers.

                                                                             Source: IFO Jan 13, bundesverband druck und medien

21   | Economic Indicators |
Economic Indicators – IFO business climate index
                   printing industry

                   Business Development at German Printers – December 12:

                    The assessment of the current business situation in the
                          printing industry improved from +12%points in November to now
                          +21%, 9%points better than in the same month of last year.

                    The business climate – an indicator for the development in
                     the next quarter – remained negative with -7%, 2% points up from
                     -9% in November.

                    The business expectations for the coming 6 months remained
                     negative for the 4th month in succession, decreasing again from -
                     28% to -32%points.

                     The IFO-Institut für Wirtschaftsforschung business climate index for the printing industry is based on a
                     monthly representative questionnaire to 300 German printers.

                                                                              Source: IFO Jan 13, bundesverband druck und medien

22   | Economic Indicators |
Zenith Data


23   | Economic Indicators |
Advertising Growth – Zenith 12/12 Press release


                   Global ad expenditure forecast to strengthen over the next three years,
                    rising from 3,3 % in 2012 to 4,1% in 2013 and 5,6% in 2015

                   Peripheral Eurozone to shrink 4,0% in 2013, stabilize in 2014 and grow
                    2% in 2015

                   Developing markets to contribute 61% of adspend growth between
                    2012 and 2015 and increase their share of global adspend from 34% to
                    37%

                   Online video and social media to help drive 20% annual growth in
                    internet display over the next three years

                   Internet advertising to exceed combined newspaper and magazine total
                    in 2015

                                                                            Source: Zenith 12/12

24   | Economic Indicators |
Advertising Growth – Zenith 12/12 Press release


                                                           At current prices
                                                          Source: Zenith 12/12

25   | Economic Indicators |
Advertising Growth – Zenith 12/12 Press release


                                                            Source: Zenith 12/12

26   | Economic Indicators |

Economic indicators December 2012 - part 1

  • 1.
    Economic Indicators Last update 18.01.2013 1 | [Presentation title] | [Client Name] | [Date]
  • 2.
    Economic Outlook MonthlyOverview – January 2013 Europe: • Consensus January GDP forecast for WE decreased from 0,2% to 0,1% for 2013. Forecast for 2014 is on 1,2%. • While the EU industrial confidence improved slightly in December, the consumer confidence indicator decreased somewhat. • The IFO Business Climate index for Germany rose again in December. While companies assessed their current business situation as somewhat less favorable they were considerable less pessimistic about future business developments. • The Euro area’s return to recession in Q4 2011 may well have extended through to end 2012. Consensus predicts only a muted 2014 recovery in GDP after the declines in 2012 and 2013. US: • Consensus January GDP forecast for the US improved from 1,9% to 2,0% for 2013. Forecast for 2014 is 2,8% • The ‘fiscal cliff’ was averted as a late deal on taxes was reached. However, negotiations over Federal spending cuts and the debt ceiling are postponed to February-March, extending uncertainty over the outlook. Business activity remains fragile four years after the 2008 financial crisis. Japan: • The January GDP growth forecast for Japan improved from 0,6% to 0,7% for 2013. Forecast for 2014 is 1,0%. • Latest data show few signs of improvement in the Japanese economy. 2 | Economic Indicators |
  • 3.
    Eurostat Data 3 | Economic Indicators |
  • 4.
    Economic Indicators –GDP EU 27 4 3 2 1 0 -1 -2 -3 -4 -5 '07Q1 06Q1 '10 Q1 '08 Q1 '09 Q1 '11 Q1 12 Q1 GDP for the EU 27 countries at constant prices quarter vs same quarter of last year Source: Eurostat Nov 12 4 | Economic Indicators |
  • 5.
    Economic Indicators –GDP EU 27 1 0.5 0 -0.5 -1 -1.5 -2 -2.5 12 Q1 '06Q1 '07Q1 '09 Q1 '08 Q1 '10 Q1 '11 Q1 GDP for the EU 27 countries at constant prices quarter on quarter Source: Eurostat Nov 12 5 | Economic Indicators |
  • 6.
    Economic Indicators –EU27 Consumer Price Index 4.5 4 3.5 3 2.3 2.5 % 2 1.5 1 0.5 0 12/1 '08/1 '09/1 '10/1 '11/1 The harmonized index of consumer prices is the result of the collaboration between Eurostat and National Statistical Institutes of the Member States. Source: Eurostat Jan 13 6 | Economic Indicators |
  • 7.
    Economic Indicators –ECB interest rate 5,5 5,0 4,5 4,0 3,5 3,0 Dec 12; 2,2 2,5 2,0 Eurozone inflation 1,5 FED rate Jan 13; 0,75 1,0 0,5 ECB short-term rate Jan 13; 0,25 0,0 -0,5 Jan 08 Jan 09 Jan 10 Jan 11 Jan 12 Jan 13 July 08 Jul.09 Jul.10 July 11 Jul.12 Jul.13 Source: ECB, FED Jan 13 7 | Economic Indicators |
  • 8.
    Economic Indicators –EU27 Unemployment Rate 11 10.7 10 9 8 7 6 Jan 08 Jan 09 Jan 10 Jan 11 Jan 12 Unemployment rate for EU 27 countries Source: Eurostat Jan 13 8 | Economic Indicators |
  • 9.
    Economic Indicators –Industrial Confidence Ind EU Industrial confidence within EU 27 improved again in December. 10 5 0 -5 -10 -15 -20 -25 -30 -35 -40 Jan 07 Jan 11 Jan 06 Jan 08 Jan 09 Jan 10 Jan 12 The Industrial Confidence Indicator is the arithmetic average of the answers to the questions on production expectations, order books and stocks. Source: Eurostat Jan 13 9 | Economic Indicators |
  • 10.
    Economic Indicators –Consumer Confidence Ind EU Consumer Confidence within EU 27 decreased slightly in December. 0 -5 -10 -15 -20 -25 -30 -35 Jan 06 Jan 07 Jan 08 Jan 09 Jan 10 Jan 11 Jan 12 The Consumer Confidence Indicator is the arithmetic average of the answers to the questions on the financial situation of households and general economic situation (past and future) together with that on the advisability of making major purchases. Source: Eurostat Jan 13 10 | Economic Indicators |
  • 11.
    Economic Indicators –Capacity Utilization in Manufacturing Industry in % - EU 27 85 80 75 % 70 65 60 04Q1 05Q1 06Q1 07Q1 08Q1 09Q1 10Q1 11Q1 12Q1 The capacity utilization in manufacturing industry gives the level of capacity utilization in percent, as assessed by managers in manufacturing industry. Source: Eurostat Nov 12 11 | Economic Indicators |
  • 12.
    Ifo Data 12 | Economic Indicators |
  • 13.
    Economic Indicators –IFO World Economic Climate The Ifo World Economic climate worsened again in the 4th quarter 2012 This indicator is being updated on a quarterly basis. Source: IFO Nov 12 13 | Economic Indicators |
  • 14.
    Economic Indicators –IFO WE Economic Climate The economic climate for Western Europe worsened again in the 4th quarter 2012. This indicator is being updated on a quarterly basis. Source: IFO Nov 12 14 | Economic Indicators |
  • 15.
    Economic Indicators –IFO NA Economic Climate This indicator is being updated on a quarterly basis. Source: IFO Nov 12 15 | Economic Indicators |
  • 16.
    Economic Indicators –GDP Forecast Euro Area GDP growth for 2012 was revised downwards from the December forecast. Source: IFO Jan 13 16 | Economic Indicators |
  • 17.
    Economic Indicators –GDP Forecast Germany Source: IFO Jan 13 17 | Economic Indicators |
  • 18.
    Economic Indicators –Exchange rate $ vs € Source: IFO Jan 13 18 | Economic Indicators |
  • 19.
    Economic Indicators – Ifo business situation and 6 month expectations Business situation 6 months expectations 125 115 120 110 115 105 110 100 105 95 100 95 90 90 85 85 80 80 75 Jan 08 Jan 09 Jan 10 Jan 11 Jan 12 Jan 08 Jan 09 Jan 10 Jan 11 Jan 12 The Ifo Business Climate index for Germany rose again in December. While companies assessed their current business situation as somewhat less favorable than last month, they were considerably less pessimistic about future business developments. German companies are more confident about the future. The IFO-Institut für Wirtschaftsforschung business situation index shows the current evaluation of the economic situation, while the 6 month expectations index shows the expectations of the companies for the next 6 months. Over 7000 companies are being interviewed. Source: IFO Jan 13 19 | Economic Indicators |
  • 20.
    Economic Indicators –IFO Assessment of Current Business Situation The Ifo Business Climate index for Germany rose again in December. While companies assessed their current business situation as somewhat less favorable than last month, they were considerably less pessimistic about future business developments. German companies are more confident about the future. Source: IFO Jan 13 20 | Economic Indicators |
  • 21.
    Economic Indicators –IFO business climate index printing industry The business climate within the printing industry improved slightly from -9 to -7 in December. 20 10 0 -10 -20 -30 -40 -50 -60 Jan 08 Jan 09 Jan 10 Jan 11 Jan 12 The IFO-Institut für Wirtschaftsforschung business climate index for the printing industry is based on a monthly representative questionnaire to 300 German printers. Source: IFO Jan 13, bundesverband druck und medien 21 | Economic Indicators |
  • 22.
    Economic Indicators –IFO business climate index printing industry Business Development at German Printers – December 12:  The assessment of the current business situation in the printing industry improved from +12%points in November to now +21%, 9%points better than in the same month of last year.  The business climate – an indicator for the development in the next quarter – remained negative with -7%, 2% points up from -9% in November.  The business expectations for the coming 6 months remained negative for the 4th month in succession, decreasing again from - 28% to -32%points. The IFO-Institut für Wirtschaftsforschung business climate index for the printing industry is based on a monthly representative questionnaire to 300 German printers. Source: IFO Jan 13, bundesverband druck und medien 22 | Economic Indicators |
  • 23.
    Zenith Data 23 | Economic Indicators |
  • 24.
    Advertising Growth –Zenith 12/12 Press release  Global ad expenditure forecast to strengthen over the next three years, rising from 3,3 % in 2012 to 4,1% in 2013 and 5,6% in 2015  Peripheral Eurozone to shrink 4,0% in 2013, stabilize in 2014 and grow 2% in 2015  Developing markets to contribute 61% of adspend growth between 2012 and 2015 and increase their share of global adspend from 34% to 37%  Online video and social media to help drive 20% annual growth in internet display over the next three years  Internet advertising to exceed combined newspaper and magazine total in 2015 Source: Zenith 12/12 24 | Economic Indicators |
  • 25.
    Advertising Growth –Zenith 12/12 Press release At current prices Source: Zenith 12/12 25 | Economic Indicators |
  • 26.
    Advertising Growth –Zenith 12/12 Press release Source: Zenith 12/12 26 | Economic Indicators |