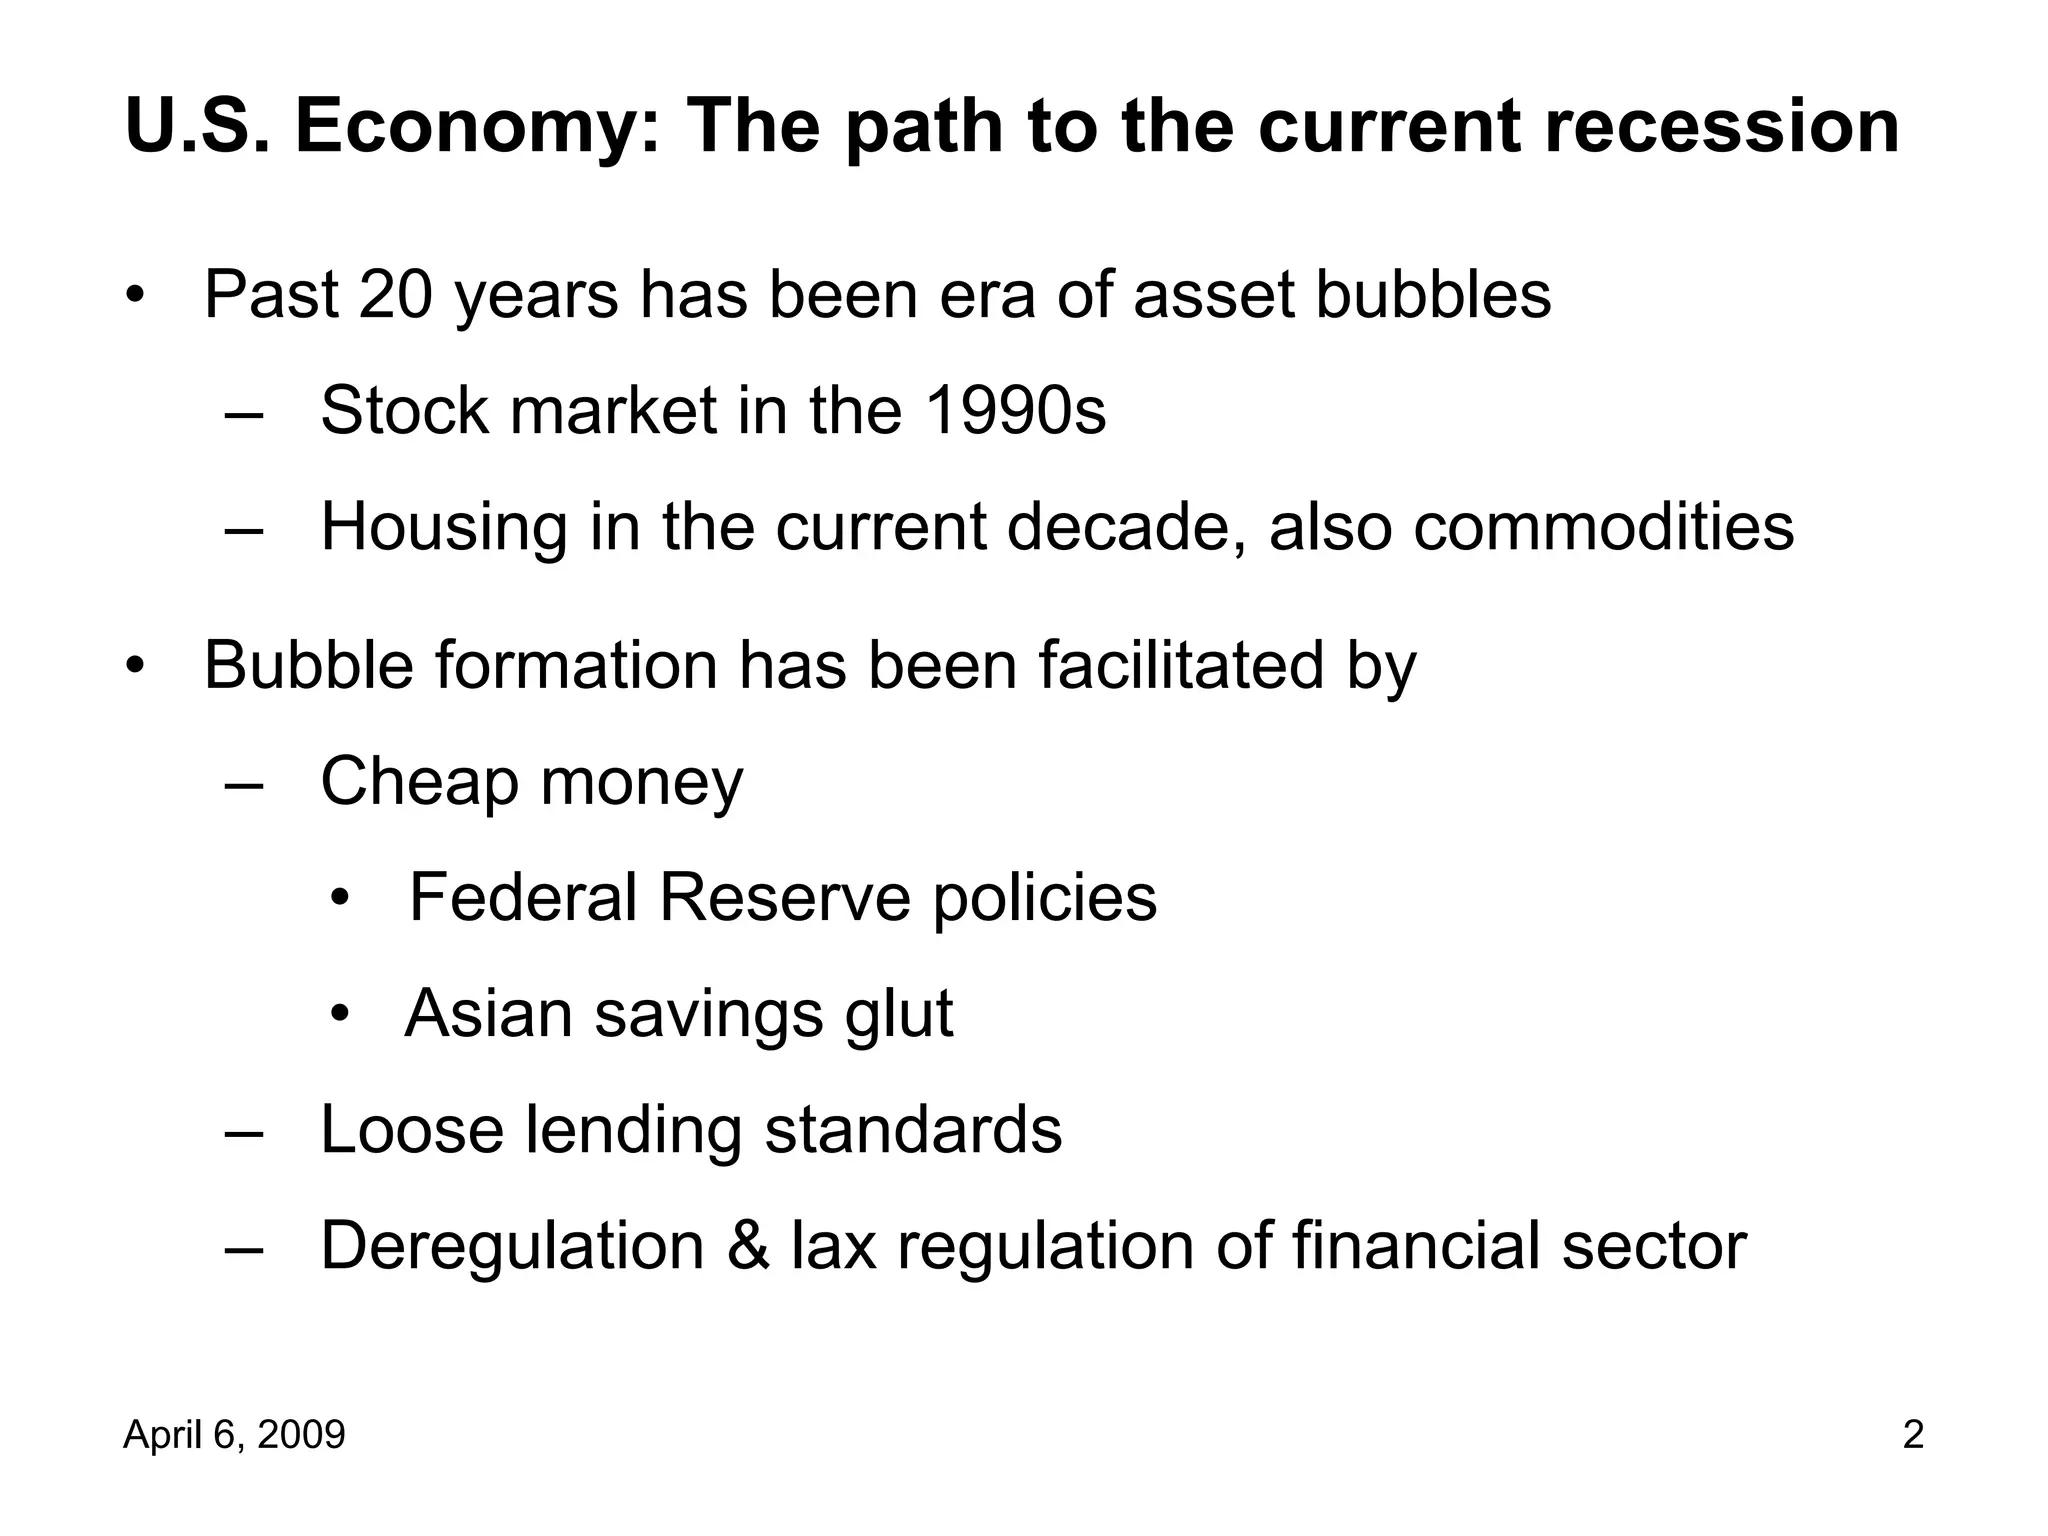
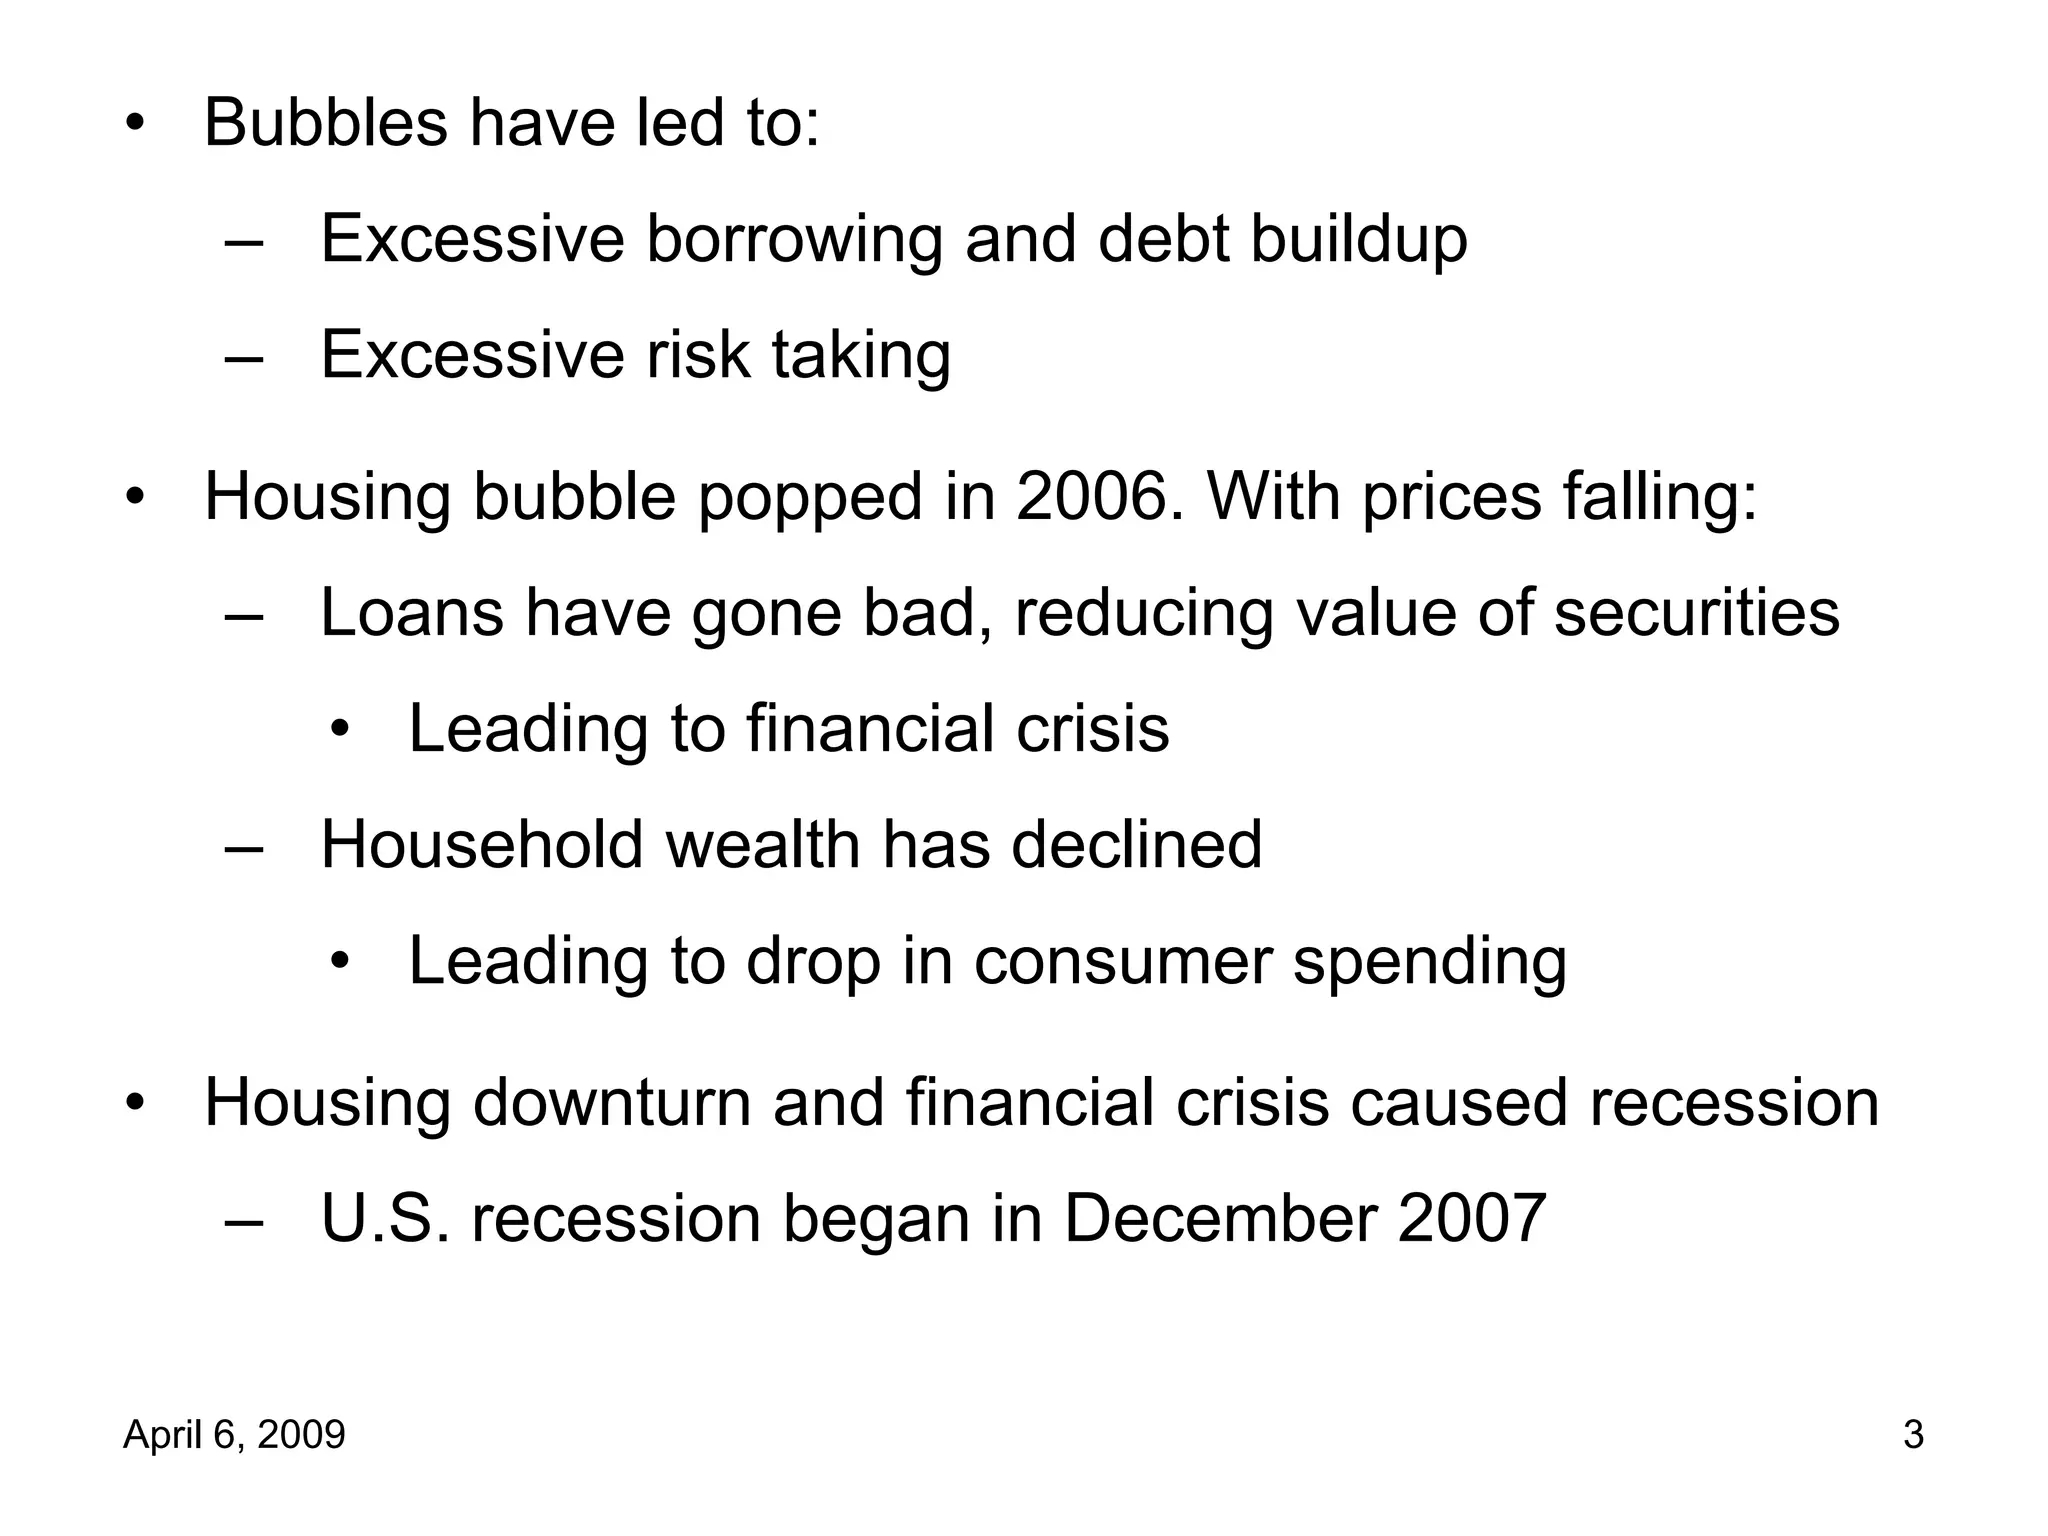
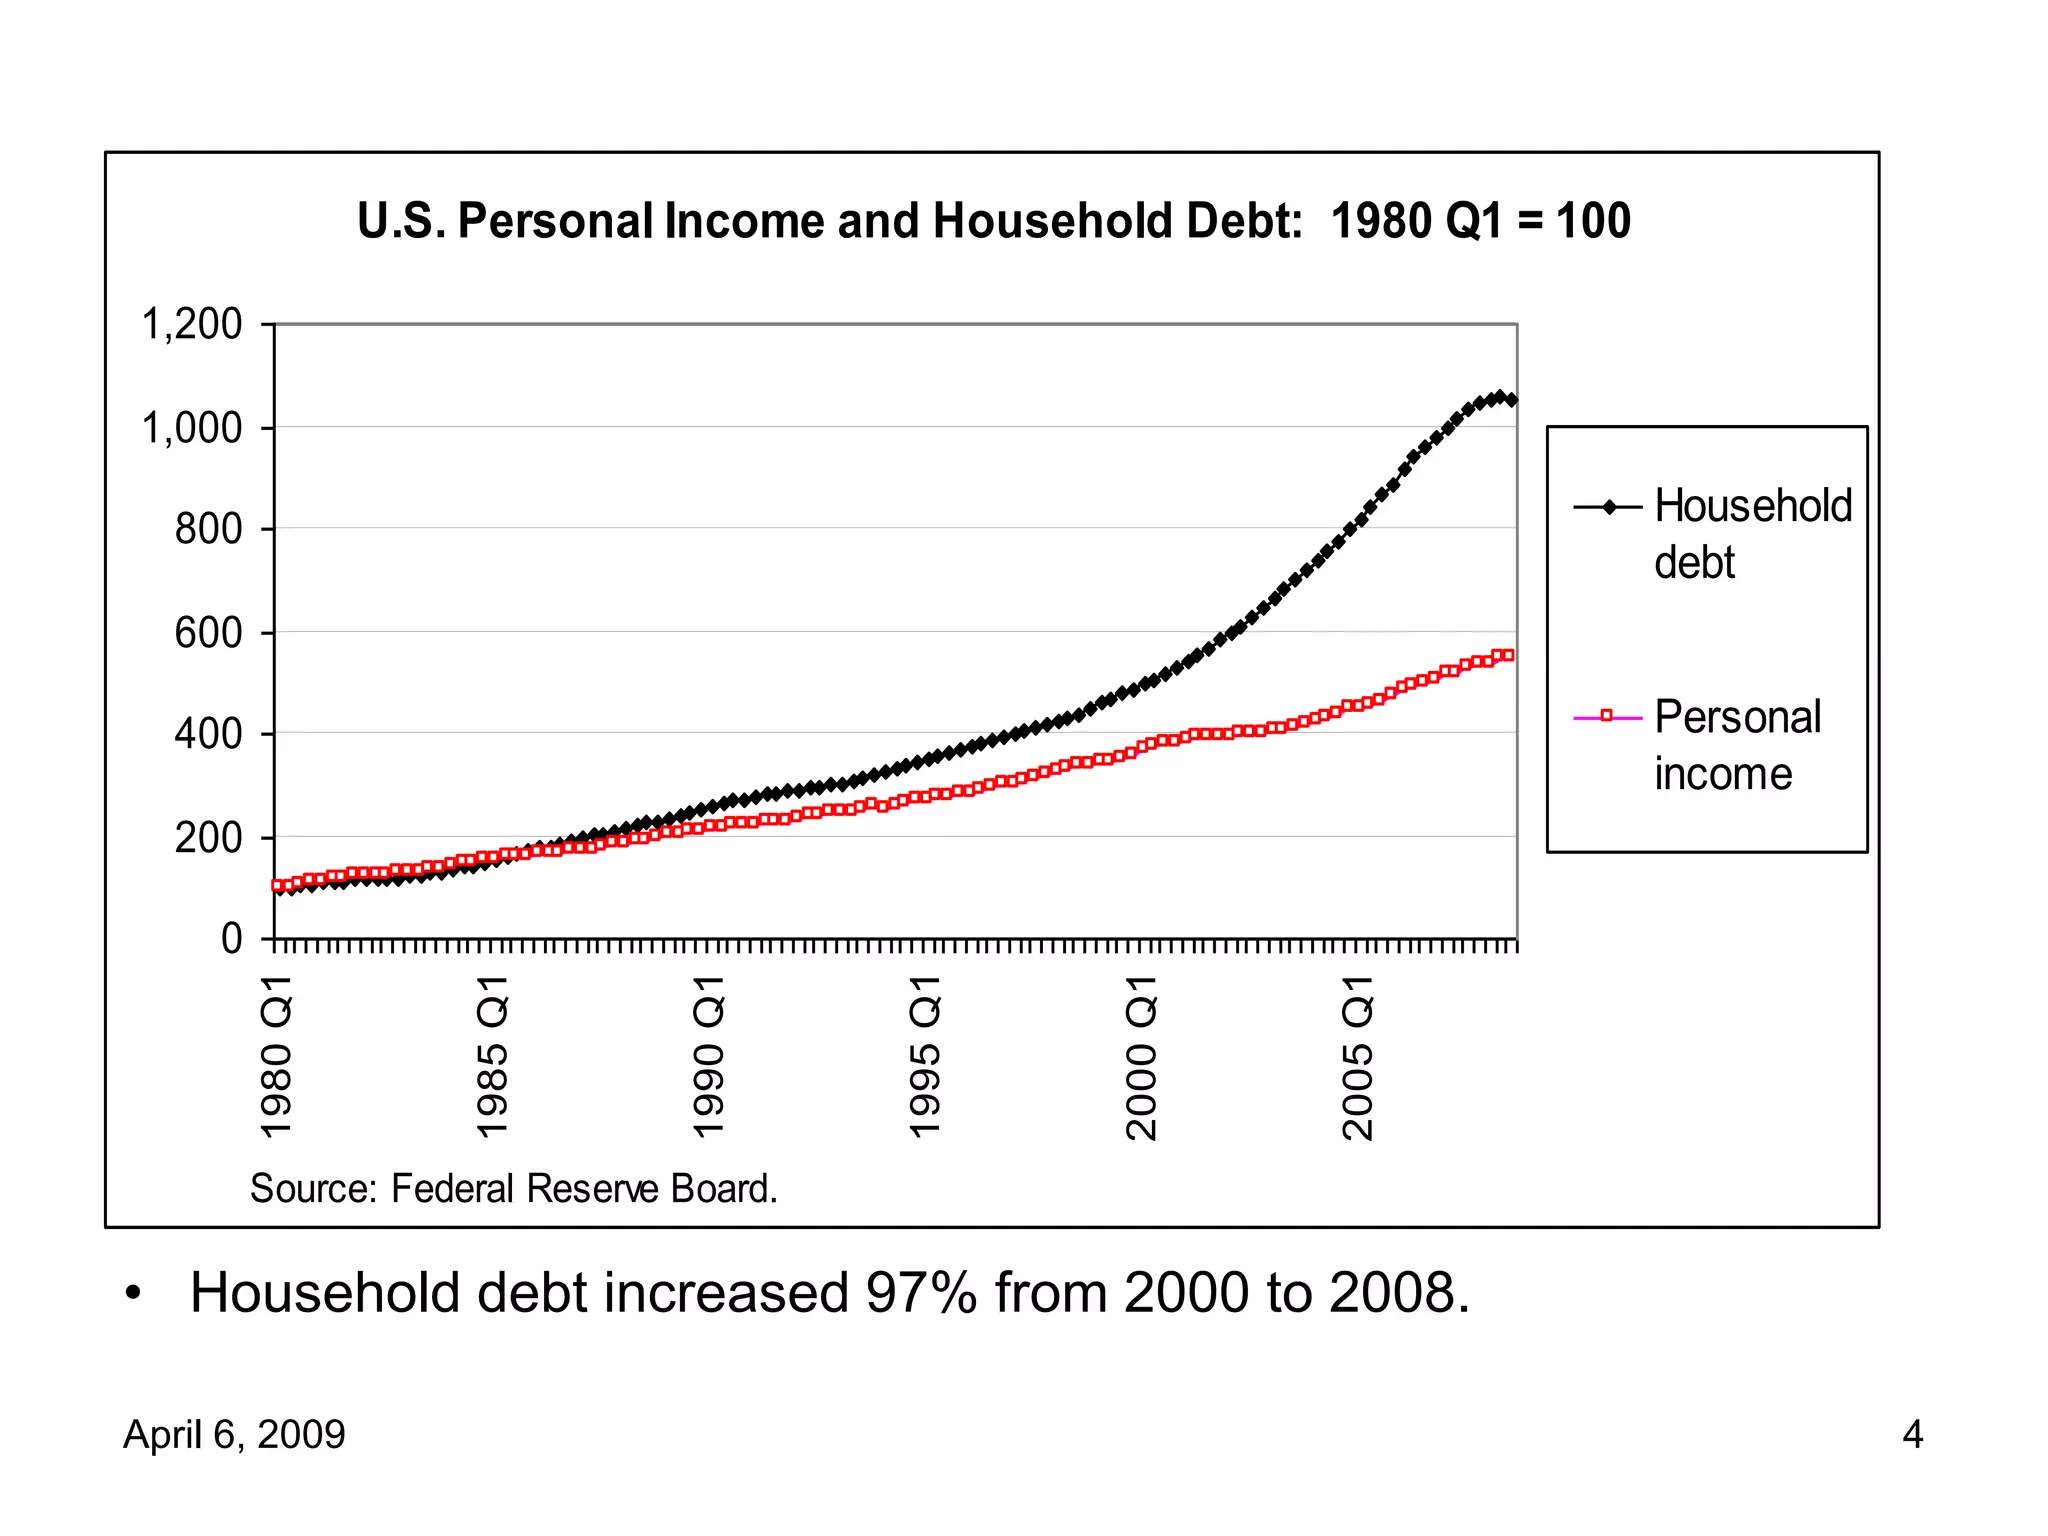
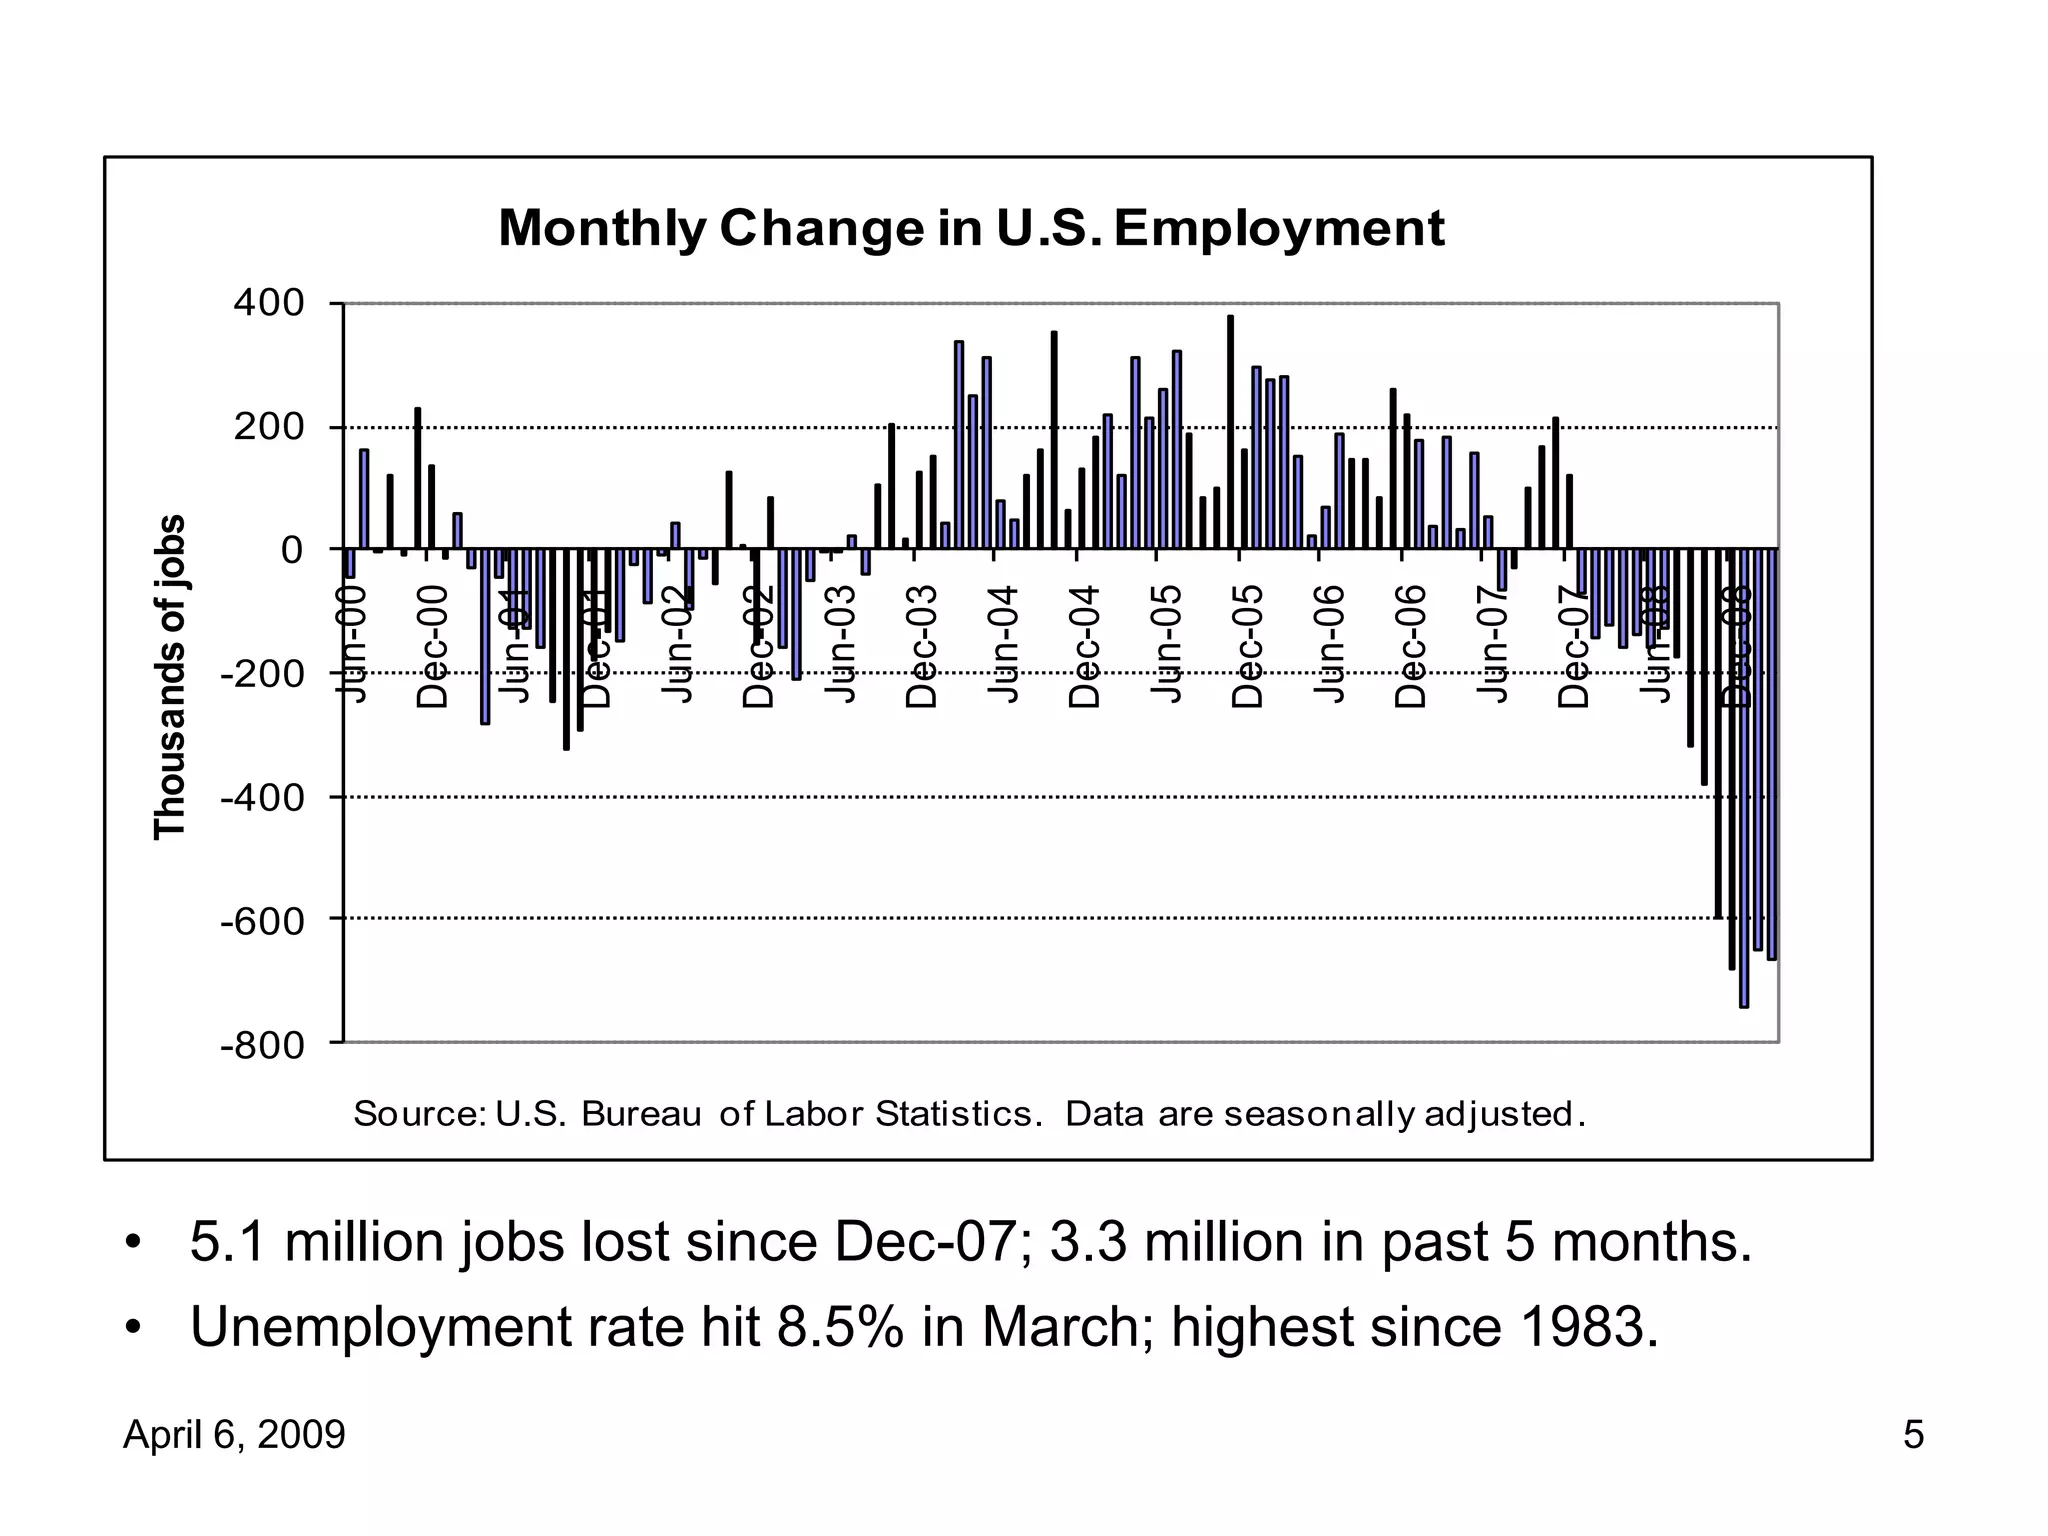
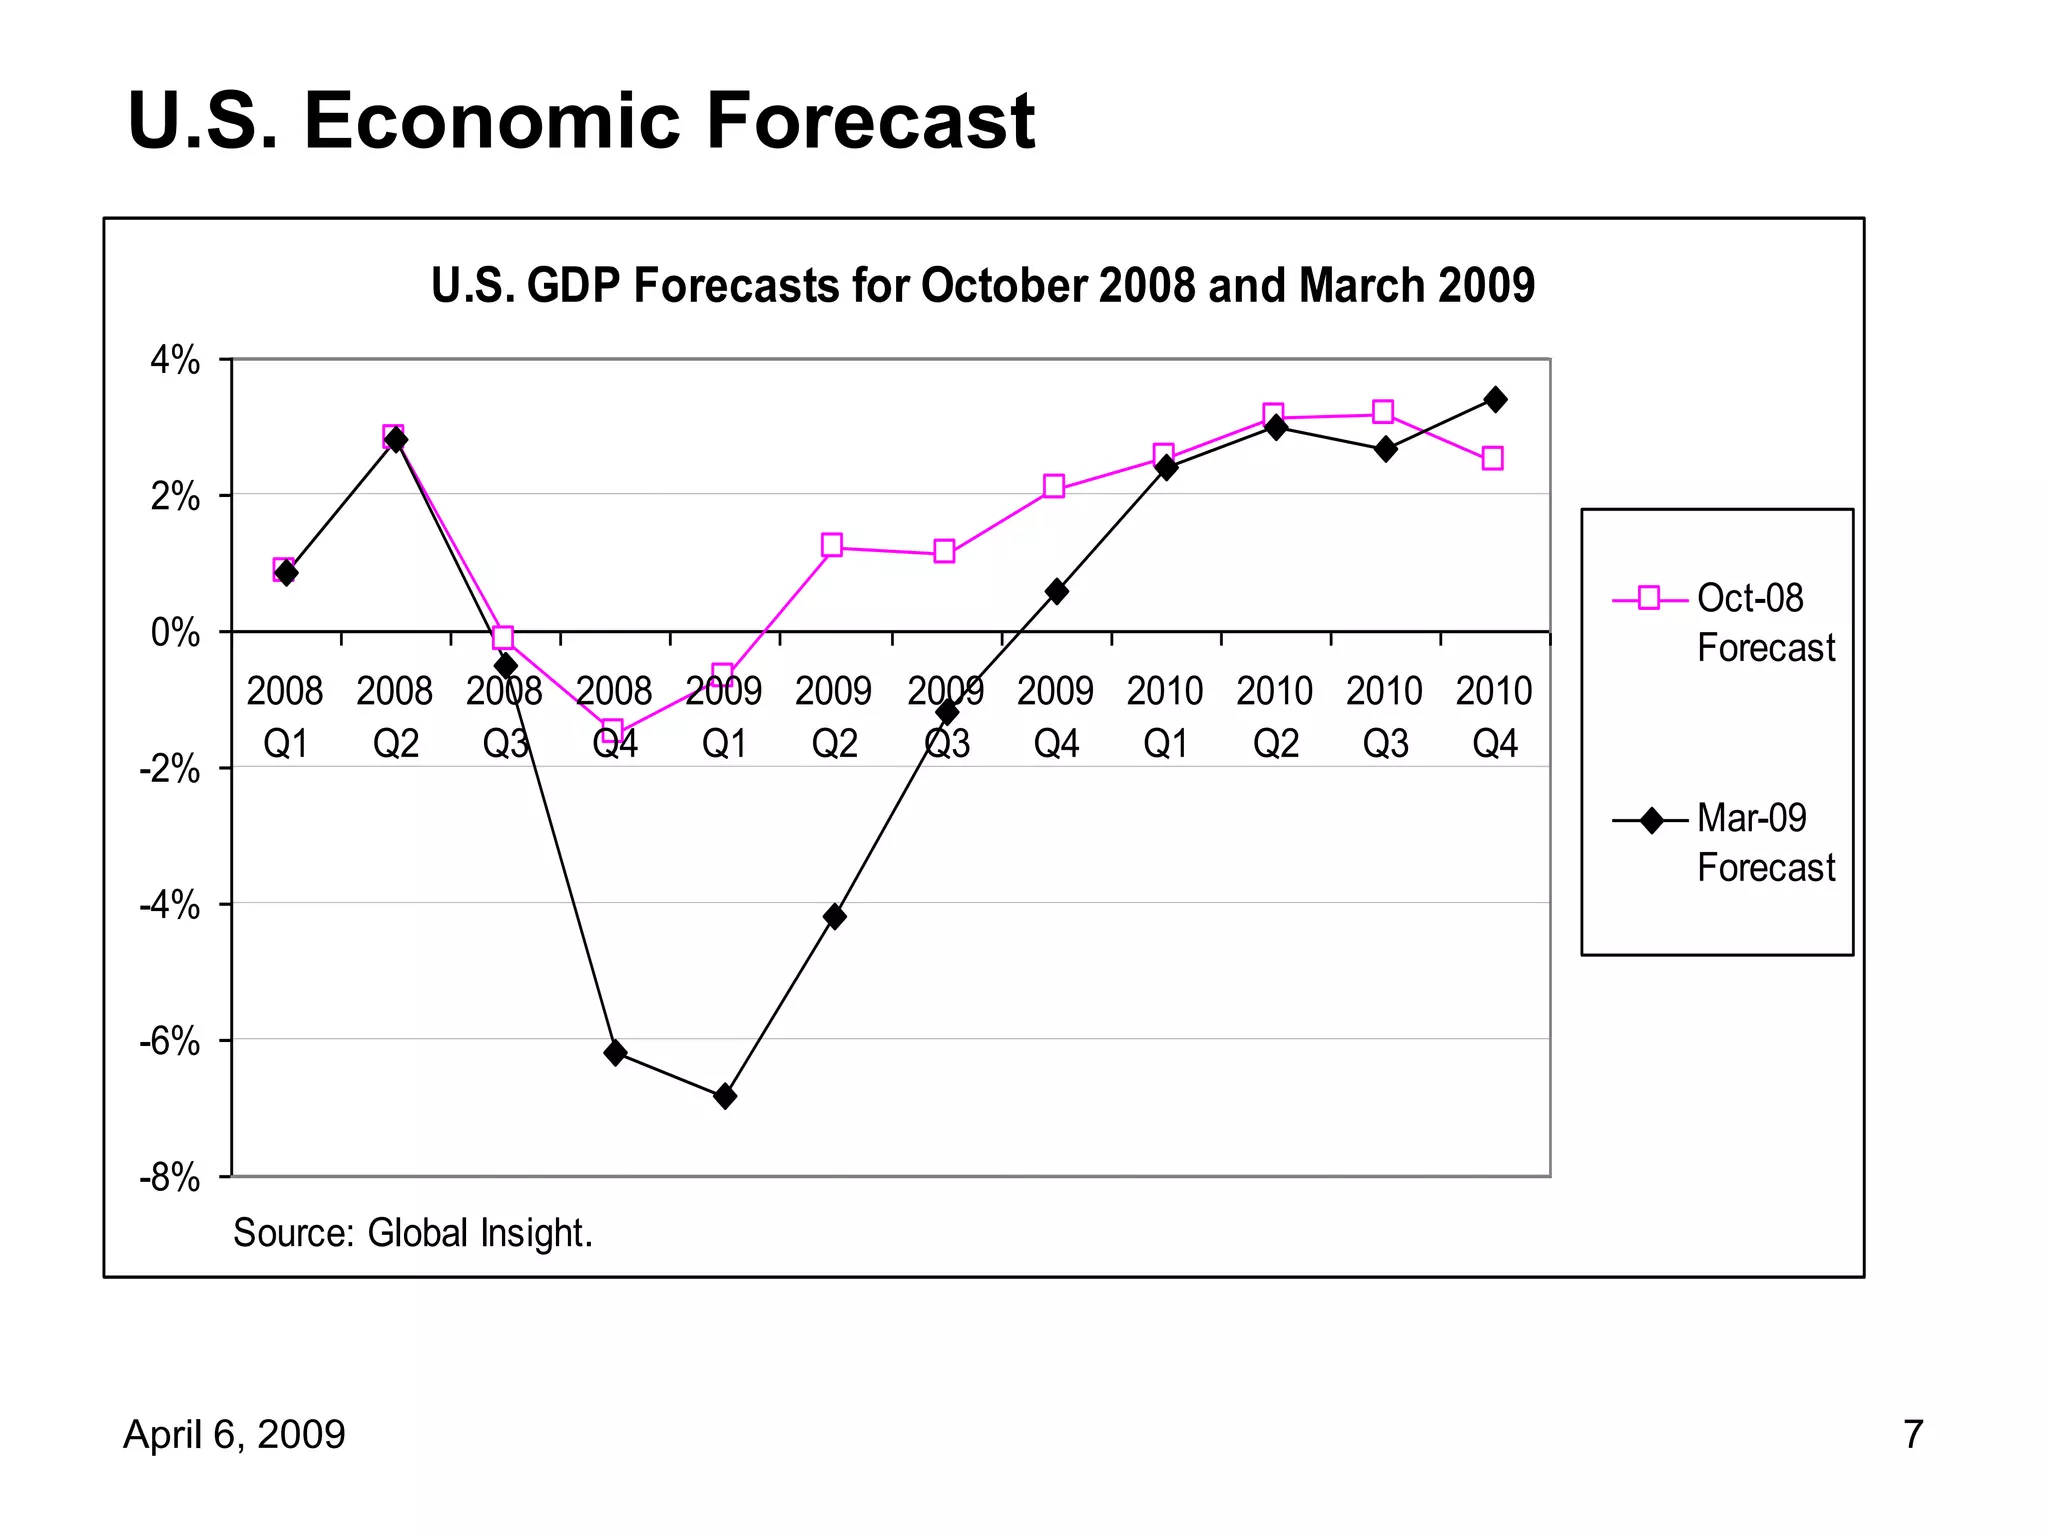
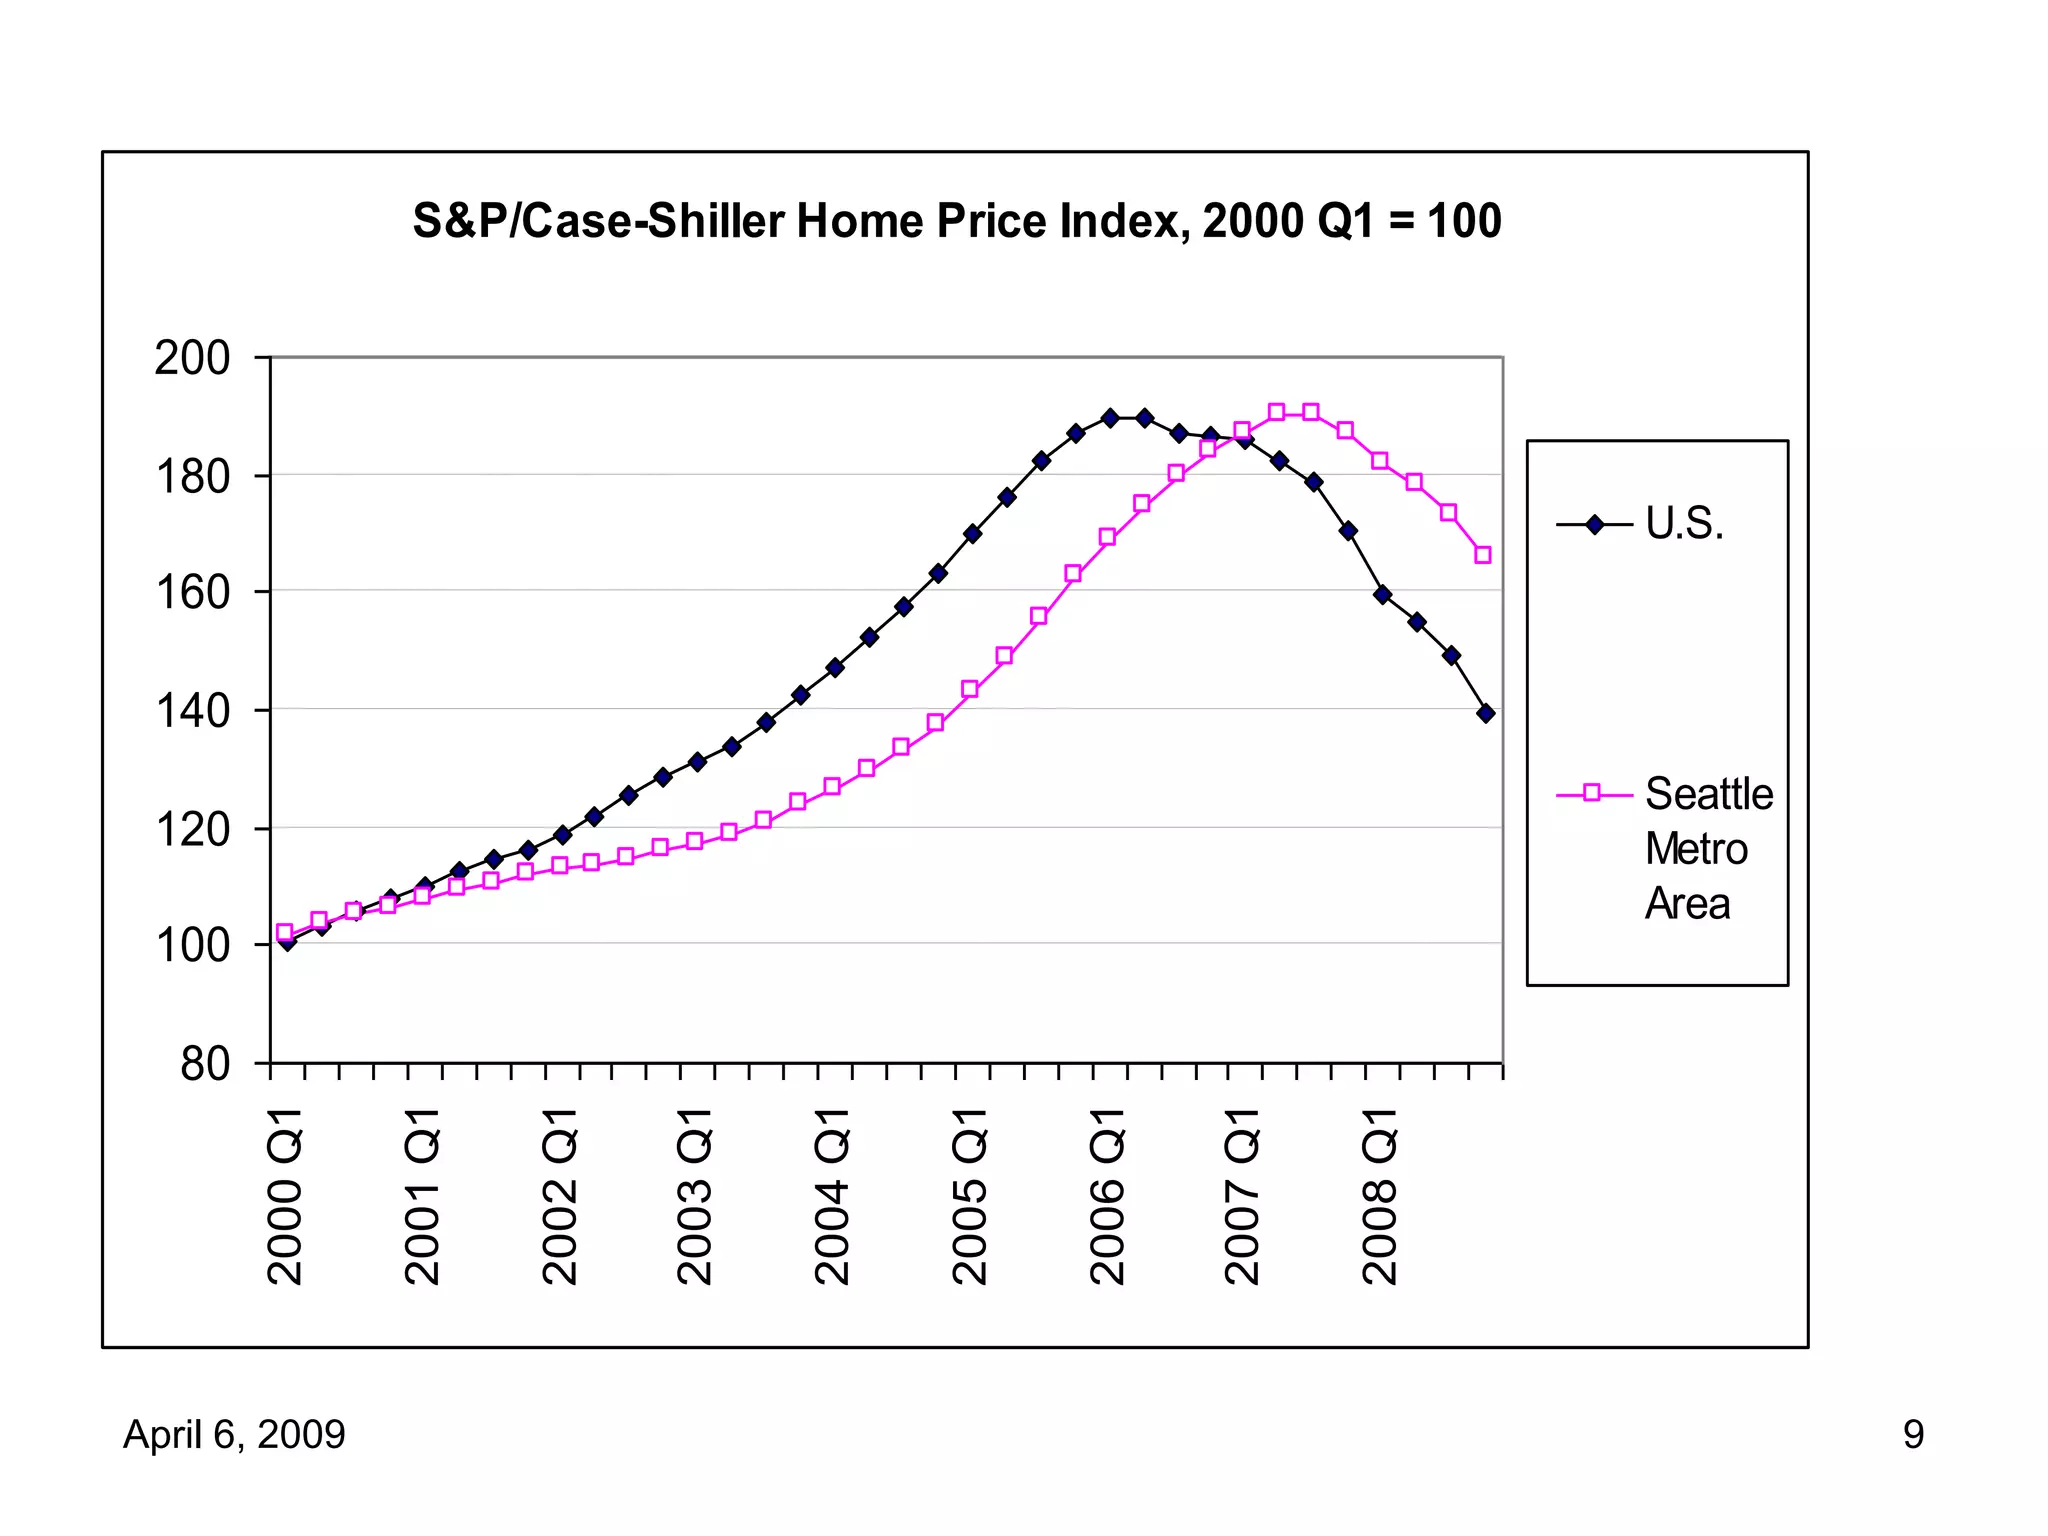
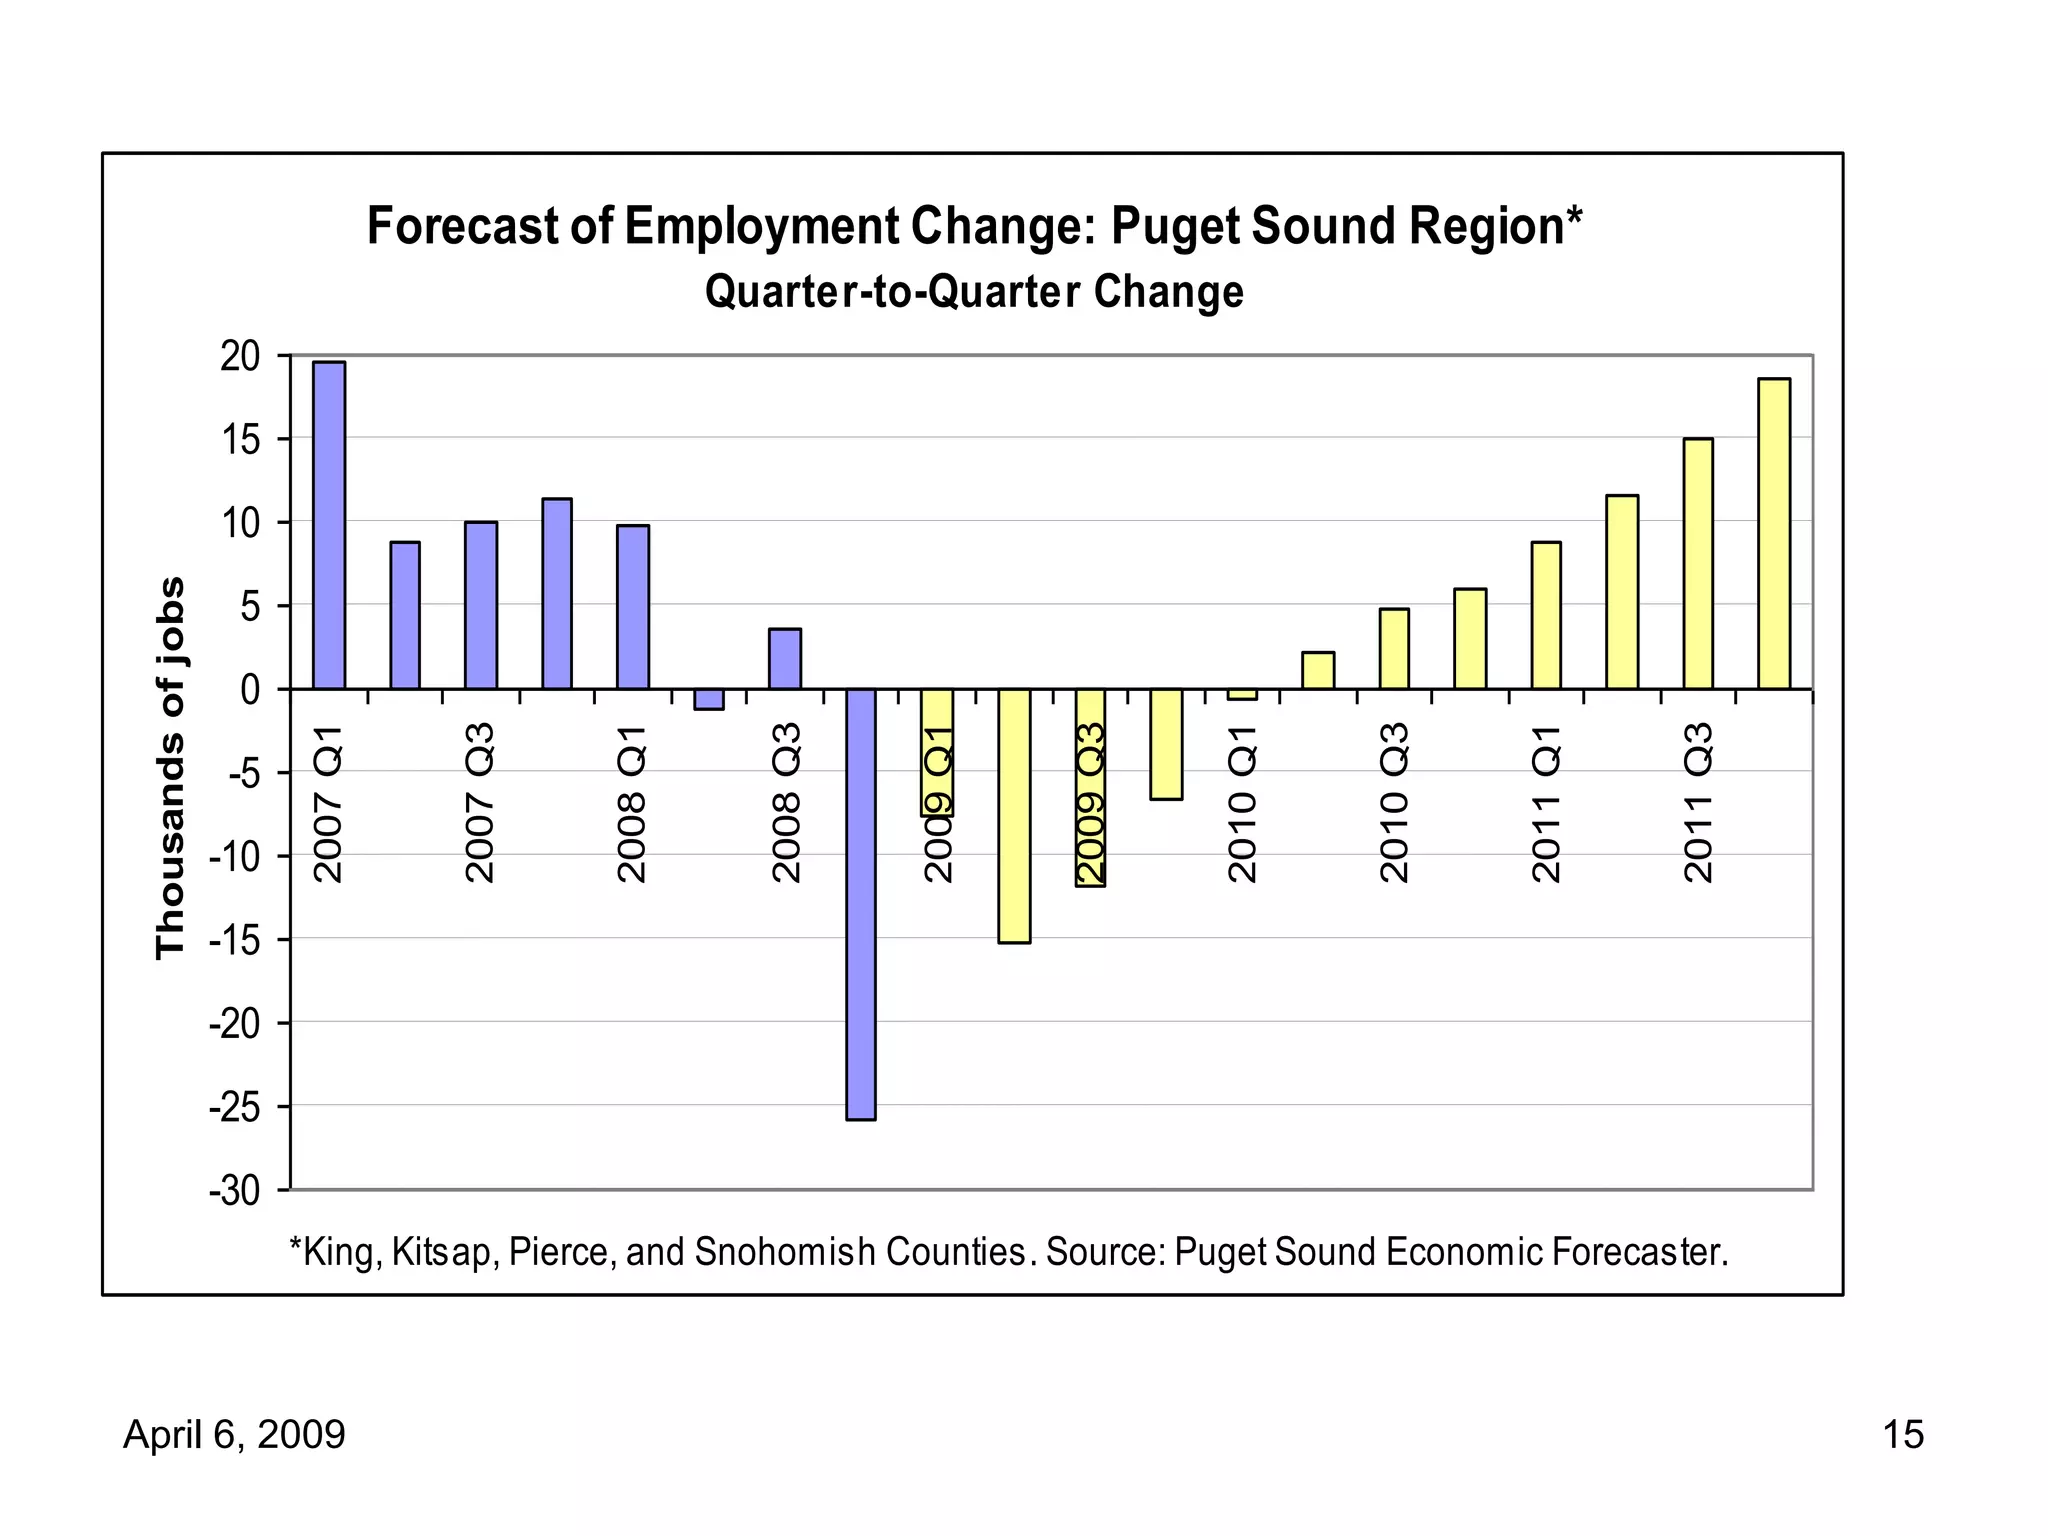
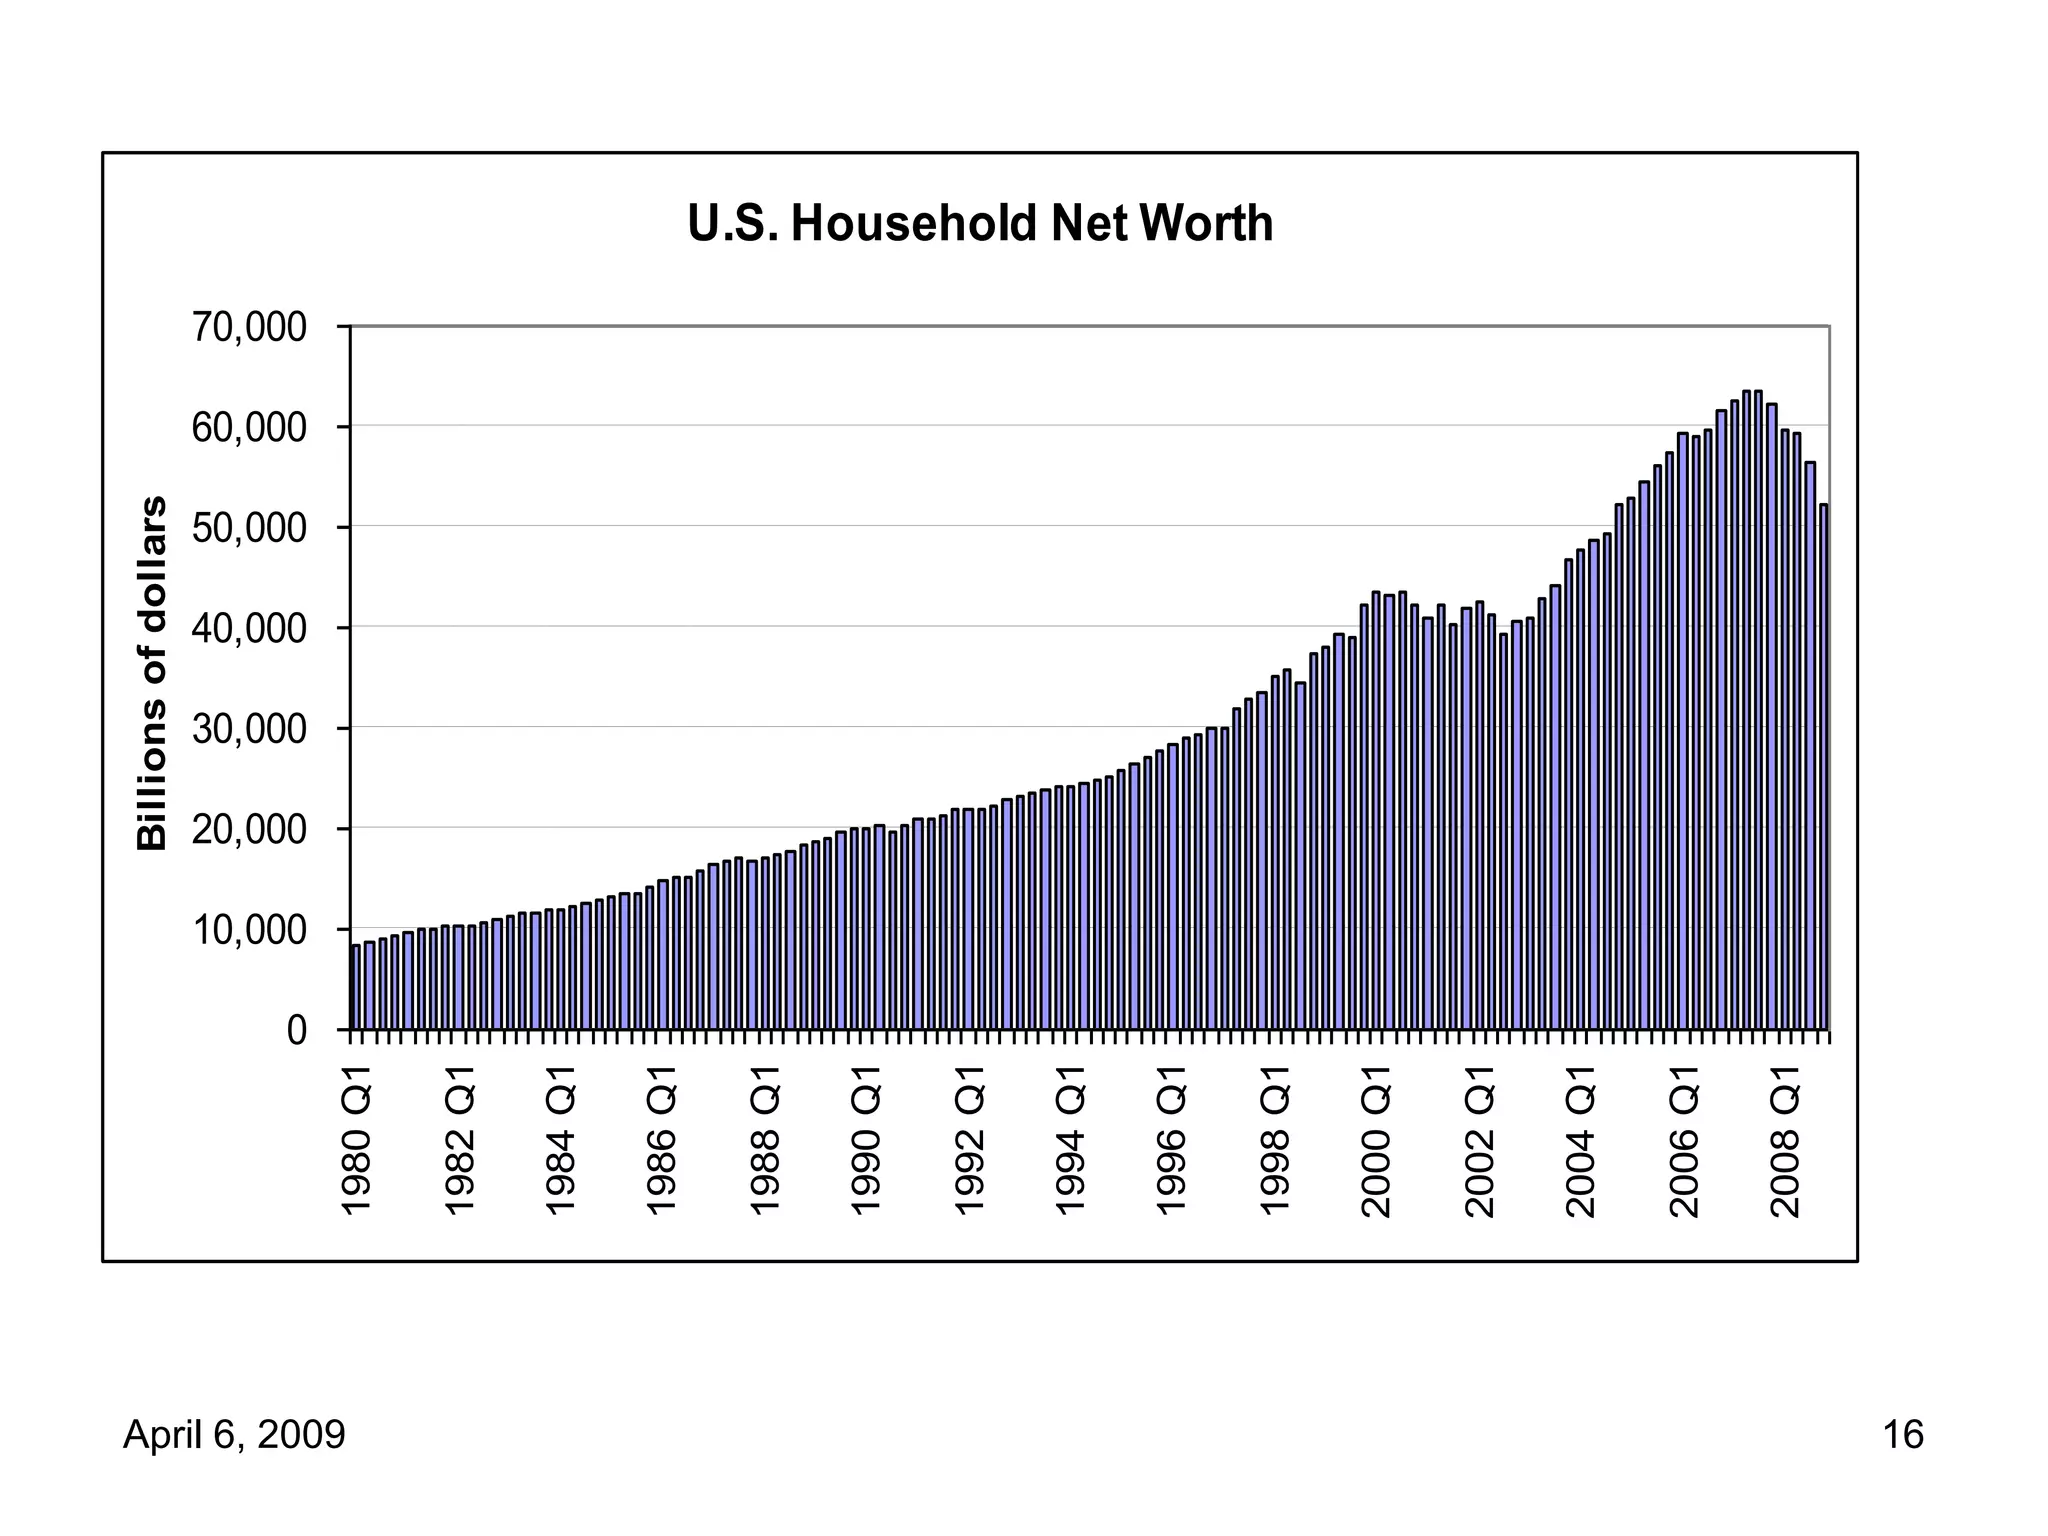
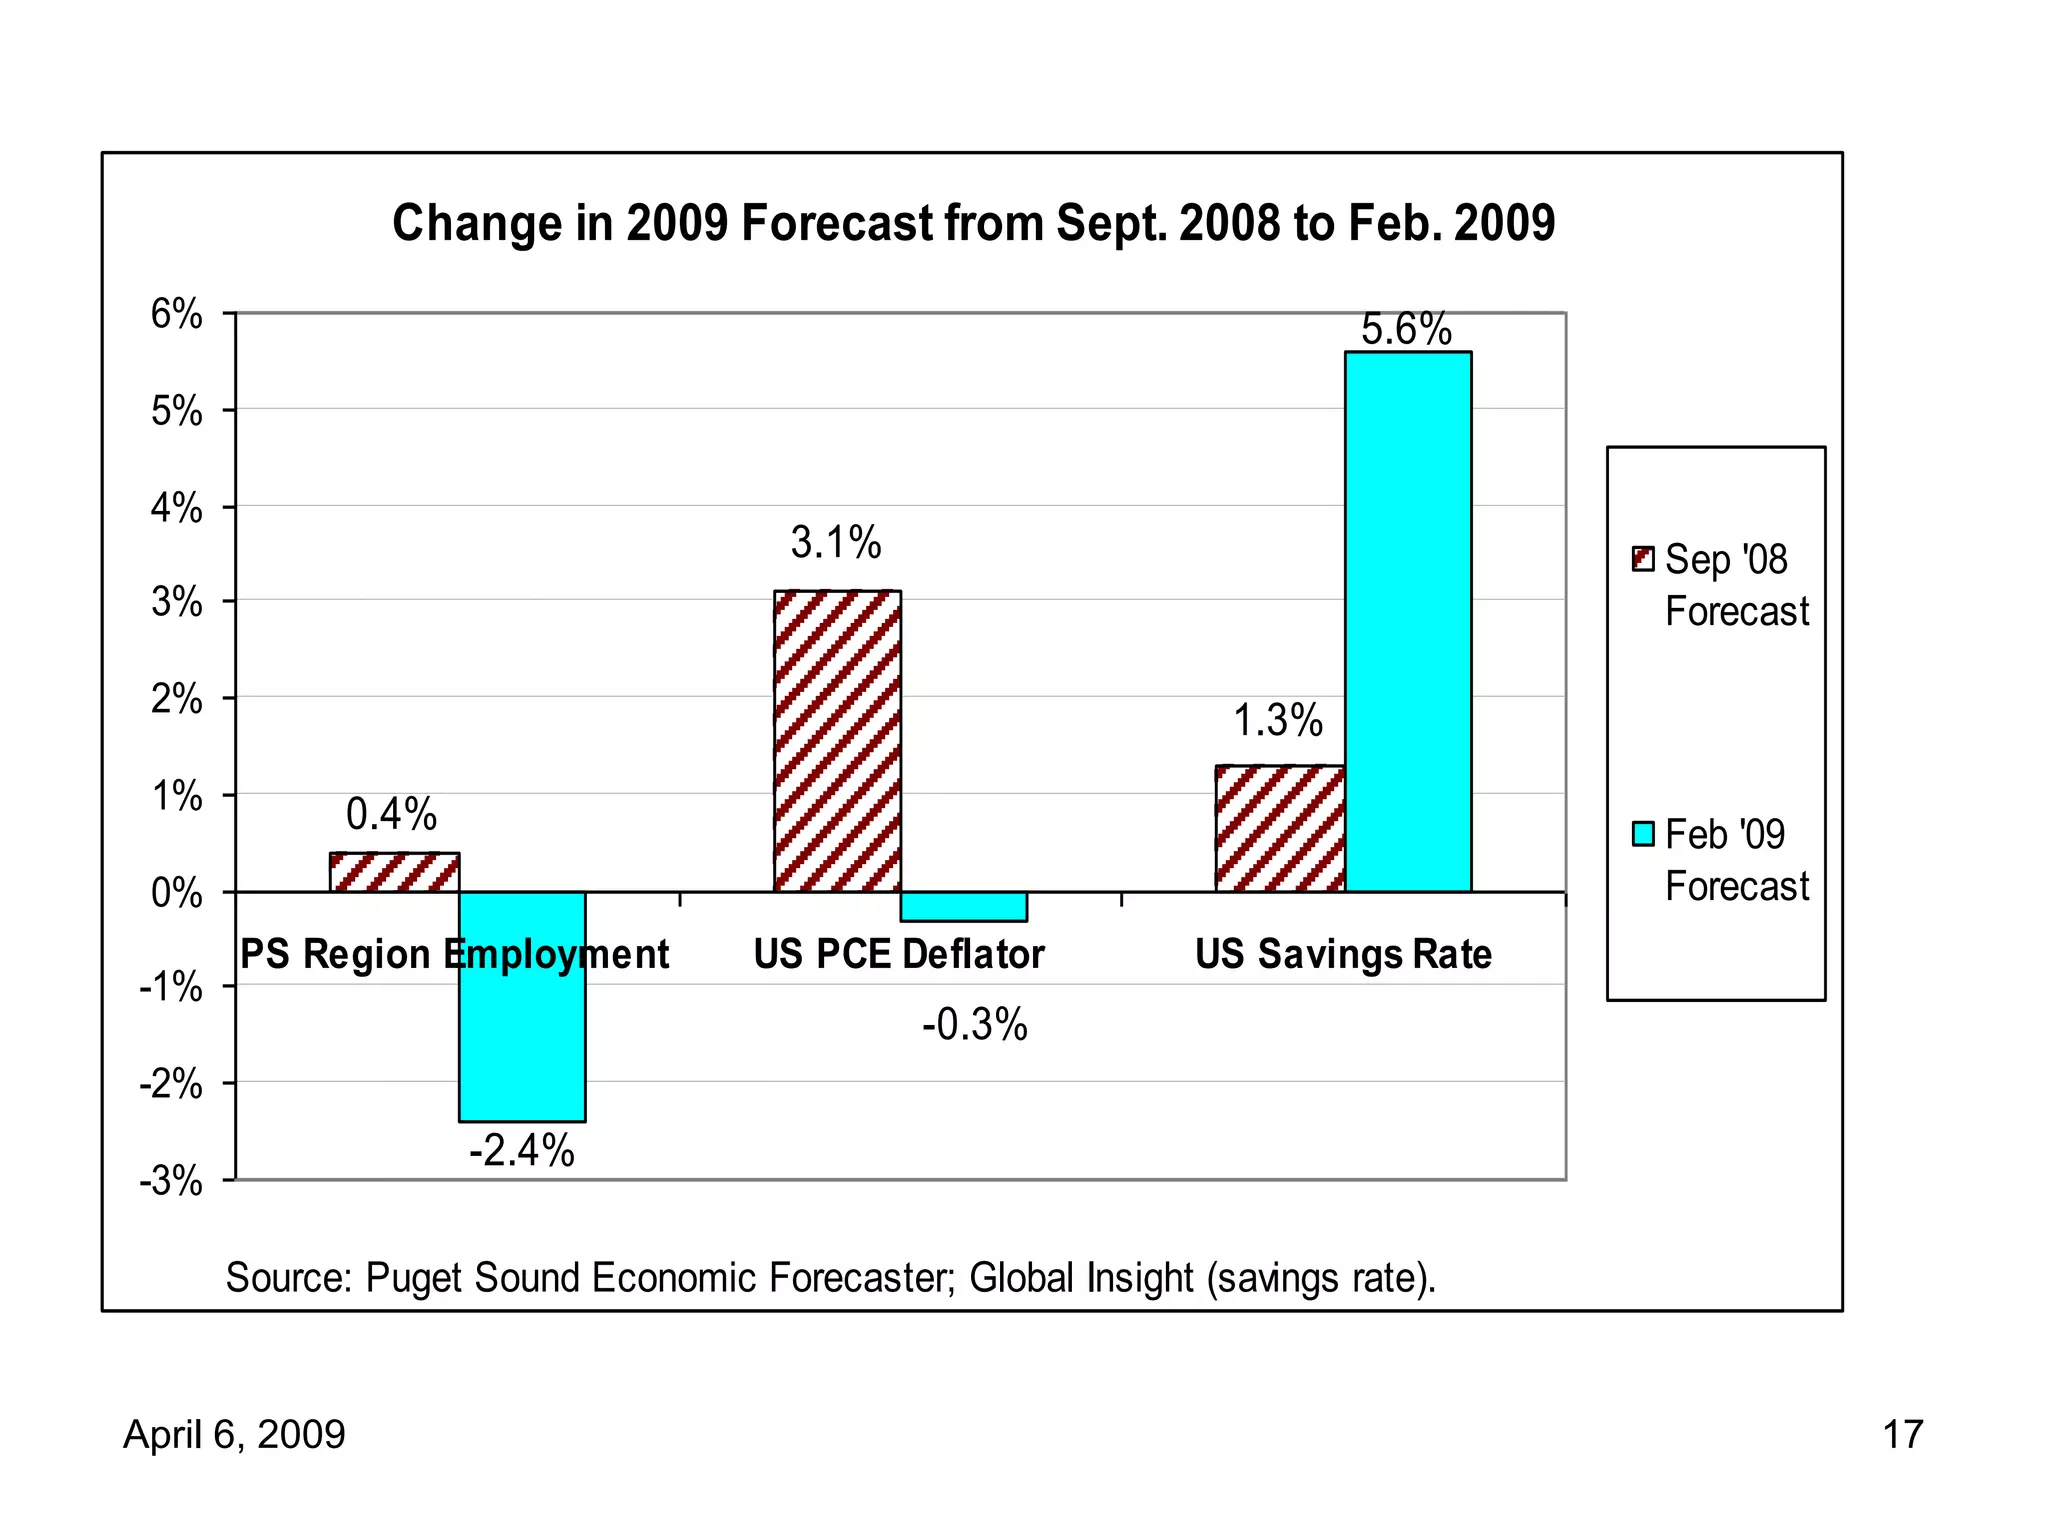
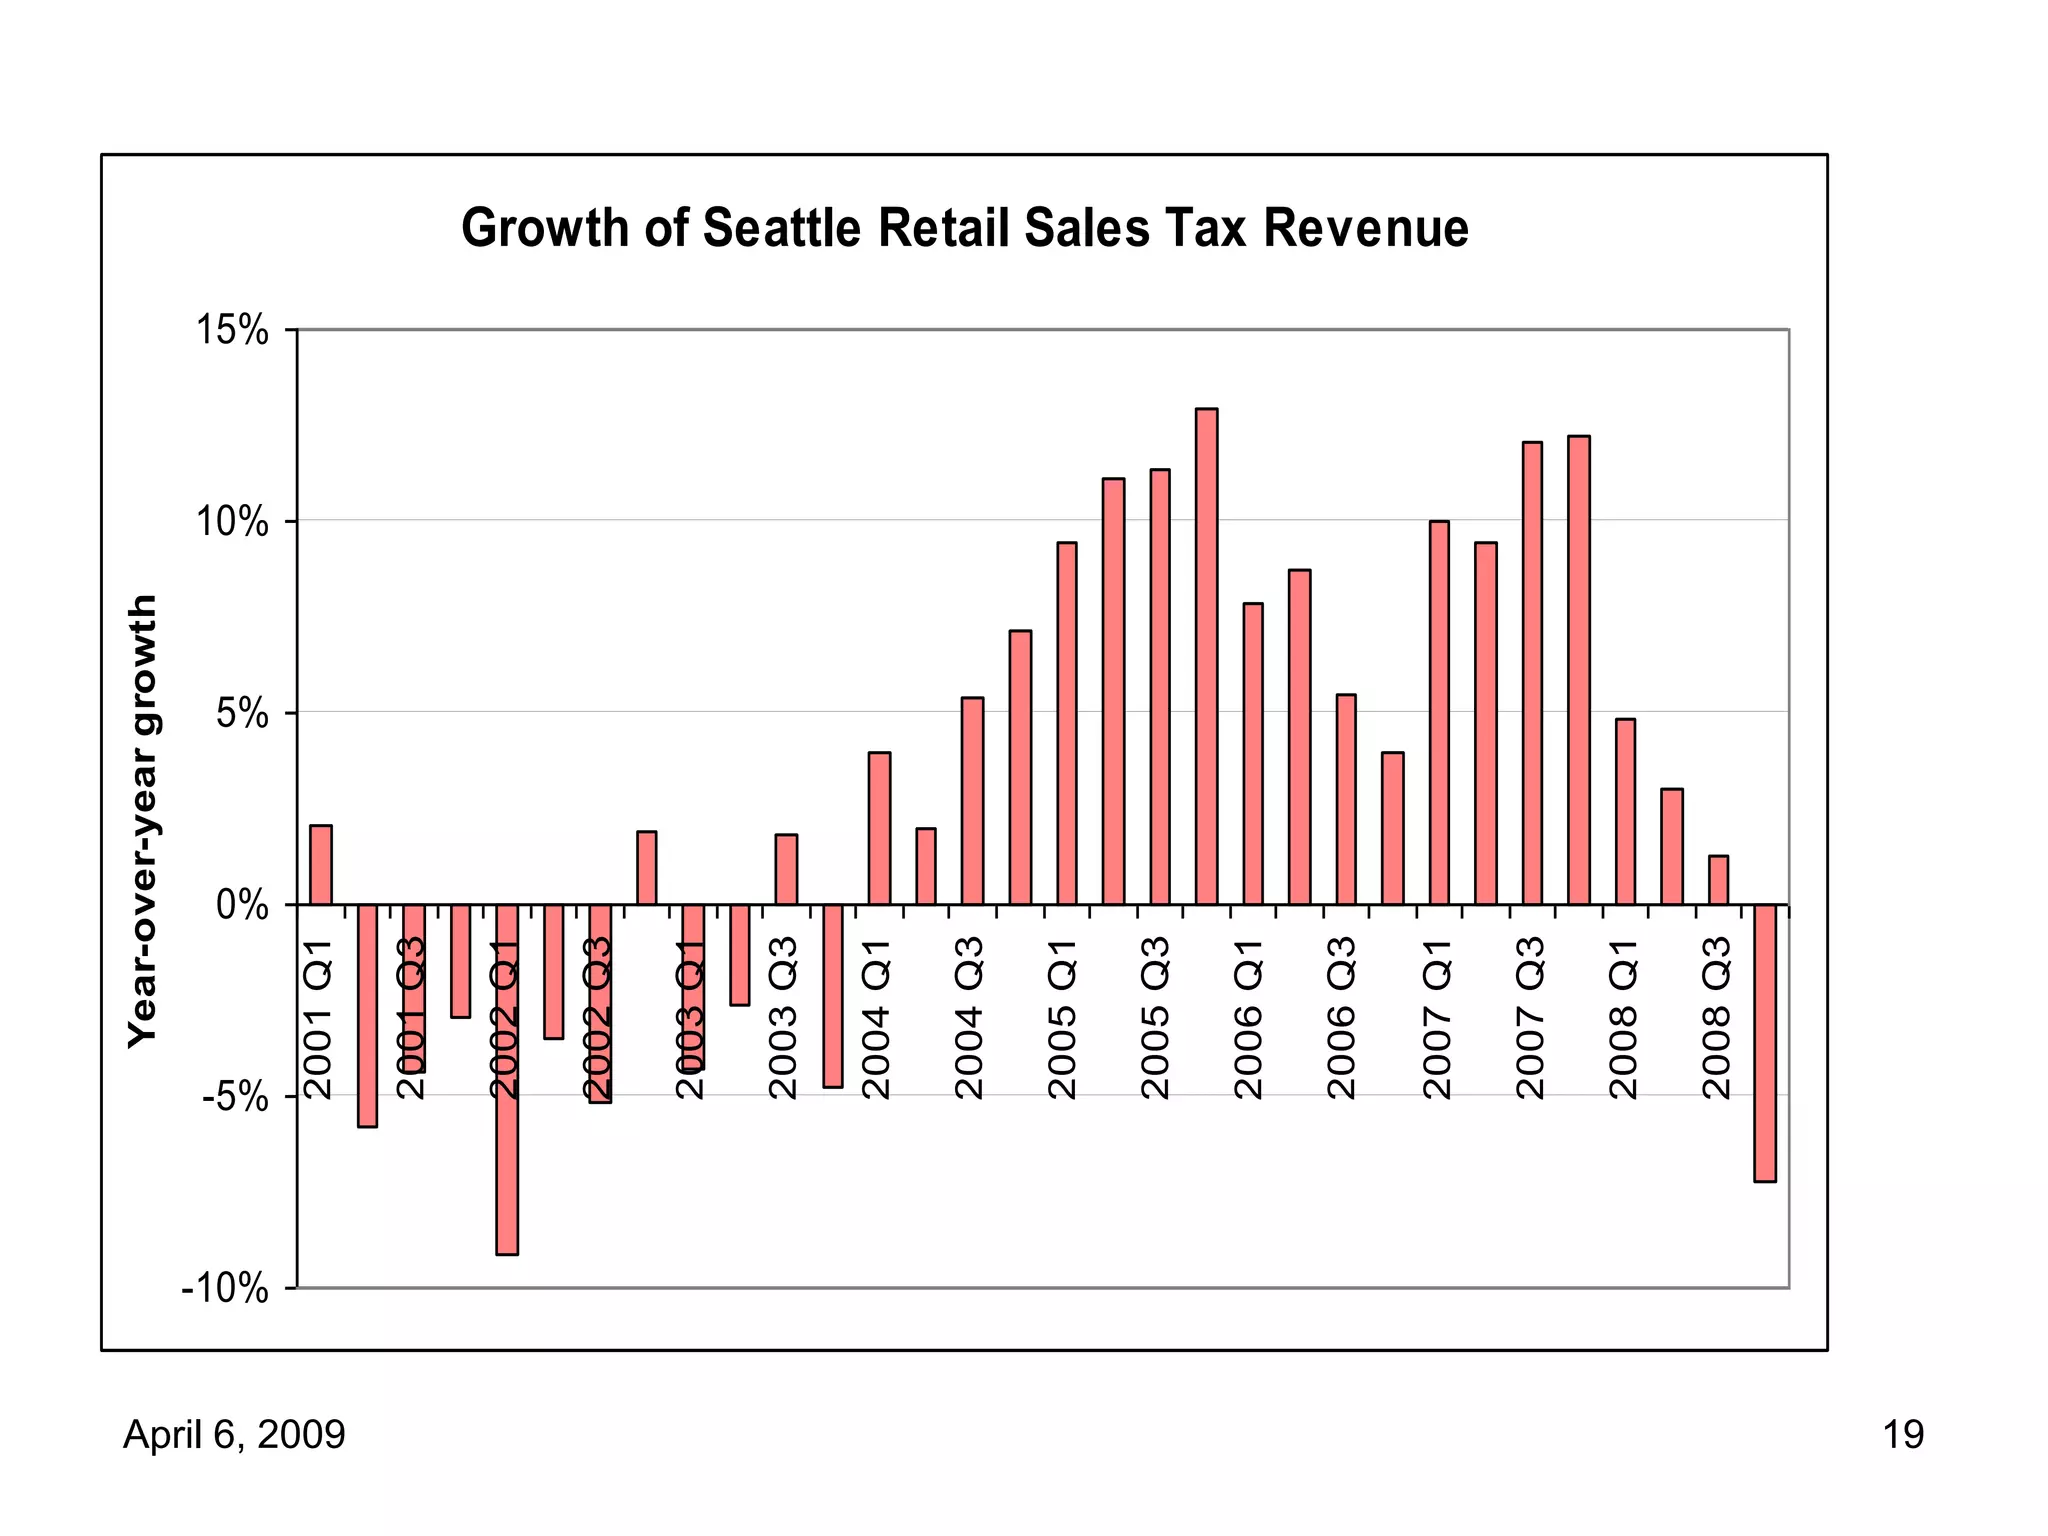
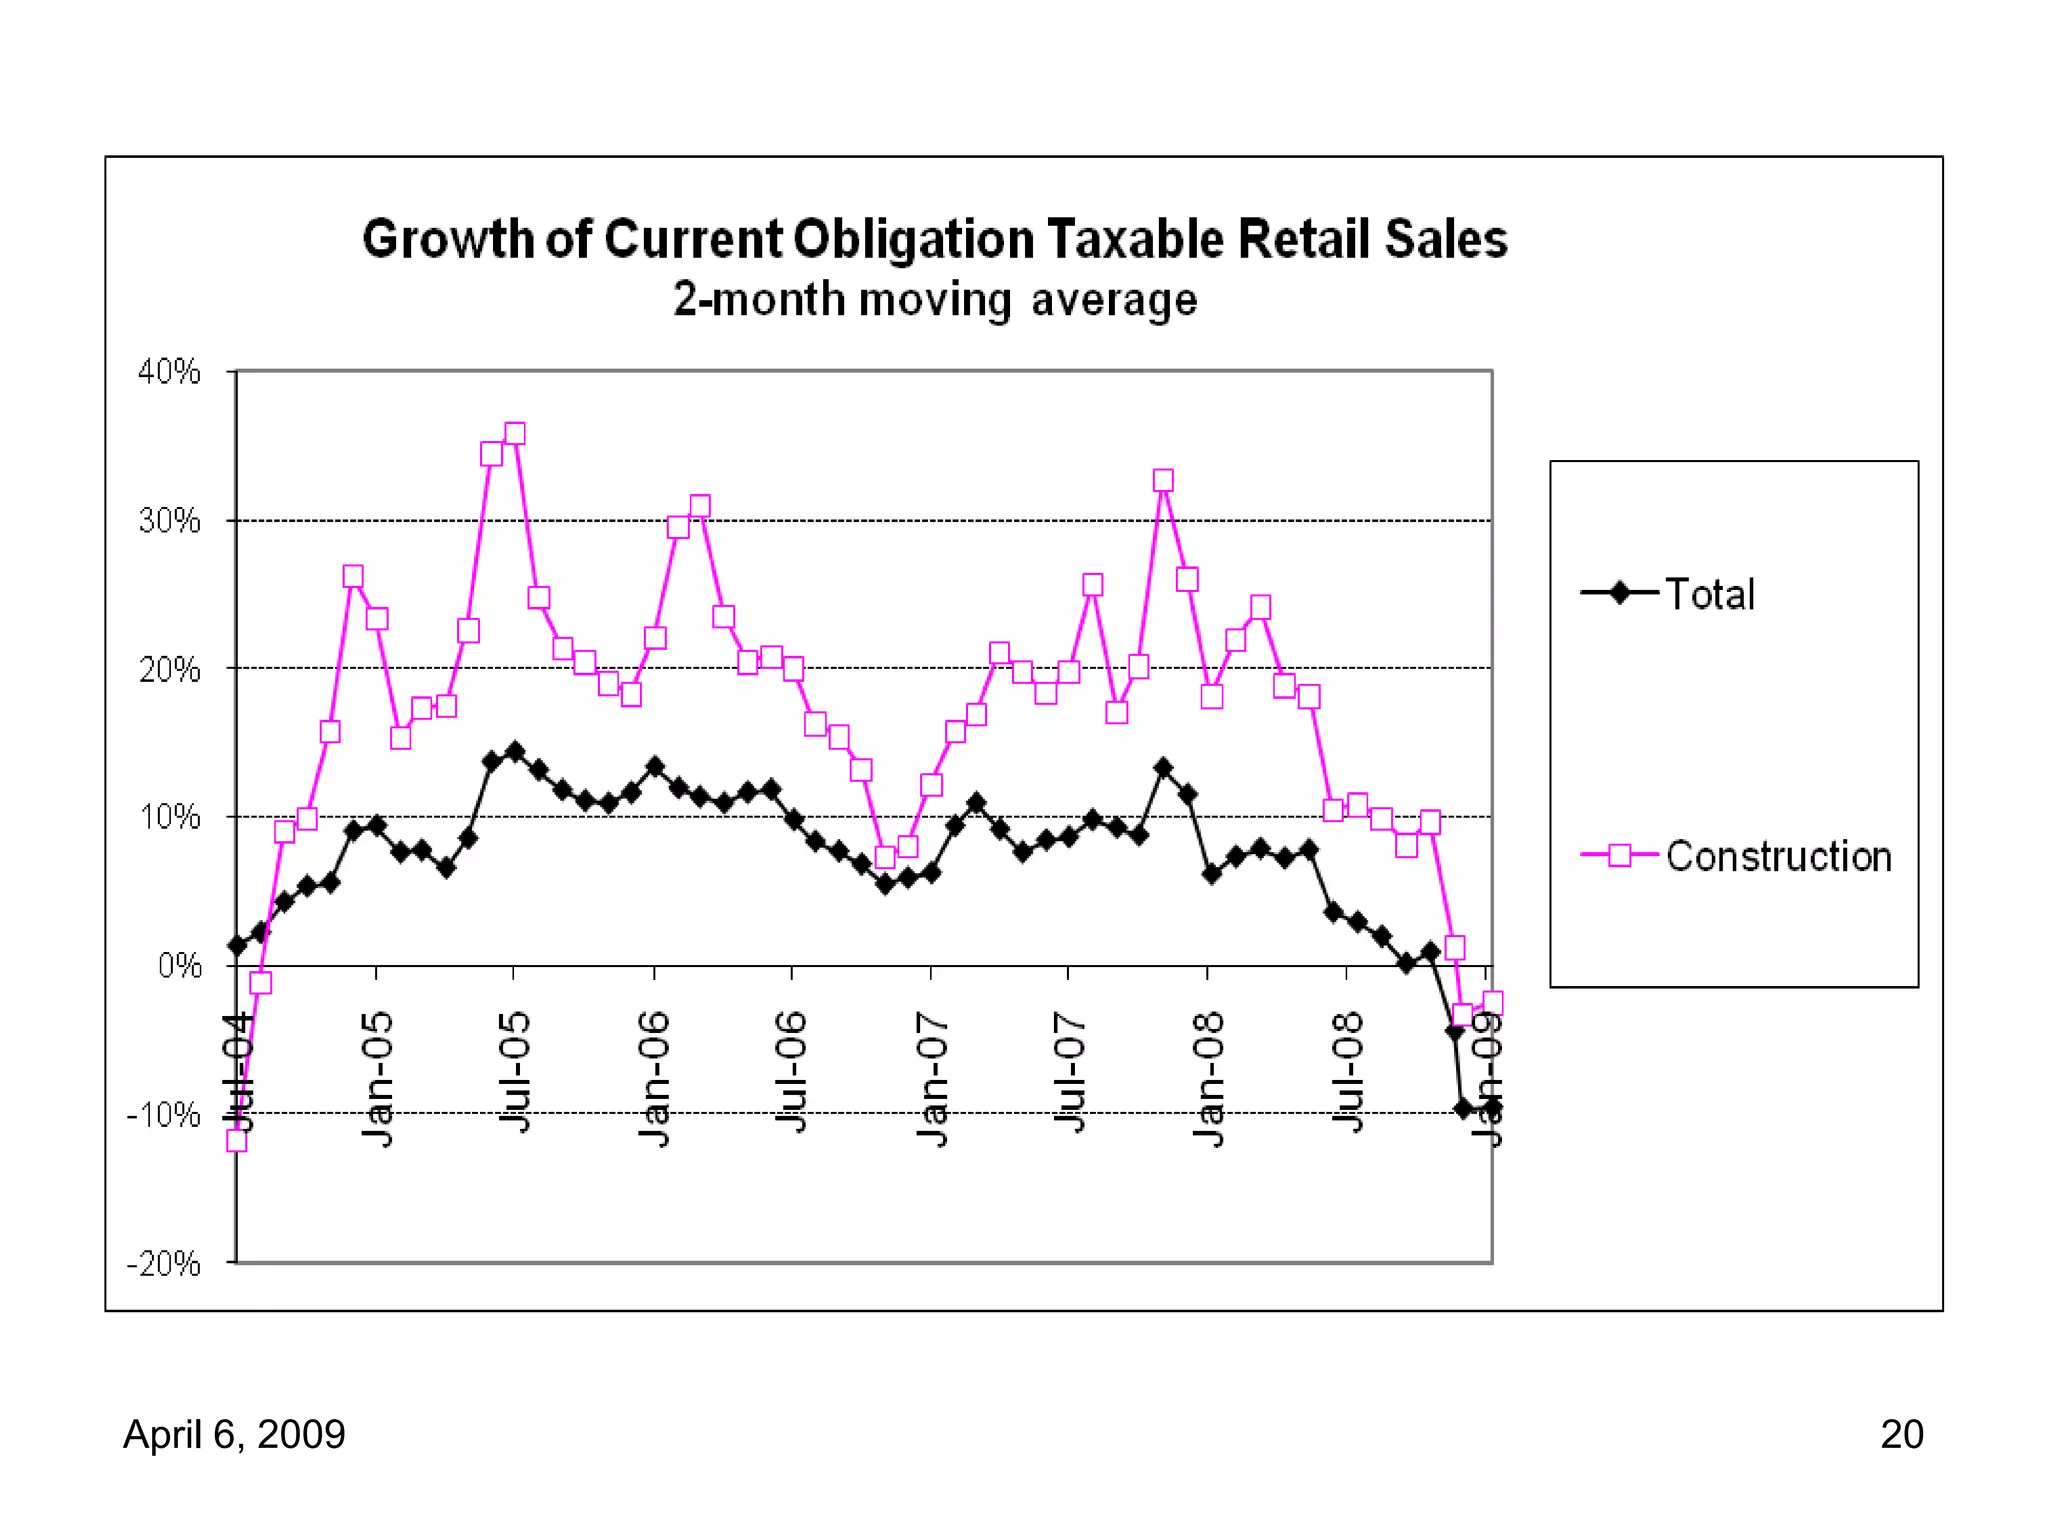
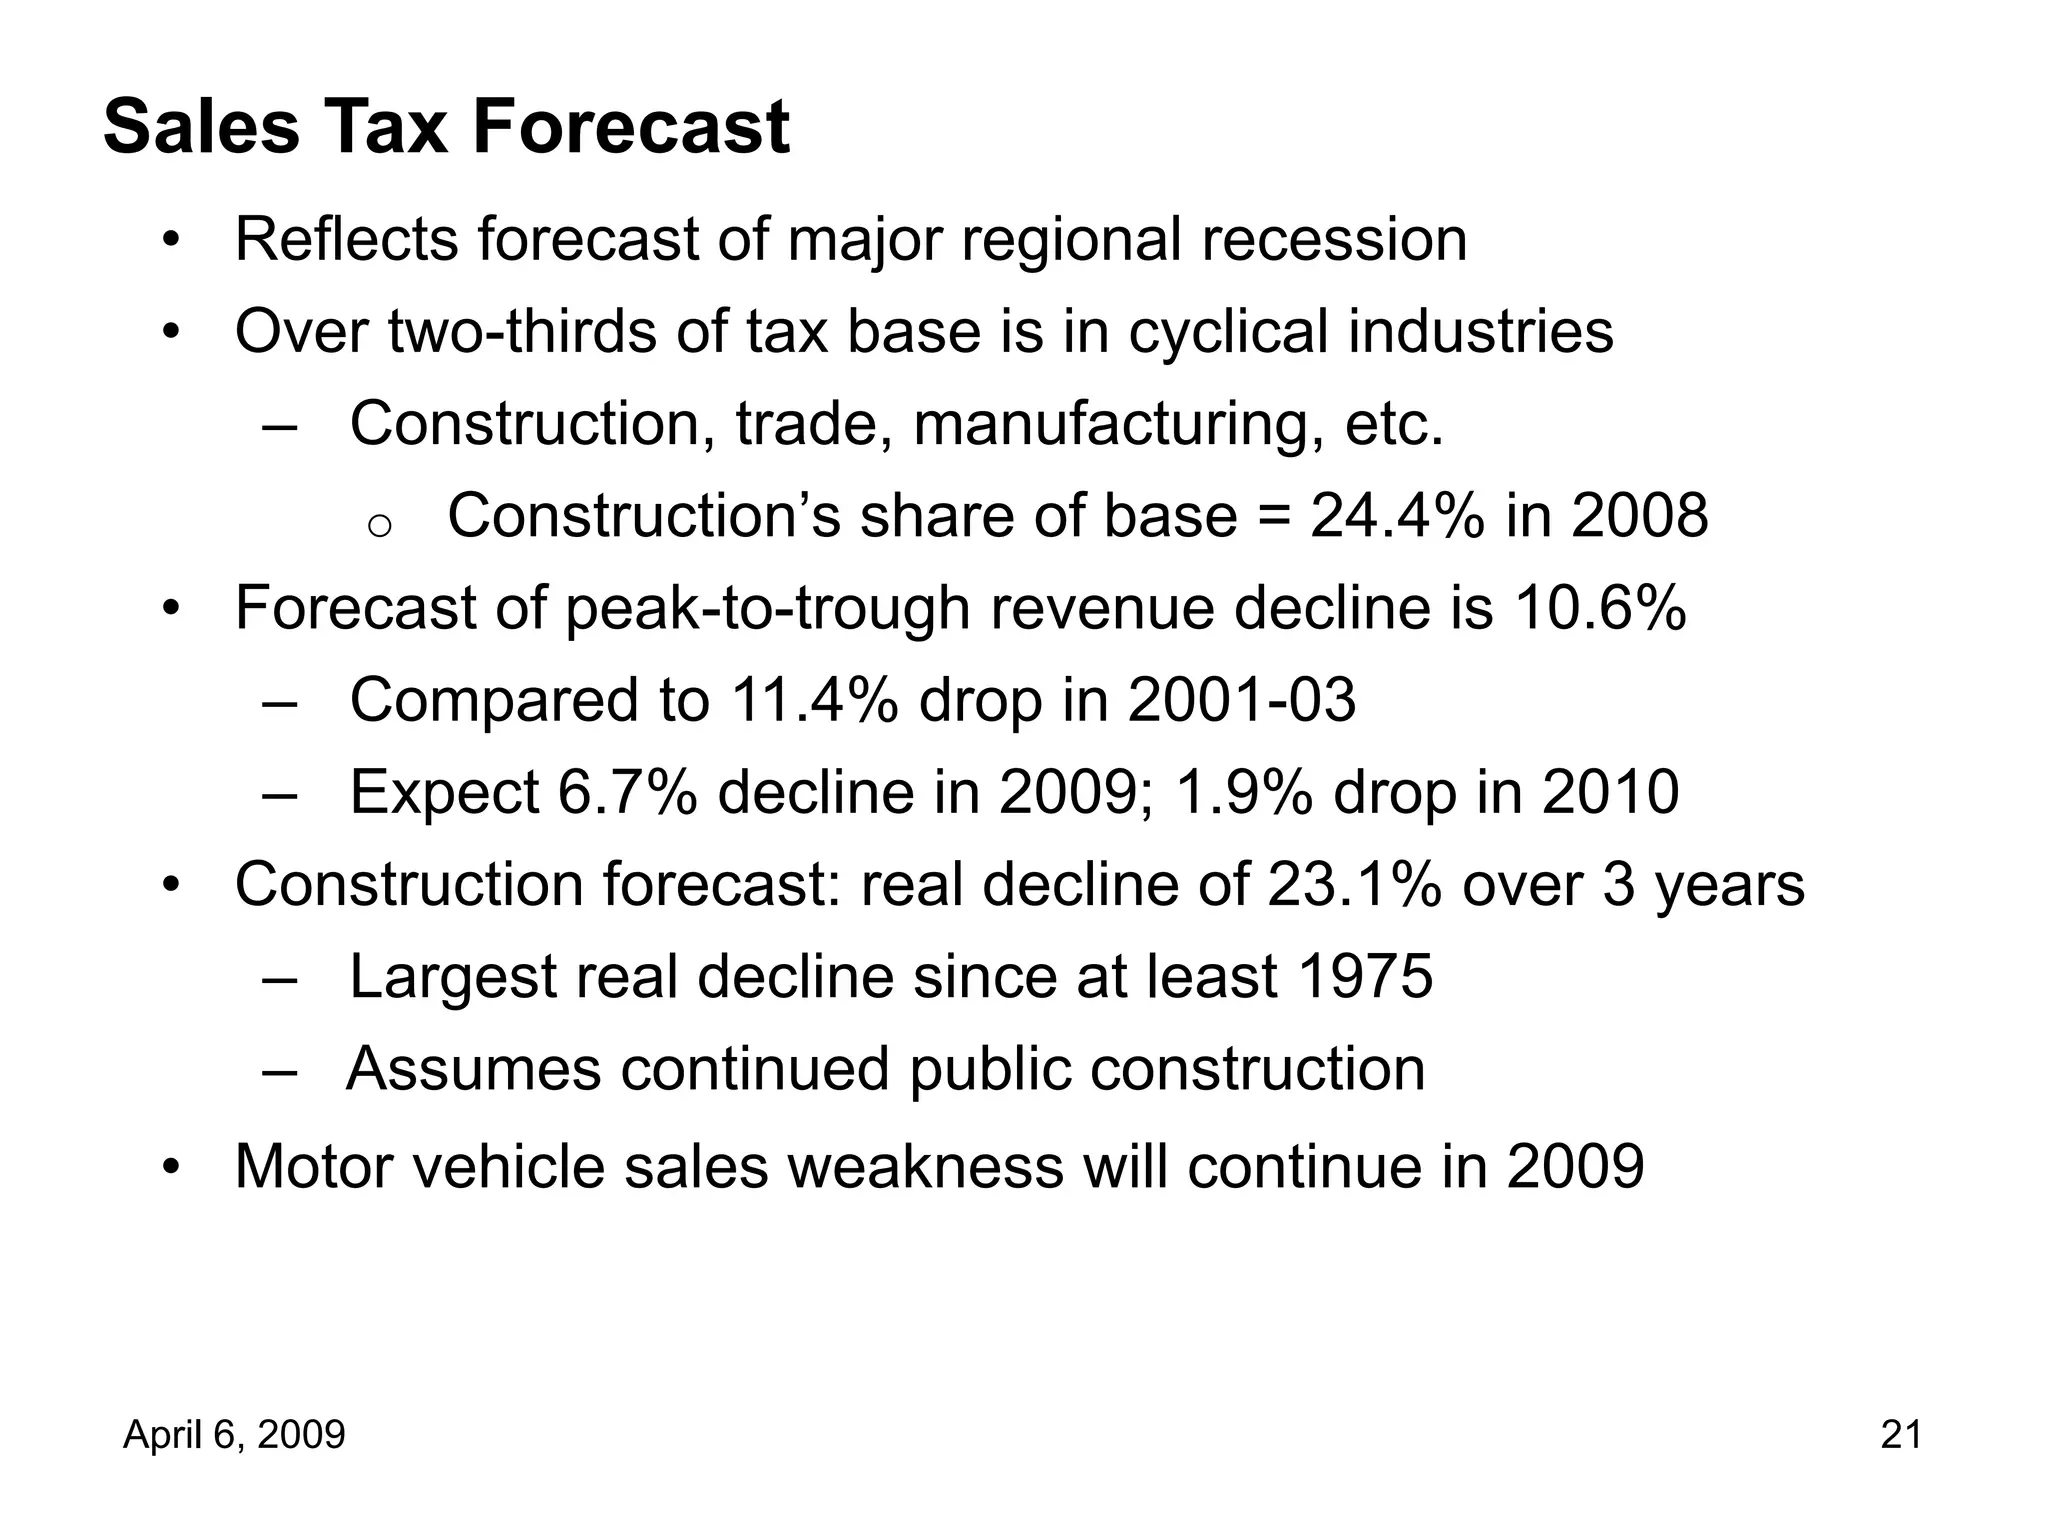
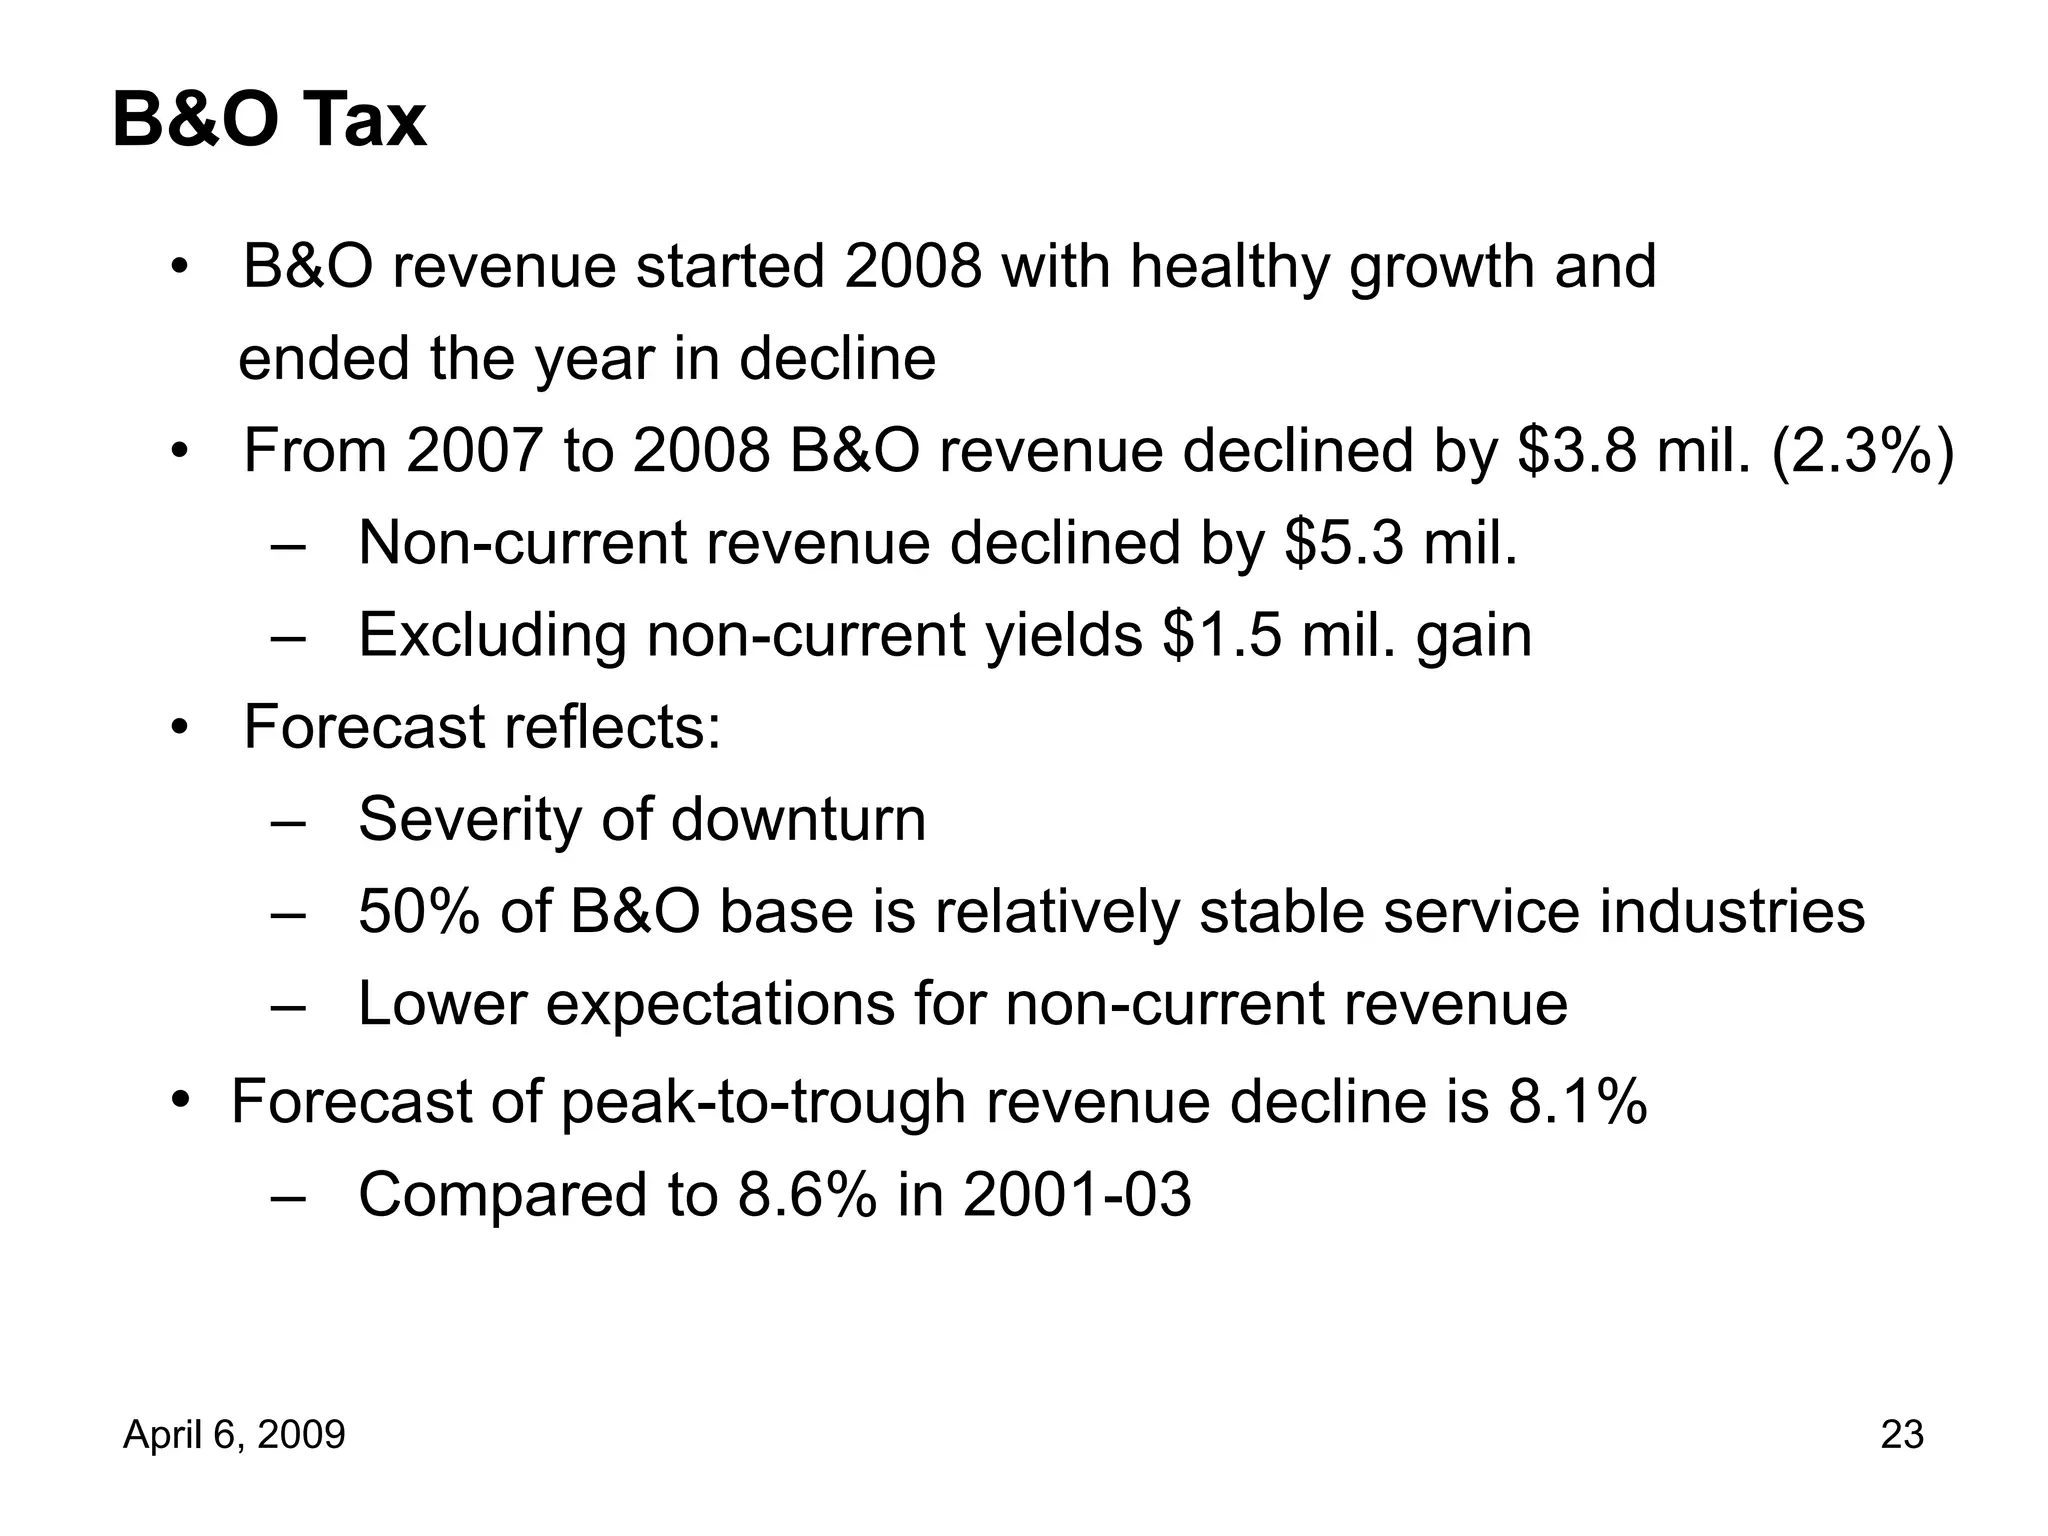
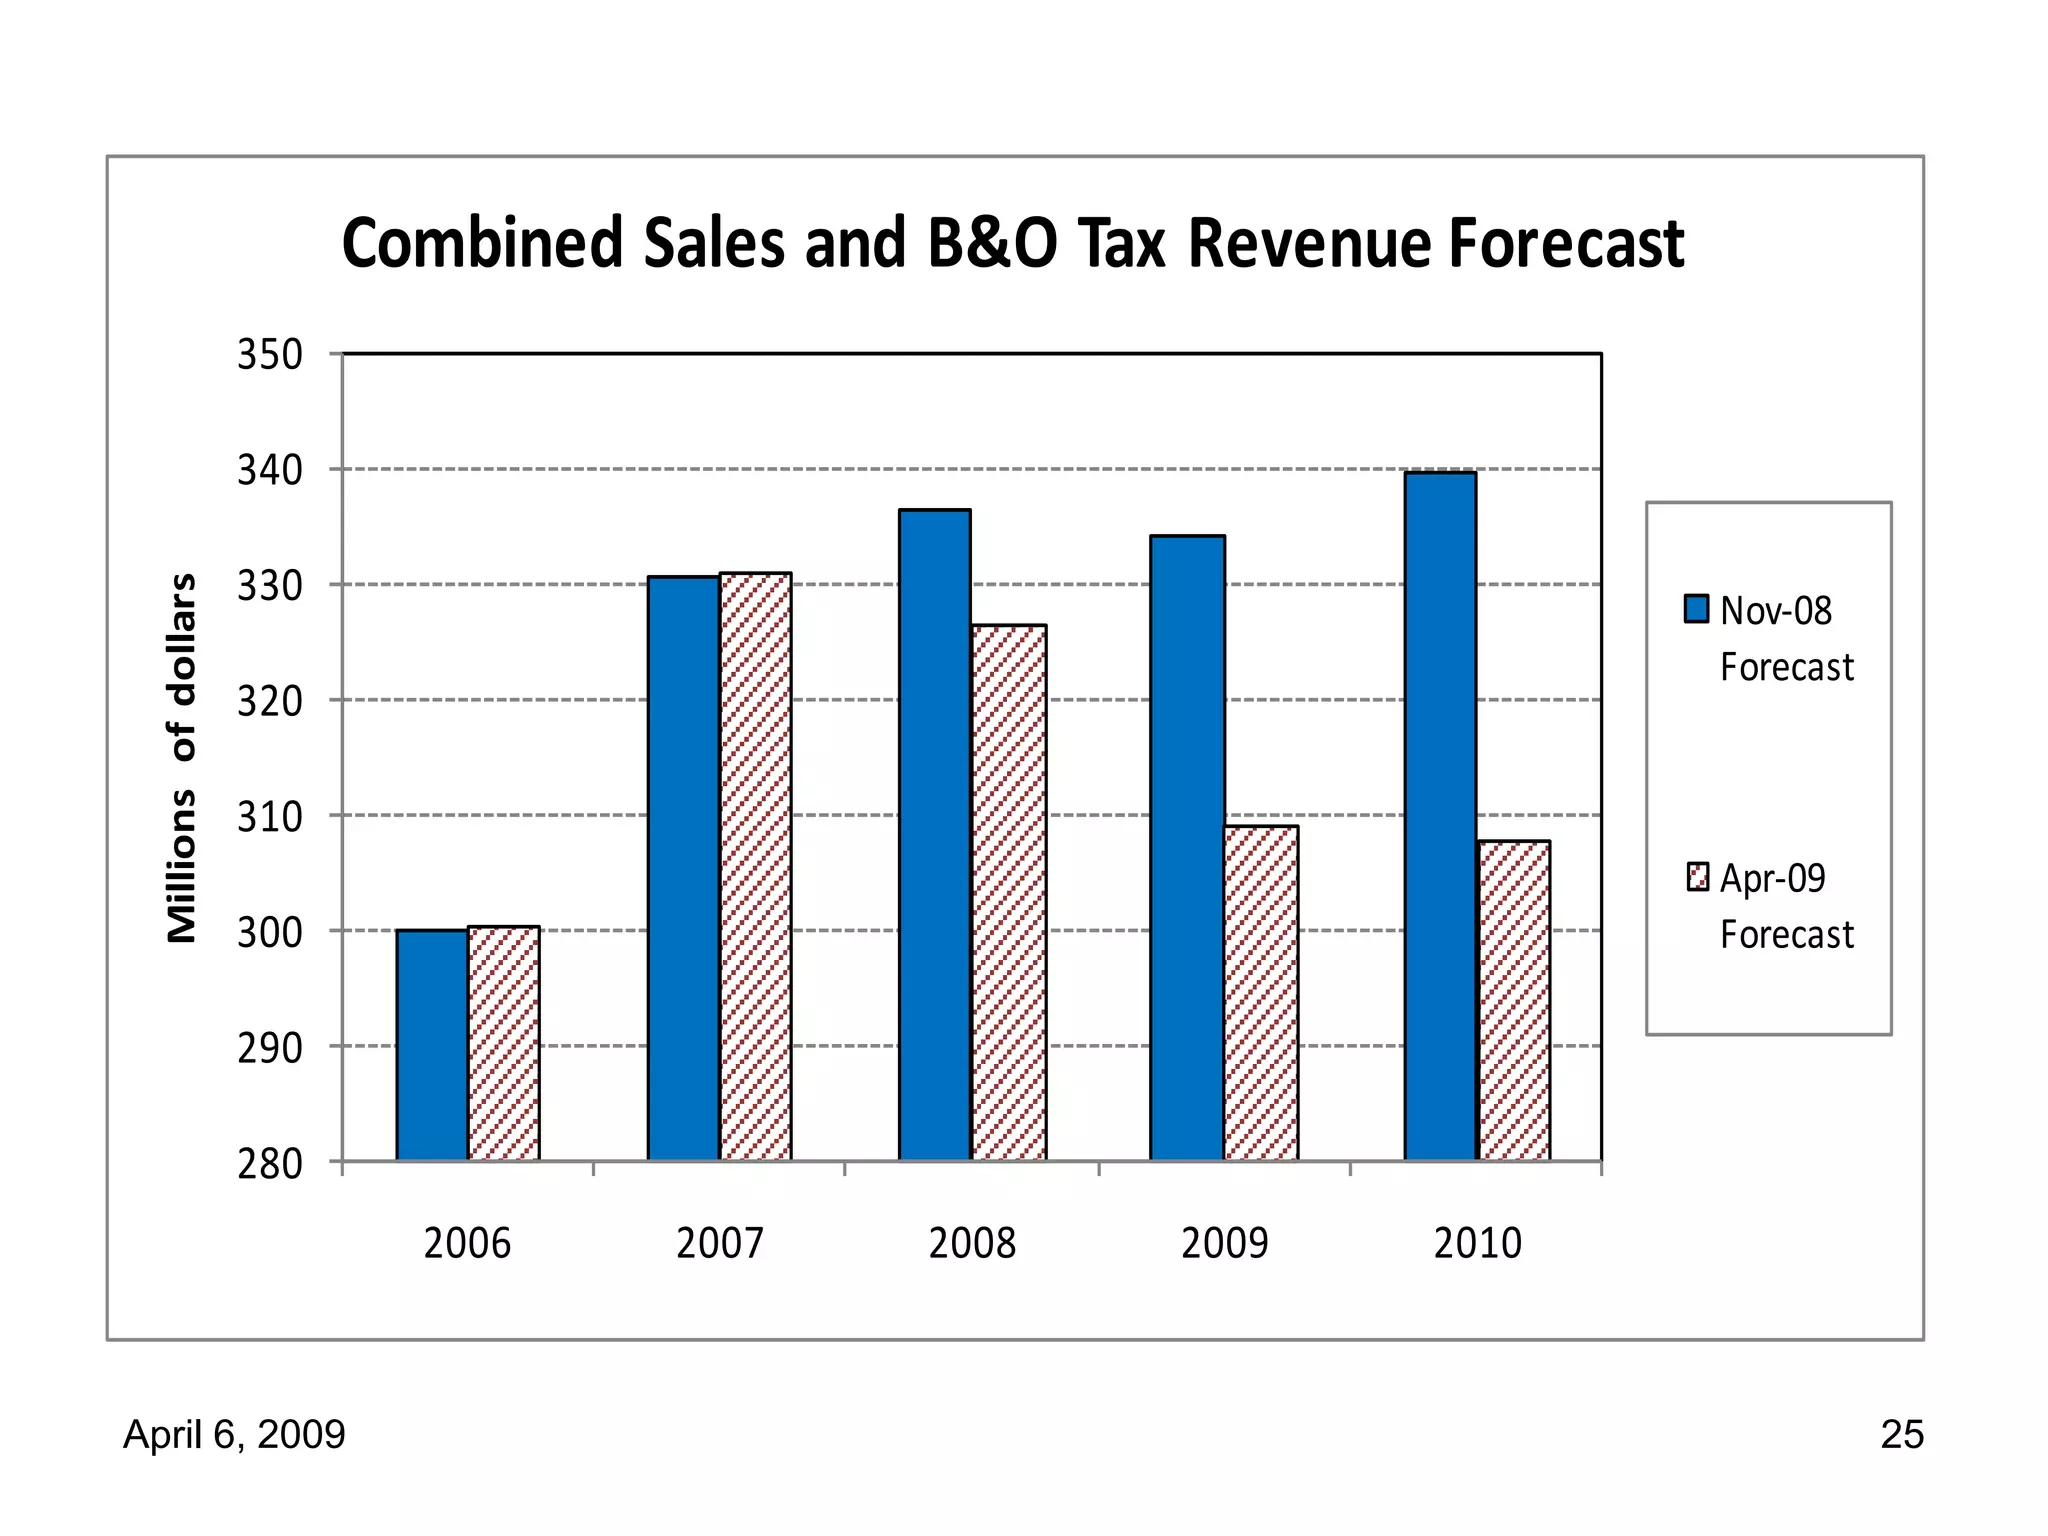
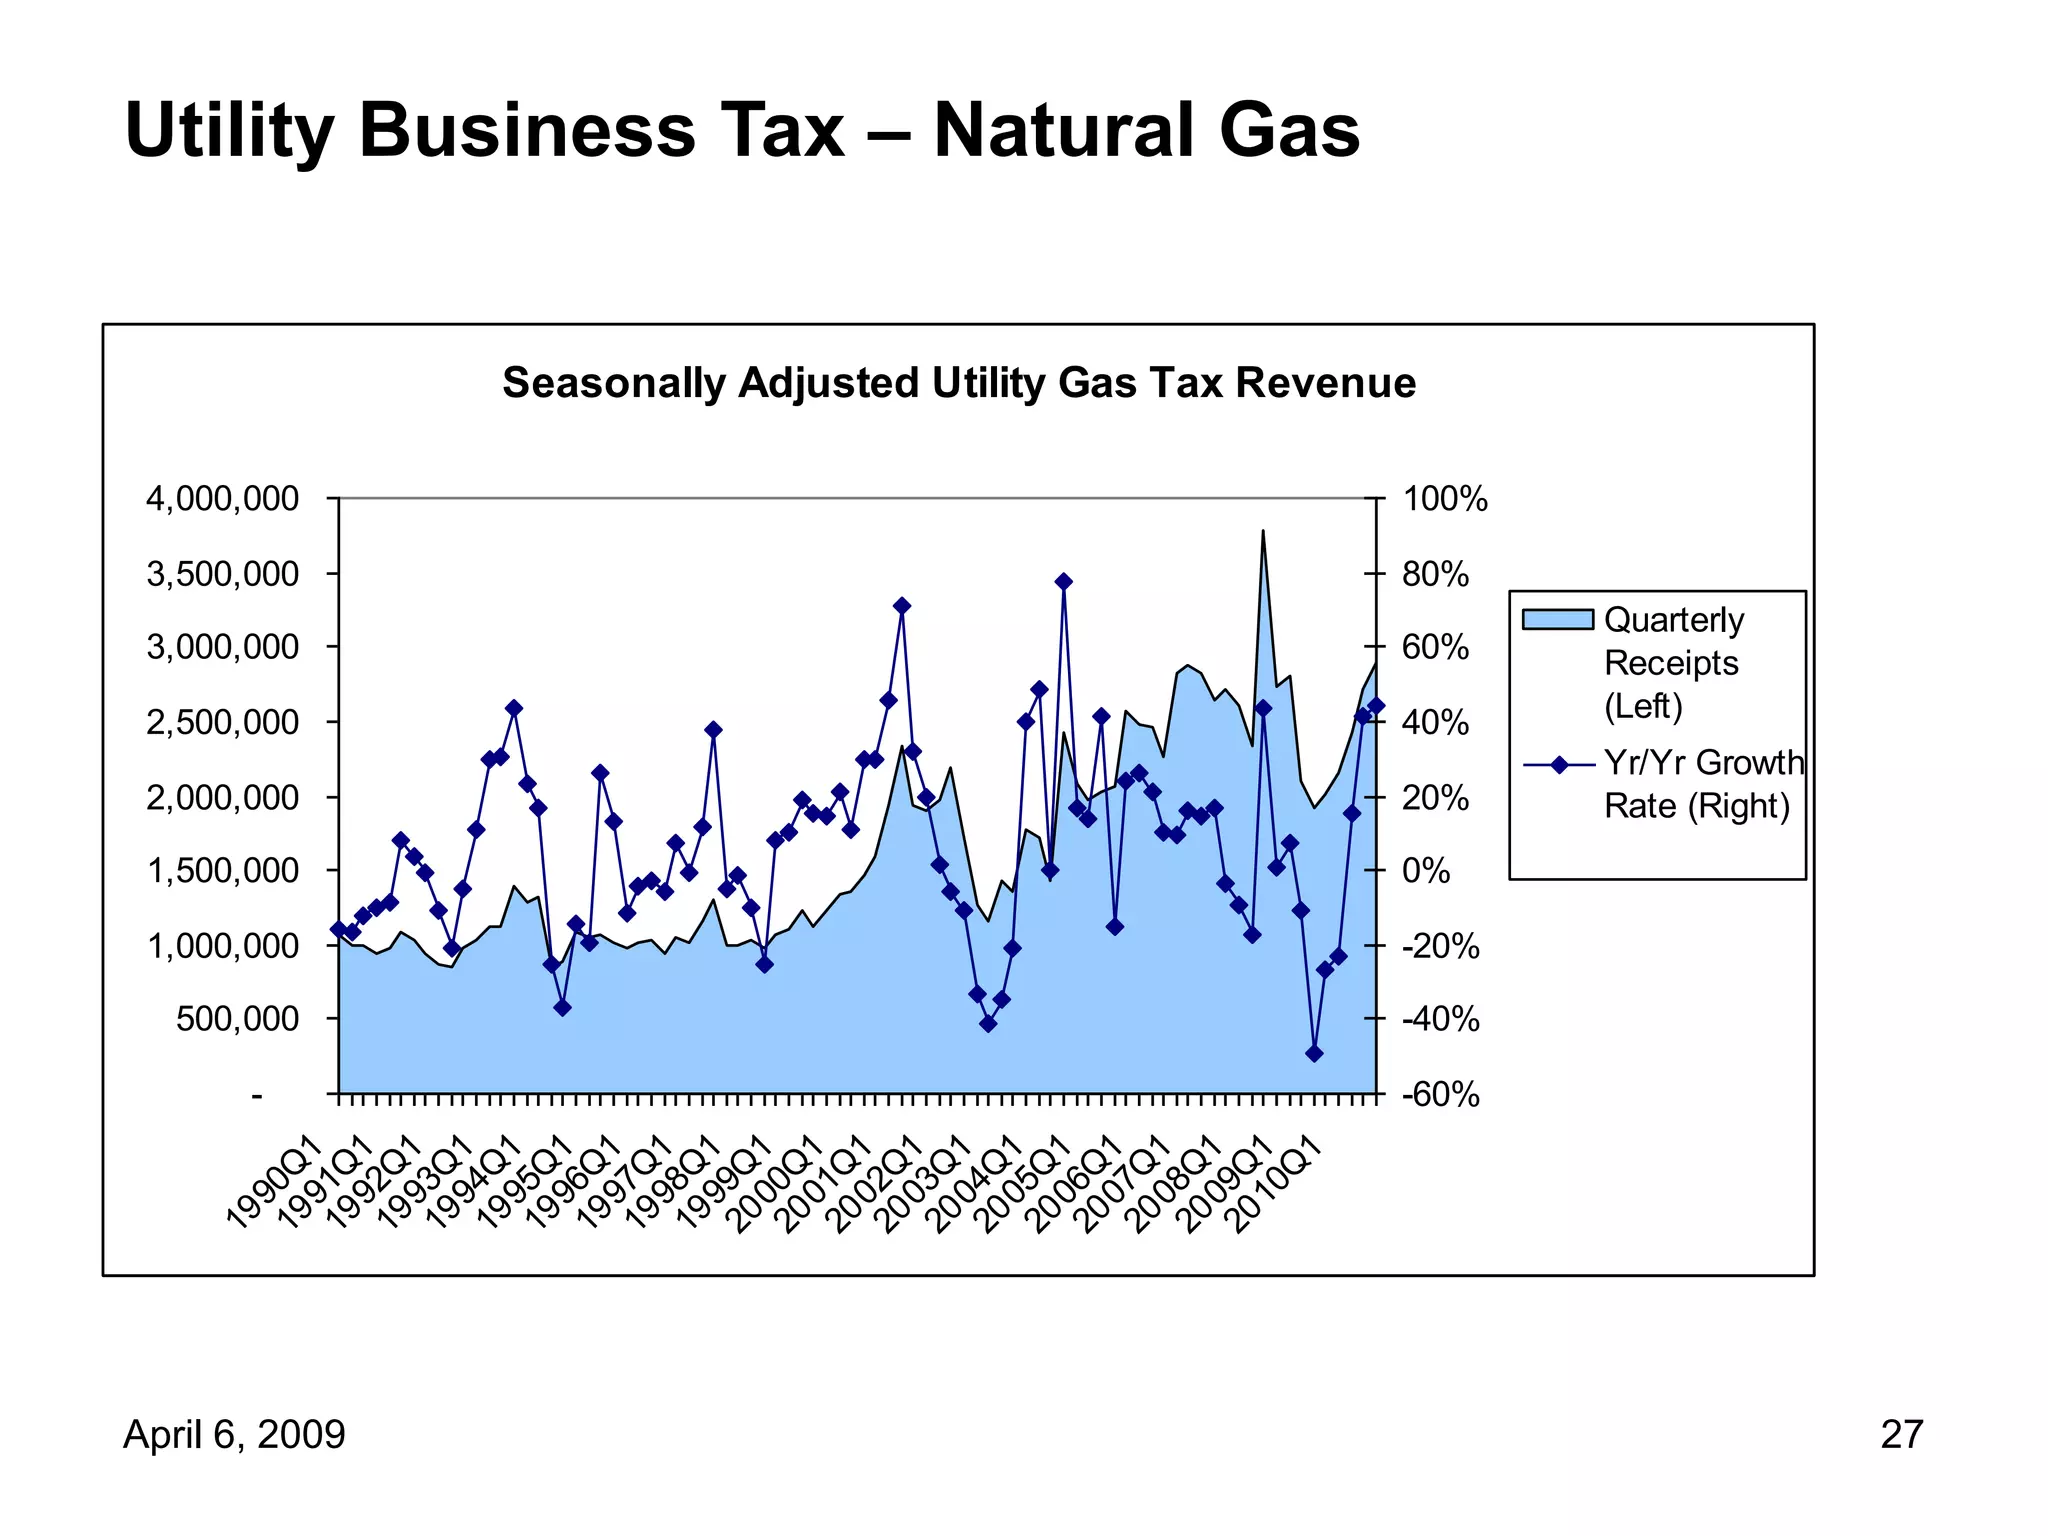
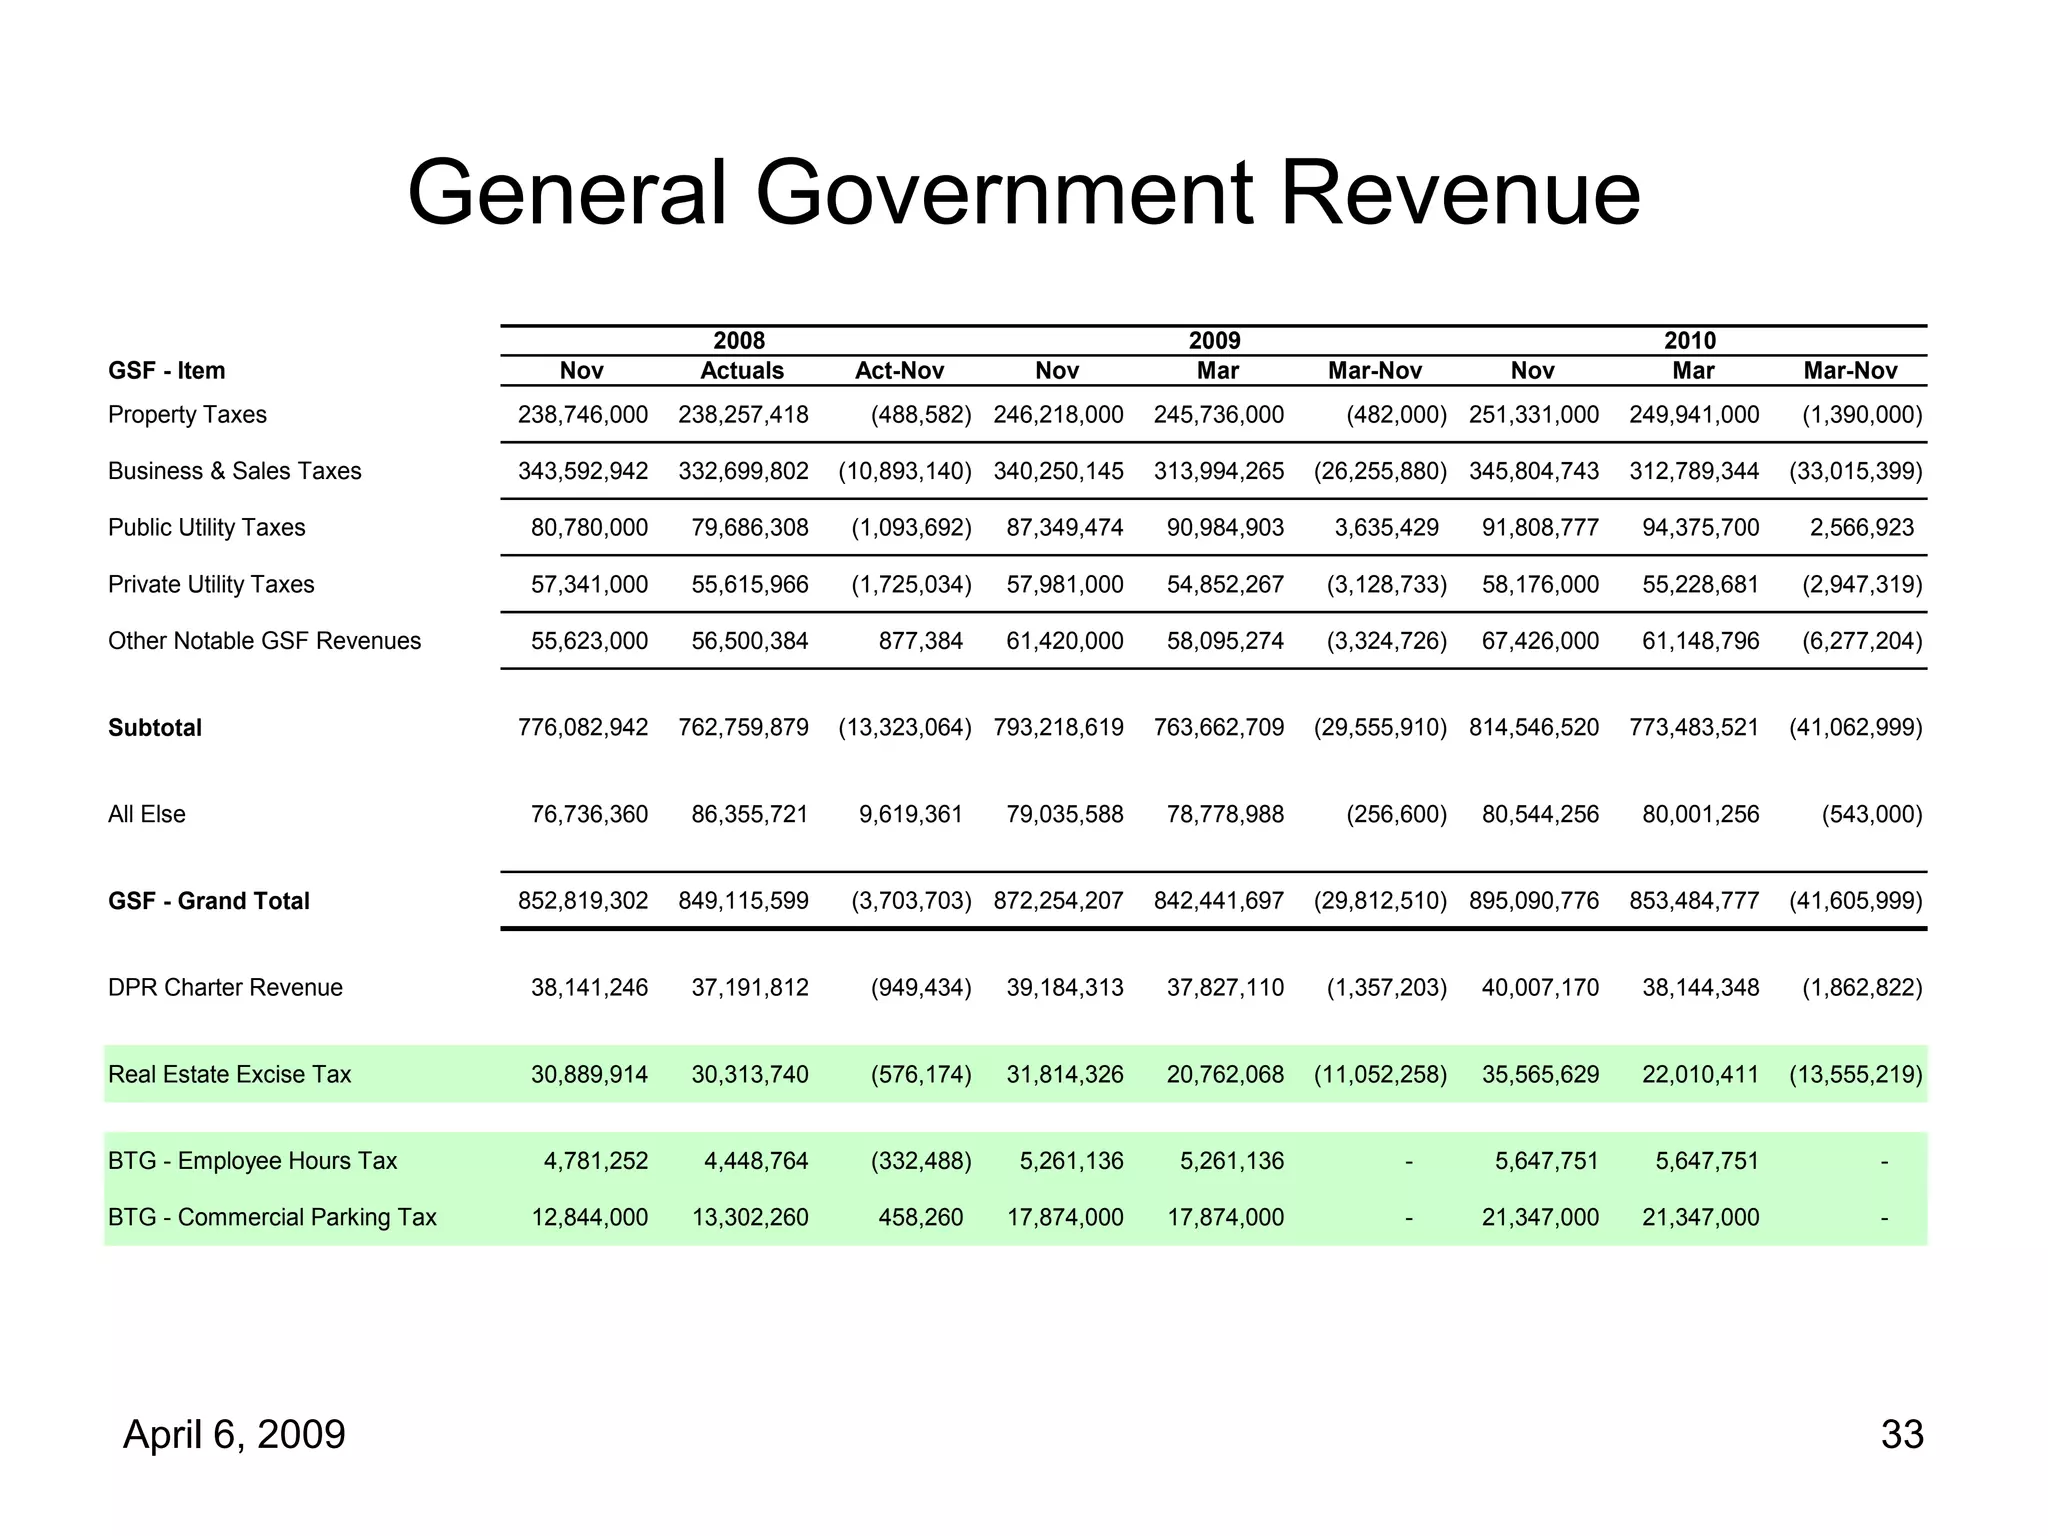
This document provides an economic forecast and analysis for the City of Seattle. It summarizes key factors that led to the current recession, including asset bubbles, cheap credit, loose lending standards, and the bursting of the housing bubble. It then analyzes recent economic indicators and forecasts a major regional recession for the Puget Sound area, with peak job losses of over 30,000. Revenue forecasts predict declines for sales tax, B&O tax, and natural gas utility tax due to weakness in construction, retail, and energy prices.
Dr. Anne M. Alexander, the Director of International Programs for the University of Wyoming, gave a presentation on the economic outlooks of Utah, Wyoming, and Idaho at the Tri-State Telecommunications Conference on August 1, 2012 in Jackson, WY.
Tim Pulido, President & CEO with 30 years of restaurant industry experience, presents his outlook for 2012 and the brand strategies necessary to win in the New Normal.
California Community College Real Estate Educators' Conference, Los Angeles, CA. 2013 Real Estate Economic Forecast presented by Sara Sutachan, Senior Research Fellow, California Association of Realtors.
Here are seven stories about apartment market and investment trends in the Puget Sound region. This is a summary of our presentation on Wednesday to the Rental Housing Association of Puget Sound at their annual Spring Workshop. Fasten your seatbelt. That presentation was 70 minutes but we'll whisk you through the key points in this 8 minute video.
CAR Chief Economist Leslie Appleton Young provides an economic update to the Murrieta Temecula Group and the Southwest Riverside County Association of Realtors
Agcapita is Canada's only RRSP and TFSA eligible farmland fund and is part of a family of funds with almost $100 million in assets under management. Agcapita believes farmland is a safe investment, that supply is shrinking and that unprecedented demand for "food, feed and fuel" will continue to move crop prices higher over the long-term. Agcapita created the Farmland Investment Partnership to allow investors to add professionally managed farmland to their portfolios. Agcapita publishes a monthly Agriculture Brief which deals with agriculture specific investment issues along with big picture macro-economic issues.
Day 2, Session 5: The role of tenure and governance in climate change mitigation and adaptation
Presentation by Don Roberts, Managing Director, Canadian Imperial Bank of Commerce
Join IFAD and the Global Donor Platform for the launch of the report: The strategic role of the private sector in agriculture and rural development. Jonathan Mitchell (ODI), lead author of Platform Knowledge Piece 3 will be joined in his presentation via video by the authors of the Tanzania, Thailand and Vietnam country studies: Frédéric Kilcher, Wyn Ellis and Pham Thai Hung. A Question and Answer session will follow each discussion point.
The briefing released on 24 August 2012, reveals among other things that drought in large parts of the United States is pushing up world food prices, that emerging markets ease monetary policy to stimulate growth and that the debt crisis in the eurozone remains a major source of uncertainty.
State of the Economy: What happened and when will it come to an end? Christop...ECPA Events
Last year even as the US was already in a recession not only were forecasters saying we weren't in a downturn, they were predicting that the economy would be moving strongly forward by the beginning of 2009.
CrossborderInforma: Regional Border Crossing Trends & Economic ImpactsCrossborder Group
September 2012 CrossborderInforma briefing by Crossborder Group: a snapshot of borderwide border crossing trends along the US-Mexico border, with a focus on regional border crossing trends in the San Diego-Tijuana region -- and the economic impacts of crossborder shoppers on San Diego's retail sector and the economy. Selected survey data from Crossborder Group's proprietary at-border surveys also provide insights about crossborder consumer purchases.
CrossborderInforma briefings are issued 1-2 times each month, covering a variety of economic, industry, and policy-related issues in Mexico and along the US-Mexico border region. For more information, please contact our firm at Answers[at]CrossborderBusiness[dot]com, or call us toll free at 1-888-4XBORDER [888-492-6733]. Have a Mexico or NAFTA question? We can help.
If you choose a career interior design, chances are money is not your focus, but doing good, designing experiences and making people happy is. In this presentation we help you realize your passion, and discuss ways to apply it. Great content for students and young professionals.
2. Elemental Economics - Mineral demand.pdfNeal Brewster
After this second you should be able to: Explain the main determinants of demand for any mineral product, and their relative importance; recognise and explain how demand for any product is likely to change with economic activity; recognise and explain the roles of technology and relative prices in influencing demand; be able to explain the differences between the rates of growth of demand for different products.
The European Unemployment Puzzle: implications from population agingGRAPE
We study the link between the evolving age structure of the working population and unemployment. We build a large new Keynesian OLG model with a realistic age structure, labor market frictions, sticky prices, and aggregate shocks. Once calibrated to the European economy, we quantify the extent to which demographic changes over the last three decades have contributed to the decline of the unemployment rate. Our findings yield important implications for the future evolution of unemployment given the anticipated further aging of the working population in Europe. We also quantify the implications for optimal monetary policy: lowering inflation volatility becomes less costly in terms of GDP and unemployment volatility, which hints that optimal monetary policy may be more hawkish in an aging society. Finally, our results also propose a partial reversal of the European-US unemployment puzzle due to the fact that the share of young workers is expected to remain robust in the US.
What price will pi network be listed on exchangesDOT TECH
The rate at which pi will be listed is practically unknown. But due to speculations surrounding it the predicted rate is tends to be from 30$ — 50$.
So if you are interested in selling your pi network coins at a high rate tho. Or you can't wait till the mainnet launch in 2026. You can easily trade your pi coins with a merchant.
A merchant is someone who buys pi coins from miners and resell them to Investors looking forward to hold massive quantities till mainnet launch.
I will leave the what's app number of my personal pi vendor to trade with.
+12349014282
how to sell pi coins effectively (from 50 - 100k pi)DOT TECH
Anywhere in the world, including Africa, America, and Europe, you can sell Pi Network Coins online and receive cash through online payment options.
Pi has not yet been launched on any exchange because we are currently using the confined Mainnet. The planned launch date for Pi is June 28, 2026.
Reselling to investors who want to hold until the mainnet launch in 2026 is currently the sole way to sell.
Consequently, right now. All you need to do is select the right pi network provider.
Who is a pi merchant?
An individual who buys coins from miners on the pi network and resells them to investors hoping to hang onto them until the mainnet is launched is known as a pi merchant.
debuts.
I'll provide you the what'sapp number.
+12349014282
where can I find a legit pi merchant onlineDOT TECH
Yes. This is very easy what you need is a recommendation from someone who has successfully traded pi coins before with a merchant.
Who is a pi merchant?
A pi merchant is someone who buys pi network coins and resell them to Investors looking forward to hold thousands of pi coins before the open mainnet.
I will leave the what'sapp contact of my personal pi merchant to trade with
+12349014282
This presentation poster infographic delves into the multifaceted impacts of globalization through the lens of Nike, a prominent global brand. It explores how globalization has reshaped Nike's supply chain, marketing strategies, and cultural influence worldwide, examining both the benefits and challenges associated with its global expansion.
PPrreesseenntteedd bbyy:: GGrroouupp 66
GGlloobbaalliizzaattiioonn
o f
PP
oo
ll
yy
ee
ss
tt
ee
rr
RR
uu
bb
bb
ee
rr
EE
tt
hh
yy
ll
ee
nn
ee
VV
ii
nn
yy
ll
AA
cc
ee
tt
aa
tt
ee
GG
ee
nn
uu
ii
nn
ee
LL
ee
aa
tt
hh
ee
rr
SS
yy
nn
tt
hh
ee
tt
ii
cc
LL
ee
aa
tt
hh
ee
rr
CC
oo
tt
tt
oo
nn
C
o
u
n
t
r
i
e
s
I
n
v
o
l
v
e
d
Ni
k
e
h
a
s
m
o
r
e
t
h
a
n
7
0
0
s
h
o
p
s
i
n
c
o
n
t
r
a
c
t
w
i
t
h
w
o
r
l
d
w
i
d
e,
w
h
e
r
e
i
n
t
h
e
i
r
offi
c
e
s
a
n
d
i
n
d
e
p
e
n
d
e
n
t
fa
c
t
o
r
y
o
u
t
l
e
t
s
a
r
e
fo
u
n
d
w
i
t
h
i
n
t
h
e
p
r
e
m
i
s
e
s
of
ap
p
r
o
x
i
m
a
t
e
l
y
4
5
c
o
u
n
t
r
i
e
s.
AAuussttrraalliiaa
China
India
IInnddoonneessiiaa
TThhaaiillaanndd
TTuurrkkeeyy
USA
VViieettnnaamm
NNiikkee SSuuppppllyy CChhaaiinn
RRuubbbbeerr,, FFaabbrriicc
aanndd ootthheerr rraaww
mmaatteerriiaallss
Shoe
MMaannuuffaaccttuurriinngg
aanndd AAsssseemmbbllyy
MMaarrkkeettiinngg
SSppoorrttiinngg ggooooddss,,
ddeevveellooppmmeenntt
aanndd SShhooee ssttoorreess
OOnnlliinnee,, CCaattaalloogg
aanndd ootthheerr rreettaaiill
NNiikkee bbrraannddeedd
shoes
PPrroodduucctt
ddeevveellooppmmeenntt
CCuussttoommeerr nneeeeddss//wwaannttss ffeeeeddbbaacckk
NNiikk
Nike Supply Chain
Globalization of Nike
Nike Manufacturing Process
Rubber Materials Nike
Ethylene Vinyl Acetate Nike
Genuine Leather Nike
Synthetic Leather Nike
Cotton in Nike Apparel
Nike Shops Worldwide
Nike Manufacturing Countries
Cold Cement Assembly Nike
3D Printing Nike Shoes
Nike Product Development
Nike Marketing Strategies
Nike Customer Feedback
Nike Distribution Centers
Automation in Nike Manufacturing
Nike Consumer Direct Acceleration
Nike Logistics and Transport
when will pi network coin be available on crypto exchange.DOT TECH
There is no set date for when Pi coins will enter the market.
However, the developers are working hard to get them released as soon as possible.
Once they are available, users will be able to exchange other cryptocurrencies for Pi coins on designated exchanges.
But for now the only way to sell your pi coins is through verified pi vendor.
Here is the what'sapp contact of my personal pi vendor
+12349014282
1. Elemental Economics - Introduction to mining.pdfNeal Brewster
After this first you should: Understand the nature of mining; have an awareness of the industry’s boundaries, corporate structure and size; appreciation the complex motivations and objectives of the industries’ various participants; know how mineral reserves are defined and estimated, and how they evolve over time.
how to swap pi coins to foreign currency withdrawable.DOT TECH
As of my last update, Pi is still in the testing phase and is not tradable on any exchanges.
However, Pi Network has announced plans to launch its Testnet and Mainnet in the future, which may include listing Pi on exchanges.
The current method for selling pi coins involves exchanging them with a pi vendor who purchases pi coins for investment reasons.
If you want to sell your pi coins, reach out to a pi vendor and sell them to anyone looking to sell pi coins from any country around the globe.
Below is the what'sapp information for my personal pi vendor.
+12349014282
BONKMILLON Unleashes Its Bonkers Potential on Solana.pdfcoingabbar
Introducing BONKMILLON - The Most Bonkers Meme Coin Yet
Let's be real for a second – the world of meme coins can feel like a bit of a circus at times. Every other day, there's a new token promising to take you "to the moon" or offering some groundbreaking utility that'll change the game forever. But how many of them actually deliver on that hype?
This assessment plan proposal is to outline a structured approach to evaluati...
4 6 09 Forecast Mtg Council
1. City of Seattle
Department of Finance
Economic & Revenue
Forecast
April 6, 2009
2. U.S. Economy: The path to the current recession
• Past 20 years has been era of asset bubbles
– Stock market in the 1990s
– Housing in the current decade, also commodities
• Bubble formation has been facilitated by
– Cheap money
• Federal Reserve policies
• Asian savings glut
– Loose lending standards
– Deregulation & lax regulation of financial sector
April 6, 2009 2
3. • Bubbles have led to:
– Excessive borrowing and debt buildup
– Excessive risk taking
• Housing bubble popped in 2006. With prices falling:
– Loans have gone bad, reducing value of securities
• Leading to financial crisis
– Household wealth has declined
• Leading to drop in consumer spending
• Housing downturn and financial crisis caused recession
– U.S. recession began in December 2007
April 6, 2009 3
4. U.S. Personal Income and Household Debt: 1980 Q1 = 100
1,200
1,000
Household
800
debt
600
Personal
400
income
200
0
1980 Q1
1985 Q1
1990 Q1
1995 Q1
2000 Q1
2005 Q1
Source: Federal Reserve Board.
• Household debt increased 97% from 2000 to 2008.
April 6, 2009 4
5. Monthly Change in U.S. Employment
400
200
Thousands of jobs
0
Dec-00
Dec-01
Dec-03
Dec-04
Dec-06
Dec-07
Dec-08
Dec-02
Dec-05
Jun-00
Jun-01
Jun-03
Jun-04
Jun-05
Jun-07
Jun-08
Jun-02
Jun-06
-200
-400
-600
-800
Source: U.S. Bureau of Labor Statistics. Data are seasonally adjusted.
• 5.1 million jobs lost since Dec-07; 3.3 million in past 5 months.
• Unemployment rate hit 8.5% in March; highest since 1983.
April 6, 2009 5
6. Recent weeks have seen a few positive signs
• Stock market is up over 20% from early March low
• Home sales rose in February: new 4.7%, existing 5.1%
• Single family permits rose 11.0% in February
• U.S. retail sales rose in January and February
measured on month-to-month basis
• Orders for manufactured goods rose 1.8% in February
• Shipping volumes are showing signs of stabilizing
– Rail, truck, container, air freight
April 6, 2009 6
7. U.S. Economic Forecast
U.S. GDP Forecasts for October 2008 and March 2009
4%
2%
Oct-08
0% Forecast
2008 2008 2008 2008 2009 2009 2009 2009 2010 2010 2010 2010
Q1 Q2 Q3 Q4 Q1 Q2 Q3 Q4 Q1 Q2 Q3 Q4
-2%
Mar-09
Forecast
-4%
-6%
-8%
Source: Global Insight.
April 6, 2009 7
8. Puget Sound Economy: Recent trends
• 2001-03 recession was very severe locally
– Recovery started later here
– Housing bubble cycle was delayed
• Current downturn arrived later here
– Construction peaked in Nov-07 locally
• Compared to Jan-07 for U.S.
– Aerospace employment increased through 2008 Q3
– Software employment increased through 2008 Q4
• Falloff beginning in 2008 Q4 has been very steep
– 53,400 jobs lost from Aug-08 to– Feb-09 in King
& Snohomish Co., a 3.6% decline
April 6, 2009 8
9. S&P/Case-Shiller Home Price Index, 2000 Q1 = 100
200
180
U.S.
160
140
Seattle
120 Metro
Area
100
80
2000 Q1
2001 Q1
2002 Q1
2003 Q1
2004 Q1
2005 Q1
2006 Q1
2007 Q1
2008 Q1
April 6, 2009 9
10. Employment: December 2000 =100
106
104
U.S.
102
100
98
Seattle
Metro
96
Area*
94
92
Jan-99
Jan-00
Jan-01
Jan-03
Jan-04
Jan-05
Jan-07
Jan-08
Jan-09
Jan-02
Jan-06
*King & Snohomish Counties. Data adjusted to remove effects of Boeing strikes.
Data are seasonally adjusted non-agricultural wage & salary employment.
April 6, 2009 10
11. Puget Sound Region Economic Forecast
• Regional forecast is based on Feb-09 U.S. forecast
April 6, 2009 11
12. Job Losses in the Five Most Recent Puget Sound* Recessions
Percent Decline from pre-Recession Peak
1%
1980
2008-10
2001-03
1990-91 1981-83 Forecast
0%
0 1 2 3 4 5 6 7 8 9 10 11 12 13 14 15 16 17 18 19 20
-1%
-2%
-3%
-4%
-5%
Quarters from pre-recession peak
*King, Kitsap, Pierce, and Snohomish Counties.
April 6, 2009 12
13. Why is 2008-10 forecast not as bad as 2001-03?
• 2001-03 was very bad locally. Employment decline:
-2.0% U.S.
-4.8% Puget Sound Region (4 counties)
-6.6% Seattle Metro Area (King & Snohomish Counties)
• Modest cuts announced by Boeing, Microsoft thus far
– In 2001-03, Boeing cut 27,200 jobs in less than 3 yrs
• Areas of U.S. hardest hit in this recession include:
– Areas with big housing bubbles
– Manufacturing centers, especially auto related
– Financial centers
– Areas dependent on travel, tourism, in-migration
April 6, 2009 13
14. What has changed since the last revenue forecast?
(which was prepared in Oct. 2008)
• U.S. and local economies have declined steeply
– as has City sales and B&O tax revenue
• Economic forecasts have been revised
– Major recession is now forecast
– Deflation or very low inflation is expected in 2009
– Savings rate forecast has been raised
• Falling wealth = higher savings & weaker spending
– Weaker spending = lower tax revenue
April 6, 2009 14
17. Change in 2009 Forecast from Sept. 2008 to Feb. 2009
6% 5.6%
5%
4%
3.1% Sep '08
3% Forecast
2%
1.3%
1% 0.4% Feb '09
Forecast
0%
PS Region Employment US PCE Deflator US Savings Rate
-1%
-0.3%
-2%
-2.4%
-3%
Source: Puget Sound Economic Forecaster; Global Insight (savings rate).
April 6, 2009 17
18. Retail Sales Tax
• Revenue was flat in 2008 (up 0.2% from 2007)
– Sharp deceleration over course of year
– Snowstorm hurt December revenue (-11.4% yr-over-yr)
– Non-current revenue declined $1.4 mil. from 2007
• Performance by industry in 2008:
– Construction was up 10.4%; flat in the 4th quarter
– Retail trade was down 3.1%; flat without auto sales
Motor vehicles & parts fell 20.6%
o
– Finance, insurance, real estate declined 5.0%
– Service industries had modest growth of 1.5%
April 6, 2009 18
21. Sales Tax Forecast
• Reflects forecast of major regional recession
• Over two-thirds of tax base is in cyclical industries
– Construction, trade, manufacturing, etc.
o Construction’s share of base = 24.4% in 2008
• Forecast of peak-to-trough revenue decline is 10.6%
– Compared to 11.4% drop in 2001-03
– Expect 6.7% decline in 2009; 1.9% drop in 2010
• Construction forecast: real decline of 23.1% over 3 years
– Largest real decline since at least 1975
– Assumes continued public construction
• Motor vehicle sales weakness will continue in 2009
April 6, 2009 21
23. B&O Tax
• B&O revenue started 2008 with healthy growth and
ended the year in decline
• From 2007 to 2008 B&O revenue declined by $3.8 mil. (2.3%)
– Non-current revenue declined by $5.3 mil.
– Excluding non-current yields $1.5 mil. gain
• Forecast reflects:
– Severity of downturn
– 50% of B&O base is relatively stable service industries
– Lower expectations for non-current revenue
• Forecast of peak-to-trough revenue decline is 8.1%
– Compared to 8.6% in 2001-03
April 6, 2009 23
25. Combined Sales and B&O Tax Revenue Forecast
350
340
330
Millions of dollars
Nov-08
Forecast
320
310
Apr-09
300 Forecast
290
280
2006 2007 2008 2009 2010
April 6, 2009 25
26. Utility Business Tax – Natural Gas
• Natural Gas tax revenue is dependent on both weather
and prices
• Natural gas prices rose 27% in 2008 over 2007
• Year-over-year Henry Hub prices were up 49% in the
3rd quarter
• Utility Tax revenue on natural gas was also up 44% in the
3rd quarter
• Natural gas spot prices have plummeted since the summer,
along with other energy commodities
• As a result, receipts are expected to be down 15% for
2009 over 2008, a 24% decrease from the Adopted
2009 Budget
April 6, 2009 26
28. Real Estate and REET
• 2008 saw the national housing and property bust come
to Seattle
• Seattle single-family and condo sales plunged
throughout the year
– Single-family sales were down 33% year-over-year in Q408,
28% down for the year
– Condo sales were down 63% for the same period, 42% down for
the year
• Commercial activity also slowed considerably as
financing for large developments has evaporated
• Home sales are expected to pick up at the end of 2009,
as home prices continue to fall during 2010
April 6, 2009 28
29. Real Estate and REET
Real Value of Seattle Real Estate Sales
Millions of 2000 dollars
6,000
5,000
Comm.
4,000
Condo
3,000
2,000 Resid.
1,000
0
1982
1985
1988
1991
1994
1997
2000
2003
2006
April 6, 2009 29
30. Real Estate and REET
• The REET forecast expects a 28% decline in average
home prices from peak (3Q07) to trough (4Q10)
• This forecast expects the Seattle market to mimic the
national one
• Foreclosures are expected to rise in the area as the
Seattle market was one of the last to see subprime and
alternative mortgage originations
• Office vacancy rates remain under 10%, a good sign
compared to the national 14.2% rate
• There is limited scope for large property deals and only
downside risk to vacancy rates
April 6, 2009 30
34. General Subfund Status
Annual Operating Position
(Revenues minus Expenses)
2009 April
Adopted Budget Forecast Revision
(Nov. 2008) (Apr. 2009) Difference
21,400,000 15,200,000 (6,200,000)
2008
(6,510,000) (40,530,000) (34,020,000)
2009
(14,875,000) (58,851,000) (43,976,000)
2010
April 6, 2009 34
35. Cumulative Reserve Subfund (REET) Status
2009 Adopted Budget April Forecast Revision
(Nov. 2008) (Apr. 2009)
Resources
2008 Yearend Balance
8,481,000 10,836,000
(includes anticipated abandonments)
2009 Estimated Revenue 31,814,000 20,762,000
2010 Estimated Revenue 35,566,000 22,010,000
Total Resources Available in the Biennium 75,861,000 53,608,000
Biennial Planned Expenditures
2009-10 Debt Service Expenditures 28,013,000 28,013,000
2009-10 Discretionary Expenditures 47,021,000 47,021,000
Total Planned Expenditures in the Biennium 75,034,000 75,034,000
Balance 827,000 (21,426,000)
April 6, 2009 35
36. Risks to the forecast
• Risks are large and mostly on the downside
– This recession is different, thus harder to forecast
– Housing market uncertainty is great
– Forecasts assume success of stimulus, bank bailout
– Savings rate shift makes it hard to forecast consumption
– Construction outlook is very uncertain
– Potential for more cuts at region’s large employers
• Upside potential
– Federal policies may be more effective than expected
– B&O non-current revenue may bounce back
April 6, 2009 36
37. Pessimistic Revenue Scenario
• Based on pessimistic U.S. forecast. Assumptions:
–Financial conditions worsen, restricting access to credit
• This leads to reduced spending and investment,
and further weakens the housing market
• The weak housing market further reduces wealth
and damages consumer confidence
• Causing a steeper drop in consumer spending
• Employment falls for 11 consecutive quarters
– Employment growth resumes in 2010 Q4
• Recovery is weak as consumers rebuild savings
April 6, 2009 37
38. U.S. Employment Forecast Scenarios
140
138
Baseline
136
Millions of jobs
forecast
134
132 Low
scenario
130
128
2007 Q1
2008 Q1
2009 Q1
2012 Q1
2010 Q1
2011 Q1
Source: Global Insight 's March 2009 U.S. forecast.
April 6, 2009 38
39. General Subfund Revenue Scenarios
895
890
885
Millions
880 Baseline
Low
875
870
865
2008 2009 2010
April 6, 2009 39
40. Real Estate Excise Tax Scenarios
35
30
25
Millions
20
Base
15
Low
10
5
-
2008 2009 2010
April 6, 2009 40