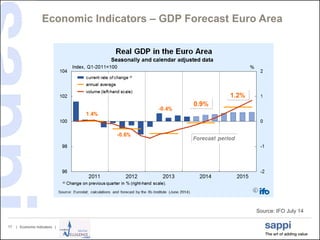
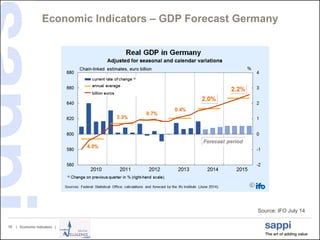
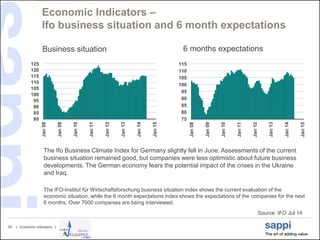
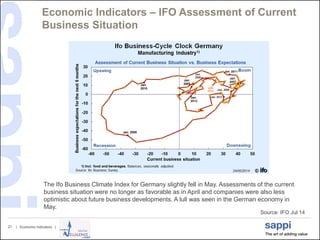
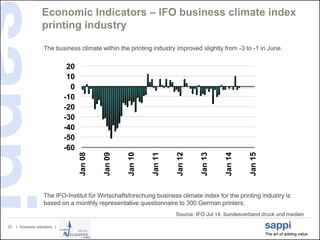
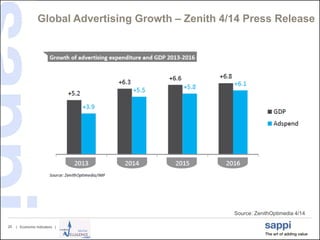
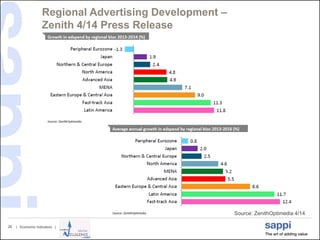
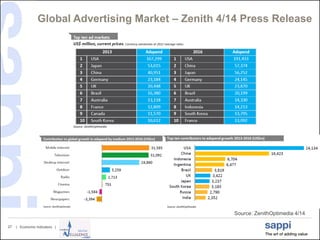
| [Presentation title] | [Client Name] | [Date]1
Economic Indicators
Last update 18.7.2014
| Economic Indicators |2
Economic Outlook Monthly Overview – July 2014
Europe:
• Consensus July GDP forecast for WE remained stable on 1,5% for 2014 and on 1,8% for 2015.
• The EU industrial confidence and the consumer confidence both fell slightly in June.
• The IFO Business Climate index for Germany slightly fell again in June. The German economy
fears the potential impact of the crises in the Ukraine and Iraq.
• Following a relatively solid +0,9% y-o-y uptick in Q1 GDP growth, Q2 appears to be flagging.
May industrial reports weakened in several regions but the hope is for a bounce back in June,
although the manufacturing PMI moderated. Concern over the still fragile state of the recovery
puts additional pressure on policymakers to jumpstart activity.
US:
• Consensus July GDP forecast for the US decreased strongly again from 2,2% to 1,6% for 2014
and from 3,1% to 3,0% for 2015.
• GDP prospects have dimmed this month again after Q1 growth was downgraded to -2,9% q-o-q
from -1,0%. The poor outturn was largely due to harsh weather conditions and many economists
cite the Q1 contraction as a temporary blip. Jobless rate in June slipped from 6,3% to 6,1% but
wage growth remains muted, also contributing to a softer consumption outlook.
Japan:
• The July GDP growth forecast for Japan remained stable on 1,5% for 2014 and improved from
1,2% to 1,3% for 2015.
• The Tankan business sentiment survey slipped in Q2, a development which did not come as a
surprise, following the April consumption tax hike. Export weakness is still a concern as the
trade balance remains in deficit.
3 | Economic Indicators |
Eurostat Data
| Economic Indicators |4
Economic Indicators – GDP EU 28
Source: Eurostat June 14
-5
-4
-3
-2
-1
0
1
2
3
4
08Q1
09Q1
10Q1
11Q1
12Q1
13Q1
14Q1
%
GDP for the EU 28 countries at constant prices quarter vs. same quarter of last year
| Economic Indicators |5
Economic Indicators – GDP EU 28
Source: Eurostat June 14
-2,5
-2
-1,5
-1
-0,5
0
0,5
1
08Q1
09Q1
10Q1
11Q1
12Q1
13Q1
14Q1
%
GDP for the EU 28 countries at constant prices quarter on quarter
| Economic Indicators |6
Economic Indicators –EU 28 Consumer Price Index
Source: Eurostat July 14
0
0,5
1
1,5
2
2,5
3
3,5
4
4,5
08/1
09/1
10/1
11/1
12/1
13/1
14/1
15/1
0,7
%
The harmonized index of consumer prices is the result of the collaboration
between Eurostat and National Statistical Institutes of the Member States.
| Economic Indicators |7
Economic Indicators – ECB interest rate
Source: ECB, FED, Eurostat Jul 14
Jun.14; 0,5
Jul.14; 0,15
Jul.14; 0,25
-0,5
0,0
0,5
1,0
1,5
2,0
2,5
3,0
3,5
4,0
4,5
Jan08
July08
Jan09
Jul.09
Jan10
Jul.10
Jan11
July11
Jan12
Jul.12
Jan13
Jul.13
Jan14
Jul.14
Jan15
%
ECB short-term rate
Eurozone inflation
FED rate
| Economic Indicators |8
Economic Indicators –EU 28 Unemployment Rate
Source: Eurostat Jul 14
10,3
6
7
8
9
10
11
12
Jan08
Jan09
Jan10
Jan11
Jan12
Jan13
Jan14
Jan15
%
Unemployment rate for EU 28 countries
| Economic Indicators |9
Economic Indicators – Industrial Confidence Ind EU
Source: Eurostat Jul 14
-40
-35
-30
-25
-20
-15
-10
-5
0
5
10
Jan08
Jan09
Jan10
Jan11
Jan12
Jan13
Jan14
Jan15
Industrial confidence within EU 28 decreased slightly in June, but the industry
remains in a fairly positive mood.
The Industrial Confidence Indicator is the arithmetic average of the answers to the
questions on production expectations, order books and stocks.
| Economic Indicators |10
Economic Indicators – Consumer Confidence Ind EU
Source: Eurostat Jul 14
Consumer Confidence within EU 28 deteriorated very slightly in June but remains
on a fairly good level.
-35
-30
-25
-20
-15
-10
-5
0
Jan08
Jan09
Jan10
Jan11
Jan12
Jan13
Jan14
Jan15
The Consumer Confidence Indicator is the arithmetic average of the answers to the questions
on the financial situation of households and general economic situation (past and future)
together with that on the advisability of making major purchases.
| Economic Indicators |11
Economic Indicators – Capacity Utilization
in Manufacturing Industry in % - EU 27
Source: Eurostat May 14
60
65
70
75
80
85
04Q1
05Q1
06Q1
07Q1
08Q1
09Q1
10Q1
11Q1
12Q1
13Q1
14Q1
79,5
%
The capacity utilization in manufacturing industry gives the level of capacity utilization
in percent, as assessed by managers in manufacturing industry.
| Economic Indicators |12
Ifo Data
| Economic Indicators |13
Economic Indicators – IFO World Economic Climate
Source: IFO May 14
The Ifo World Economic climate clouded slightly regarding expectations in Q2 2014
but remains friendly overall.
This indicator is being updated on a quarterly basis.
| Economic Indicators |14
Economic Indicators – IFO European Economic Climate
Source: IFO May 14
The economic climate in Europe continued its positive path in Q2 2014.
This indicator is being updated on a quarterly basis.
| Economic Indicators |15
Economic Indicators – IFO NA Economic Climate
Source: IFO May 14
This indicator is being updated on a quarterly basis.
| Economic Indicators |16
Economic Indicators – IFO Asia Economic Climate
Source: IFO May 14
This indicator is being updated on a quarterly basis.
The economic climate in Asia slowed down quite significantly in Q2 2014.
| Economic Indicators |17
Economic Indicators – GDP Forecast Euro Area
Source: IFO July 14
| Economic Indicators |18
Economic Indicators – GDP Forecast Germany
Source: IFO July 14
| Economic Indicators |19
Economic Indicators – Exchange rate $ vs €
Source: IFO July 14
| Economic Indicators |20
Economic Indicators –
Ifo business situation and 6 month expectations
Source: IFO Jul 14
75
80
85
90
95
100
105
110
115
Jan08
Jan09
Jan10
Jan11
Jan12
Jan13
Jan14
Jan15
80
85
90
95
100
105
110
115
120
125
Jan08
Jan09
Jan10
Jan11
Jan12
Jan13
Jan14
Jan15
Business situation 6 months expectations
The IFO-Institut für Wirtschaftsforschung business situation index shows the current evaluation of the
economic situation, while the 6 month expectations index shows the expectations of the companies for the next
6 months. Over 7000 companies are being interviewed.
The Ifo Business Climate Index for Germany slightly fell in June. Assessments of the current
business situation remained good, but companies were less optimistic about future business
developments. The German economy fears the potential impact of the crises in the Ukraine
and Iraq.
| Economic Indicators |21
Economic Indicators – IFO Assessment of Current
Business Situation
Source: IFO Jul 14
The Ifo Business Climate Index for Germany slightly fell in May. Assessments of the current
business situation were no longer as favorable as in April and companies were also less
optimistic about future business developments. A lull was seen in the German economy in
May.
| Economic Indicators |22
Economic Indicators – IFO business climate index
printing industry
Source: IFO Jul 14, bundesverband druck und medien
-60
-50
-40
-30
-20
-10
0
10
20
Jan08
Jan09
Jan10
Jan11
Jan12
Jan13
Jan14
Jan15
The IFO-Institut für Wirtschaftsforschung business climate index for the printing industry is
based on a monthly representative questionnaire to 300 German printers.
The business climate within the printing industry improved slightly from -3 to -1 in June.
| Economic Indicators |23
Economic Indicators – IFO business climate index
printing industry
The IFO-Institut für Wirtschaftsforschung business climate index for the printing industry is
based on a monthly representative questionnaire to 300 German printers.
Business Development at German Printers – June 2014:
 The assessment of the current business situation in the printing
industry again deteriorated in June but still remained on a better level
than in spring and summer of the previous year.
 The business climate – an indicator for the development in
the next quarter – improved slightly from -3% to -1% in June.
 The business expectations for the coming 6 months improved
considerably and reached the second best value of the last 12 months.
Source: IFO Jul 14, bundesverband druck und medien
| Economic Indicators |24
Zenith Data
| Economic Indicators |25
Global Advertising Growth – Zenith 4/14 Press Release
Source: ZenithOptimedia 4/14
| Economic Indicators |26
Regional Advertising Development –
Zenith 4/14 Press Release
Source: ZenithOptimedia 4/14
| Economic Indicators |27
Global Advertising Market – Zenith 4/14 Press Release
Source: ZenithOptimedia 4/14
| Economic Indicators |28
Advertising by medium – Zenith 4/14 Press Release
Source: ZenithOptimedia 4/14

Economic Indicators July 2014

  • 1.
    | [Presentation title]| [Client Name] | [Date]1 Economic Indicators Last update 18.7.2014
  • 2.
    | Economic Indicators|2 Economic Outlook Monthly Overview – July 2014 Europe: • Consensus July GDP forecast for WE remained stable on 1,5% for 2014 and on 1,8% for 2015. • The EU industrial confidence and the consumer confidence both fell slightly in June. • The IFO Business Climate index for Germany slightly fell again in June. The German economy fears the potential impact of the crises in the Ukraine and Iraq. • Following a relatively solid +0,9% y-o-y uptick in Q1 GDP growth, Q2 appears to be flagging. May industrial reports weakened in several regions but the hope is for a bounce back in June, although the manufacturing PMI moderated. Concern over the still fragile state of the recovery puts additional pressure on policymakers to jumpstart activity. US: • Consensus July GDP forecast for the US decreased strongly again from 2,2% to 1,6% for 2014 and from 3,1% to 3,0% for 2015. • GDP prospects have dimmed this month again after Q1 growth was downgraded to -2,9% q-o-q from -1,0%. The poor outturn was largely due to harsh weather conditions and many economists cite the Q1 contraction as a temporary blip. Jobless rate in June slipped from 6,3% to 6,1% but wage growth remains muted, also contributing to a softer consumption outlook. Japan: • The July GDP growth forecast for Japan remained stable on 1,5% for 2014 and improved from 1,2% to 1,3% for 2015. • The Tankan business sentiment survey slipped in Q2, a development which did not come as a surprise, following the April consumption tax hike. Export weakness is still a concern as the trade balance remains in deficit.
  • 3.
    3 | EconomicIndicators | Eurostat Data
  • 4.
    | Economic Indicators|4 Economic Indicators – GDP EU 28 Source: Eurostat June 14 -5 -4 -3 -2 -1 0 1 2 3 4 08Q1 09Q1 10Q1 11Q1 12Q1 13Q1 14Q1 % GDP for the EU 28 countries at constant prices quarter vs. same quarter of last year
  • 5.
    | Economic Indicators|5 Economic Indicators – GDP EU 28 Source: Eurostat June 14 -2,5 -2 -1,5 -1 -0,5 0 0,5 1 08Q1 09Q1 10Q1 11Q1 12Q1 13Q1 14Q1 % GDP for the EU 28 countries at constant prices quarter on quarter
  • 6.
    | Economic Indicators|6 Economic Indicators –EU 28 Consumer Price Index Source: Eurostat July 14 0 0,5 1 1,5 2 2,5 3 3,5 4 4,5 08/1 09/1 10/1 11/1 12/1 13/1 14/1 15/1 0,7 % The harmonized index of consumer prices is the result of the collaboration between Eurostat and National Statistical Institutes of the Member States.
  • 7.
    | Economic Indicators|7 Economic Indicators – ECB interest rate Source: ECB, FED, Eurostat Jul 14 Jun.14; 0,5 Jul.14; 0,15 Jul.14; 0,25 -0,5 0,0 0,5 1,0 1,5 2,0 2,5 3,0 3,5 4,0 4,5 Jan08 July08 Jan09 Jul.09 Jan10 Jul.10 Jan11 July11 Jan12 Jul.12 Jan13 Jul.13 Jan14 Jul.14 Jan15 % ECB short-term rate Eurozone inflation FED rate
  • 8.
    | Economic Indicators|8 Economic Indicators –EU 28 Unemployment Rate Source: Eurostat Jul 14 10,3 6 7 8 9 10 11 12 Jan08 Jan09 Jan10 Jan11 Jan12 Jan13 Jan14 Jan15 % Unemployment rate for EU 28 countries
  • 9.
    | Economic Indicators|9 Economic Indicators – Industrial Confidence Ind EU Source: Eurostat Jul 14 -40 -35 -30 -25 -20 -15 -10 -5 0 5 10 Jan08 Jan09 Jan10 Jan11 Jan12 Jan13 Jan14 Jan15 Industrial confidence within EU 28 decreased slightly in June, but the industry remains in a fairly positive mood. The Industrial Confidence Indicator is the arithmetic average of the answers to the questions on production expectations, order books and stocks.
  • 10.
    | Economic Indicators|10 Economic Indicators – Consumer Confidence Ind EU Source: Eurostat Jul 14 Consumer Confidence within EU 28 deteriorated very slightly in June but remains on a fairly good level. -35 -30 -25 -20 -15 -10 -5 0 Jan08 Jan09 Jan10 Jan11 Jan12 Jan13 Jan14 Jan15 The Consumer Confidence Indicator is the arithmetic average of the answers to the questions on the financial situation of households and general economic situation (past and future) together with that on the advisability of making major purchases.
  • 11.
    | Economic Indicators|11 Economic Indicators – Capacity Utilization in Manufacturing Industry in % - EU 27 Source: Eurostat May 14 60 65 70 75 80 85 04Q1 05Q1 06Q1 07Q1 08Q1 09Q1 10Q1 11Q1 12Q1 13Q1 14Q1 79,5 % The capacity utilization in manufacturing industry gives the level of capacity utilization in percent, as assessed by managers in manufacturing industry.
  • 12.
  • 13.
    | Economic Indicators|13 Economic Indicators – IFO World Economic Climate Source: IFO May 14 The Ifo World Economic climate clouded slightly regarding expectations in Q2 2014 but remains friendly overall. This indicator is being updated on a quarterly basis.
  • 14.
    | Economic Indicators|14 Economic Indicators – IFO European Economic Climate Source: IFO May 14 The economic climate in Europe continued its positive path in Q2 2014. This indicator is being updated on a quarterly basis.
  • 15.
    | Economic Indicators|15 Economic Indicators – IFO NA Economic Climate Source: IFO May 14 This indicator is being updated on a quarterly basis.
  • 16.
    | Economic Indicators|16 Economic Indicators – IFO Asia Economic Climate Source: IFO May 14 This indicator is being updated on a quarterly basis. The economic climate in Asia slowed down quite significantly in Q2 2014.
  • 17.
    | Economic Indicators|17 Economic Indicators – GDP Forecast Euro Area Source: IFO July 14
  • 18.
    | Economic Indicators|18 Economic Indicators – GDP Forecast Germany Source: IFO July 14
  • 19.
    | Economic Indicators|19 Economic Indicators – Exchange rate $ vs € Source: IFO July 14
  • 20.
    | Economic Indicators|20 Economic Indicators – Ifo business situation and 6 month expectations Source: IFO Jul 14 75 80 85 90 95 100 105 110 115 Jan08 Jan09 Jan10 Jan11 Jan12 Jan13 Jan14 Jan15 80 85 90 95 100 105 110 115 120 125 Jan08 Jan09 Jan10 Jan11 Jan12 Jan13 Jan14 Jan15 Business situation 6 months expectations The IFO-Institut für Wirtschaftsforschung business situation index shows the current evaluation of the economic situation, while the 6 month expectations index shows the expectations of the companies for the next 6 months. Over 7000 companies are being interviewed. The Ifo Business Climate Index for Germany slightly fell in June. Assessments of the current business situation remained good, but companies were less optimistic about future business developments. The German economy fears the potential impact of the crises in the Ukraine and Iraq.
  • 21.
    | Economic Indicators|21 Economic Indicators – IFO Assessment of Current Business Situation Source: IFO Jul 14 The Ifo Business Climate Index for Germany slightly fell in May. Assessments of the current business situation were no longer as favorable as in April and companies were also less optimistic about future business developments. A lull was seen in the German economy in May.
  • 22.
    | Economic Indicators|22 Economic Indicators – IFO business climate index printing industry Source: IFO Jul 14, bundesverband druck und medien -60 -50 -40 -30 -20 -10 0 10 20 Jan08 Jan09 Jan10 Jan11 Jan12 Jan13 Jan14 Jan15 The IFO-Institut für Wirtschaftsforschung business climate index for the printing industry is based on a monthly representative questionnaire to 300 German printers. The business climate within the printing industry improved slightly from -3 to -1 in June.
  • 23.
    | Economic Indicators|23 Economic Indicators – IFO business climate index printing industry The IFO-Institut für Wirtschaftsforschung business climate index for the printing industry is based on a monthly representative questionnaire to 300 German printers. Business Development at German Printers – June 2014:  The assessment of the current business situation in the printing industry again deteriorated in June but still remained on a better level than in spring and summer of the previous year.  The business climate – an indicator for the development in the next quarter – improved slightly from -3% to -1% in June.  The business expectations for the coming 6 months improved considerably and reached the second best value of the last 12 months. Source: IFO Jul 14, bundesverband druck und medien
  • 24.
    | Economic Indicators|24 Zenith Data
  • 25.
    | Economic Indicators|25 Global Advertising Growth – Zenith 4/14 Press Release Source: ZenithOptimedia 4/14
  • 26.
    | Economic Indicators|26 Regional Advertising Development – Zenith 4/14 Press Release Source: ZenithOptimedia 4/14
  • 27.
    | Economic Indicators|27 Global Advertising Market – Zenith 4/14 Press Release Source: ZenithOptimedia 4/14
  • 28.
    | Economic Indicators|28 Advertising by medium – Zenith 4/14 Press Release Source: ZenithOptimedia 4/14