Downloaded 107 times


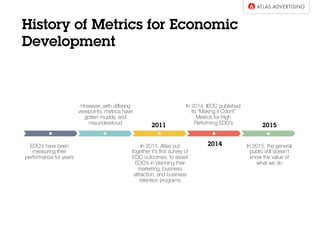


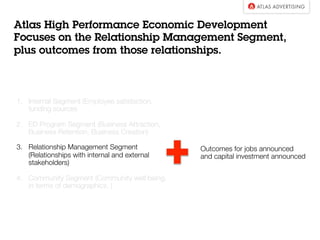


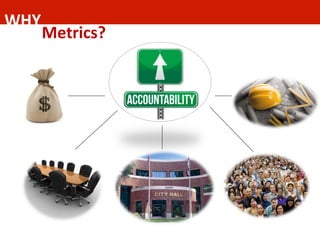

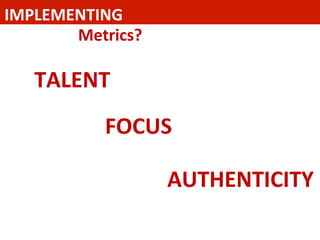


The document discusses economic development survival metrics, highlighting the importance of metrics in enhancing the effectiveness of economic development organizations. It outlines the history and necessity of using performance metrics, presents methods for practical implementation, and emphasizes the need for accountability and robust community relationships. The presentation features insights from industry experts and case studies to illustrate high-performance economic development practices.


![Evaluating your ed efforts bc webinar [compatibility mode]](https://cdn.slidesharecdn.com/ss_thumbnails/evaluating-20your-20ed-20efforts-20-20bc-20webinar-20-5bcompatibility-20mode-5d-130724142906-phpapp02-thumbnail.jpg?width=640&height=640&fit=bounds)


