SlideShare a Scribd company logo
Module 2 Lecture - GDP: A Measure Of Total Production And
Income (cont'd)-2
Using Real GDP To Measure Our Standard of Living
A common method for measuring the standard of living in the
US involves comparing per capita Real GDP (that’ total gross
domestic product divided by the population) from the present to
some pre-determined past year. Table 14.4, pg. 383 shows the
per person Real GDP from 2016 as compared to the per person
Real GDP in 1960. From looking at that table it appears the US
has done very well, increasing from $17,217 per person in 1960
to $56,200 per person in 2016. This isn’t the whole story,
however.
Potential GDP
Potential GDP is the level of real GDP per person when all
factors of production (land, labor, capital, entrepreneurship)
have been utilized to their fullest. This would be the
productivity goal of the US economy. If some of these factors
are underutilized or underemployed, real GDP is producing
below its potential. Think of the loss of productivity with high
rates of unemployment or large tracts of land that are used only
occasionally (football and baseball stadiums or public schools
which lie vacant during 3 months of vacations). The only way to
get a true look at how well the US economy is doing is to look
at its production levels in past years and compare them with the
full potential of production of which the US economy is
capable. Figure 14.3, pg. 384 which I’ve reproduced for you
below, gives us a pretty clear picture of how well the US has
achieved its production potential since 1960.
Follow the red line upward from 1960 and especially note how
much it lies above or below the black line. The red line
represents Real GDP per person. The black line represents the
actual potential of productive output per person.
Note that the red line rises above potential from 1960 to about
1970. The potential productive output per person was actually
rising at about 2.8% per year.
Since 1970 the red line is either on or well below the black line
(except for two minor rises). Real GDP per person has fallen
below the economy’s potential. It actually shows a growth rate
of only about 1.9% a year since 1970. This means that the
economy’s POTENTIAL GDP has fallen well below that of
1960.
If the economy had kept up with the 1960’s rate of growth in
production it would mean a cumulative effect (from 1960 to
2013) of about $406,000 added income/productivity per person.
This is one of the more compelling reasons behind the emphasis
on not just per capita (per person) Real GDP but also its
comparison to POTENTIAL GDP. Wouldn’t it have been nice to
have an extra $400,000 over a span of 40 years (1970-2010)?
That’s an extra $10,000 a year; serious added income.
Why Does Real GDP (levels of production and income) Increase
Positively Some Years And Then Become Negative In Other
Years?
The Business Cycle: this is a term used to describe fluctuations
in economic activity. In a sense, it measures the economic
growth during the expansion phase (more investment, more
jobs, more income, more growth) and the economic decline
during the contraction stage (less investment, fewer jobs, less
income, less spending). The goal for economists is to keep the
highs and lows of the economy to a bare minimum. Think of the
U.S. economy as running in a marathon – always trying to move
forward at a sustainable pace in a seemingly never-ending
journey. Obviously, going backward in a marathon is
undesirable as we are moving farther away from where we are
trying to get to – moving forward is the desired direction. But
it’s not just about moving forward – we want to move forward
at a relatively swift pace, not just walk (we’re better than that!).
However, a marathon needs to be run at a sustainable pace.
Trying to sprint a marathon is unsustainable and will lead to
over-exhaustion and ultimately slow us down in the long run. A
recession is going backwards in the marathon (with a negative
real GDP growth rate), while an expansion is moving forward in
the marathon (with a positive real GDP growth rate). A peak is
when we stop moving forward and start to go backward (turning
point between positive and negative), while a trough is when we
stop going backward and start moving forward again (turning
point between negative and positive).
Our goal is for a sustainable pace for expansion, which is
typically thought of as a real GDP growth rate of approximately
3 percent - that is the jogging pace at which the U.S. economy
has demonstrated it is capable of sustainably expanding.
Expanding more rapidly than that can only be done temporarily,
and trying to expand beyond that pace for an extended period
will lead to “overheating” in the economy (which leads to high
inflation and loss of purchasing power of the dollar in the US)
and an eventual backlash - a recession. Expanding less than that
level is not living up to our potential.
This also brings up the non-technical term of “
growth recession” – when the economy is growing (so it
can’t technically be in a recession), though growing so slowly
there will still be some recession-like characteristics (such as
rising or high unemployment). A growth recession is like
walking in the marathon. While growth recession is not defined
by the National Bureau of Economic Research (NBER) or
introduced in this textbook, it has grown in popularity in the
media as it sometimes serves as a useful description of the
seemingly “gray” area of the business cycle that is not a
recession, but not a healthy expansion either. Growth recession
sometimes precedes actual recession (a slowdown before GDP
growth ultimately turns negative – such as the tail end of the
expansions before the early 80s double-dip recession and the
2001 recession), follows a recession (GDP growth turns positive
but is still lower than a healthy rate – such as the recoveries
following 1990-1991, 2001, and 2007-2009 recessions), or in
the middle of an expansion (a slowdown that almost takes the
place of an actual recession – such as the soft patch in the mid-
90s).
Business cycles or economic fluctuations of the production
level in an economy are defined by 2 phases which have 2
corresponding turning points:
·
Expansion: The expansion phase is the period during
which real GDP is increasing.
·
Recession: The recession phase is commonly defined as
a period during which real GDP decreases for at least six
months, though the NBER has a broader definition.
·
Peak: A peak is the highest level of real GDP yet
attained. A peak is a turning point between an expansion and a
recession.
·
Trough: A trough is the temporary low-point in real
GDP. A trough is a turning point between a recession and an
expansion.
Let’s look at a picture of the US’s business cycles or
fluctuations from 2003 through September of to 2013 as seen in
Figure 14.4, and reproduced below:
It’s interesting to see the long period of expansion between
2003 to the latter part of 2007. For much of that period Real
GDP was actually greater than Potential GDP. The growth
period was so long that economists focused more on sustaining
even faster growth rather than looking at the warning signs of
the business cycle model that they had begun to ignore. Then in
2008 the bubble burst, reaching bottom or trough in 2009 but
since 2009 the expansion has been extremely slow, falling well
below Potential GDP.
This continued expansion, especially above the ‘potential’ GDP
line, illustrates an overheated economy – too much spending,
higher inflation rates, higher employment levels etc. The
economy in this situation will eventually correct itself falling
back to or a little below the ‘potential’ GDP line. In the 2008-
2009 case, however; Real GDP hit an almost record low. The
economy was then in a severe recession highlighted by little
spending or investment, high unemployment rate, severe
corrections in both the stock and real estate markets, etc.
Even though economists tend to avoid the word ‘cycle’ that’s
pretty much what you see when looking at Figure 14.4: slow
expansion then mild contraction over and over (cycle) until the
huge contraction in 2008-2009.
Explaining the Business Cycle
Economists tend to link business fluctuations to 3 main forces:
external factors, business investment, and government activity.
External Shocks
External events can cause or contribute to a fluctuation in the
US economy. World War II for instance (something occurring
outside the US economy) had a tremendous impact upon the US
economy. It turned a nation from a devastating economic
depression where 13 million people were unemployed,
productive output was down to 35% of the nation’s productive
capacity, and farm income down to 20% of its 1929 level, to a
nation of full employment and production that exceeded US
output at any other time. The demand for war supplies was so
great that factories operated on a 24-hour basis, employing all
able-bodied workers including women.
Business Investment
When businesses believe its future prospects for profit are
positive, they increase capital investment: buying new
machines, building new factories, expanding old ones etc. This
produces more jobs, more productivity, and more income. When
businesses expect poor future prospects from the US economy
as to create more profit, they will do the exact opposite of the
above which will decrease productivity, jobs, and income,
slowing down consumer spending.
Government Activity
The government’s changing economic policies may also
influence business fluctuations in the US economy. Raising or
lowering taxes or increasing or decreasing government
expenditures may have either a positive or negative effect upon
the economy.
PUTTING IT ALL TOGETHER: ECONOMIC FLUCTUATIONS
(ALSO CALLED THE BUSINESS CYCLE)
Everything we’ve discussed thus far in all modules both Micro
and Macro come together to define an economy as one that is
growing at an acceptable rate to one that is stagnant or even
contracting. These economic fluctuations are common to all
economies and, although sometimes termed business cycles,
there is no predictable pattern as to the up and down movement
of our economy’s growth over a period of time. What causes
these fluctuations is extremely difficult and cause for debate
among most economists. What occurs during the fluctuations is
easier to identify. I want to give you an oversimplified example
of an economic fluctuation from expansion to contraction. This
is a model only, but it does reflect some degree what occurs
during one cycle:
1. Assume you are a retailer selling casual and dress shoes. At
the moment, your sales are fairly stagnant, so for every pair of
shoes on the sales’ floor, you have one pair of shoes in
inventory. There are plenty of people who want to purchase a
pair of shoes for you, but most of them just don’t have the
disposable income necessary to do so
2. Now, assume that there is an increase in economic activity.
Christmas is a few months away, and many part-time positions
are being filled by people who had been unemployed.
3. Now that more people are employed, there is more money in
the hands of consumers. Many of them now have the ability to
purchase a pair of shoes from you.
4. When demand initially increases for your product, you’re
caught short of inventory, so you order more from the
manufacturer. You now need five pairs of shoes in inventory for
every one pair you have on the retail floor.
5. The manufacturer, fairly idle until now, is caught short, so he
hires more labor and purchases more resources to accommodate
this new demand.
6. The new labor means people are making even more money
and therefore spending more, creating even more shortages. The
economy is now booming with rapid growth.
7. Eventually, the manufacturer and retailers catch up to the
demand and possess the number of inventories and labor that
they need to satisfy consumer demand.
8. Once this new demand is satisfied, however, retailers find
they have too much inventory. So they cut back on their demand
for manufactured products. Orders drop at the same rate as
when they went up.
9. Because of the decrease in orders, manufacturers begin laying
off labor, meaning fewer incomes, meaning less demand
(purchases) for your product.
10. The retailers feel this decrease in demand and stop ordering
from the manufacturer altogether.
11. Plants close down and all workers are laid off.
12. This creates another drop in demand for retailers who lay
off all of their workers before going out of business altogether.
The economy is now in recession
FACTS ABOUT ECONOMIC FLUCTUATIONS
The above gives you a broad idea of what takes place during
economic fluctuations, and how an economy might go from
boom to bust over an extended period of time. Since we know
that these fluctuations will always occur, the goal for any
economy is to keep both the expansions and the contractions at
a minimum level. We also would like to see expansions occur
over long periods of time while minimizing the period of time
for the contractions. As much controversy as there is about
causes and remedies for business fluctuations, there are a few
facts which always hold true about them:
1. As I stated before, they are unpredictable. Remember that
‘Real’ GDP is the value of all final goods and services produced
in our economy. That means we may use measurements of
‘Real’ GDP to determine the level of our economy’s activity.
2. As ‘Real’ GDP falls into recession so does investment
spending. If corporations and businesses discontinue
investment, profits will fall, as will spending by consumers,
which foreshadow decreases in sales across the economic
spectrum: retail, cars, homes etc. Decreases in sales and profits
for corporations and businesses leads to;
3. Layoffs and high unemployment levels. Notice this rippling
effect throughout the entire economy. Using only the housing
industry as an example, look at the tremendous number of
people affected by layoffs because of a recession: the producers
of wood, cement, and other materials used in housing
construction as well as the tremendous number of foundation
layers, carpenters, window installers, floor tilers, plumbers,
electricians etc. In 2008-2009, the combination of failures by
major banks, corporations, automobile manufacturers, and the
housing industry drove the U.S. into its most devastating and
serious recession since the Great Depression of the 1930’s.
Does Real GDP Give an Accurate Measure of an Economy’s
Standard of Living?
If you look back on pg. 46, Figure 2.3 you’ll see that the
average income per person per day in the US outranks all other
countries. Income per person per day in the US is 3x that of
Russia and 6x that of China. Using a common factor to compare
incomes we also see some startling results of income disparities
among countries. While we in the US enjoy a per person income
of over $125 per day, 66% of the world’s population which is
Africa earn a per person income of less than $2 per day.
Limitations of Real GDP Measurements
Remember that Real GDP measures the value of goods and
services that are bought and sold in the marketplace. But what
about those goods or services that are not sold in the
marketplace?
Household Production
It sometimes seems rather ironic that a stay-at-home Mom (or
Dad) has no value when it comes to Real GDP because their
services (raising children, cooking meals, shopping etc.) are not
for sale in the marketplace. In the late 20th and now 21st
century in the US, some of this has begun to change primarily
because of the increase in the number of women in the
workforce. Now that many women no longer stay at home they
purchase child care services on the open market and rely more
and more upon fast foods for their families because they no
longer have the time to prepare meals at home.
Illegal or Underground Production
Almost any good or service deemed illegal in the US can be
purchased in the illegal underground market. The most notable
of these is the sale of illegal prescription and non-prescription
drugs. It also includes prostitution, sales of restricted firearms,
pornography, unlicensed gambling etc. Added to these are the
unreported tips by food servers, hairdressers, and cab drivers as
well as unreported income of illegal immigrants. As state in
your text, the estimated total of unreported underground
production not included in GDP makes up 16% of GDP (early
1990’s figure). This, of course, is just an educated guess based
upon the number of people caught engaging in these enterprises.
The figure may actually be quite higher since people involved
in illegal activities will not report their activities to the
authorities.
Leisure Time
It’s very difficult to put a monetary value on leisure time unless
you calculate the opportunity cost in $ of the money you could
be making during your leisure time. This would be a legitimate
figure for a $ amount value of our leisure time but is not
included in GDP.
Levels of Happiness
Happiness is not only a difficult term to define (happiness for
one person may be totally different for another) but almost
impossible to assign a monetary value. There is a picture of a
family from a mountainous region in India and all of their
belongings compared to a picture of an upper-middle-class
family in the US and all of their belongings. The family from
India possesses the bare essentials: an adobe one-room structure
for housing; a mule for transportation; two sets of clothing
(warm weather and cold weather); pots and pans; and bedding.
The family from the US has much more than the essentials: a 2-
story 4-bedroom house; garage with two cars; three computers;
4 cell phones and so on. The interesting thing about the picture
is that it was part of a study done to determine levels of
happiness. The study found that as long as the basic necessities
of life were included, the family with the least possessions was
the happiest. If anything, it’s an interesting concept that the
more material goods you possess the less happy you may be.
Again, this is just one opinion and using the word ‘happiness’
as a measurable quality makes it fairly subjective.
image1.png
image2.png
image3.png
MACROECONOMICS MODULE 2 HOMEWORK
ASSIGNMENT (CH. 14B pp. 383-390)
Figure 14.3
1. Referring to Figure 14.3 above, explain what is occurring in
the years 2008-2010 and then in 2005-2007 in terms of real
GDP and potential.
2. From 2010 onward it appears that US real GDP is recovering.
After referring to Figure 14.3 once again, what conclusion
might you make about this recovery especially in terms of
potential GDP?
3. How would you define a ‘recession’?
4. Explain why economists termed the period following 1991 as
the
Great Moderation.
5. Real GDP does not include all goods and services produced.
Explain.
6. The United Nations has constructed a Human Development
Index (HDI). What does this index measure?
7. Where does the United States rank using the United Nation’s
HDI?
8. Why isn’t the US ranked highest since it has one of the
highest GDP’s per person in the world?
9. If GDP increased and the unemployment rate decreased, what
phase of the business cycle would you assume the economy is
in?
10. When exactly do economists say that an economic expansion
ends and a recession begins? When does a recession end?
11. Robert Kennedy, when seeking the Democratic presidential
nomination in 1968, remarked that GDP measures everything
except that which makes life worthwhile. What do you think he
meant by this statement? What do you think he feels is missing
when measuring GDP.
12. Do you feel that economists are guilty of discrimination
when they don’t count the long hours a stay at home mother or
father spends raising a family?
13. Table 14.4 in your text (pg. 383) compares real GDP per
person in the US between 1960 and 2016. This shows real GDP
per person in 2013 at almost 3 times that of 1960. Does that
mean that people in the US are 3 times happier in 2013 as
compared to 1960?
14. During the 1960’s the potential growth rate of GDP grew at
an average of 20.8% per year. Since 1970 though, the growth
rate of a potential of GDP has been about 1.9% a year (pg. 383
bottoms). Using this as a gauge explain why you think the US
economy is either better or worse off today than it was 50 years
ago.
15. If underground production esp. the production and sale of
illegal drugs were counted in GDP, it would have made up about
16% of GDP; a huge amount. Explain why you feel that
economists and the government do not count these goods as part
of GDP.
16. Even though the per person real GDP in the US is among the
highest in the world, explain why you feel that this may be
misleading in terms of the quality of life for individuals in the
US (think leisure, environment, health, social justice etc.).
image1.png

More Related Content

Similar to Module 2 Lecture - GDP A Measure Of Total Production And Income (.docx

Mr. Wood Block 1 slideshow
Mr. Wood Block 1 slideshowMr. Wood Block 1 slideshow
Mr. Wood Block 1 slideshowdoritrenter
 
CU M Com-MEBE-MOD-1-National Income Accounting-Lecture-1
CU M Com-MEBE-MOD-1-National Income Accounting-Lecture-1CU M Com-MEBE-MOD-1-National Income Accounting-Lecture-1
CU M Com-MEBE-MOD-1-National Income Accounting-Lecture-1
Dr. Subir Maitra
 
Factors economic growth
Factors economic growthFactors economic growth
Factors economic growthMastro Mecjh
 
Skirting the Abyss: From Economic Downturn to Financial Crisis to Long-term M...
Skirting the Abyss: From Economic Downturn to Financial Crisis to Long-term M...Skirting the Abyss: From Economic Downturn to Financial Crisis to Long-term M...
Skirting the Abyss: From Economic Downturn to Financial Crisis to Long-term M...
Llinlithgow Associates
 
Blackwall partners 2 qtr 2016- transient volatility part iii
Blackwall partners  2 qtr 2016- transient volatility part iiiBlackwall partners  2 qtr 2016- transient volatility part iii
Blackwall partners 2 qtr 2016- transient volatility part iii
Michael Durante
 
Business cycle
Business cycleBusiness cycle
Business cycle
MehulChaudhary9
 
The Super-Cycle Report
The Super-Cycle ReportThe Super-Cycle Report
The Super-Cycle Report
Ufuk Kılıç
 
Lifting the small boats
Lifting the small boatsLifting the small boats
Lifting the small boats
ananto widodo
 
Economic Growth
Economic GrowthEconomic Growth
Economic Growth
Lumen Learning
 
Macroeconomics Policies
Macroeconomics PoliciesMacroeconomics Policies
Macroeconomics Policiescrrcaz
 
Chapter 23 Lecture Presentation.ppt macro economics
Chapter 23 Lecture Presentation.ppt macro economicsChapter 23 Lecture Presentation.ppt macro economics
Chapter 23 Lecture Presentation.ppt macro economics
PinkyRose31
 
Unempolyment in india
Unempolyment in indiaUnempolyment in india
Unempolyment in india
Priya Gupta
 
Quoted_11_February 2015
Quoted_11_February 2015Quoted_11_February 2015
Quoted_11_February 2015Colin Bramble
 
Economic Volatility: How Covid-19 is Affecting Our Communities
Economic Volatility: How Covid-19 is Affecting Our CommunitiesEconomic Volatility: How Covid-19 is Affecting Our Communities
Economic Volatility: How Covid-19 is Affecting Our Communities
NicolasMontenegro13
 
Les réflexions de comptoir 2 - Oct2016
Les réflexions de comptoir   2 - Oct2016Les réflexions de comptoir   2 - Oct2016
Les réflexions de comptoir 2 - Oct2016
Tristan Abet
 
Q4_2015_2016_Outlook
Q4_2015_2016_OutlookQ4_2015_2016_Outlook
Q4_2015_2016_OutlookDebi Myers
 

Similar to Module 2 Lecture - GDP A Measure Of Total Production And Income (.docx (17)

Mr. Wood Block 1 slideshow
Mr. Wood Block 1 slideshowMr. Wood Block 1 slideshow
Mr. Wood Block 1 slideshow
 
CU M Com-MEBE-MOD-1-National Income Accounting-Lecture-1
CU M Com-MEBE-MOD-1-National Income Accounting-Lecture-1CU M Com-MEBE-MOD-1-National Income Accounting-Lecture-1
CU M Com-MEBE-MOD-1-National Income Accounting-Lecture-1
 
Factors economic growth
Factors economic growthFactors economic growth
Factors economic growth
 
Skirting the Abyss: From Economic Downturn to Financial Crisis to Long-term M...
Skirting the Abyss: From Economic Downturn to Financial Crisis to Long-term M...Skirting the Abyss: From Economic Downturn to Financial Crisis to Long-term M...
Skirting the Abyss: From Economic Downturn to Financial Crisis to Long-term M...
 
Ch04 7e
Ch04 7eCh04 7e
Ch04 7e
 
Blackwall partners 2 qtr 2016- transient volatility part iii
Blackwall partners  2 qtr 2016- transient volatility part iiiBlackwall partners  2 qtr 2016- transient volatility part iii
Blackwall partners 2 qtr 2016- transient volatility part iii
 
Business cycle
Business cycleBusiness cycle
Business cycle
 
The Super-Cycle Report
The Super-Cycle ReportThe Super-Cycle Report
The Super-Cycle Report
 
Lifting the small boats
Lifting the small boatsLifting the small boats
Lifting the small boats
 
Economic Growth
Economic GrowthEconomic Growth
Economic Growth
 
Macroeconomics Policies
Macroeconomics PoliciesMacroeconomics Policies
Macroeconomics Policies
 
Chapter 23 Lecture Presentation.ppt macro economics
Chapter 23 Lecture Presentation.ppt macro economicsChapter 23 Lecture Presentation.ppt macro economics
Chapter 23 Lecture Presentation.ppt macro economics
 
Unempolyment in india
Unempolyment in indiaUnempolyment in india
Unempolyment in india
 
Quoted_11_February 2015
Quoted_11_February 2015Quoted_11_February 2015
Quoted_11_February 2015
 
Economic Volatility: How Covid-19 is Affecting Our Communities
Economic Volatility: How Covid-19 is Affecting Our CommunitiesEconomic Volatility: How Covid-19 is Affecting Our Communities
Economic Volatility: How Covid-19 is Affecting Our Communities
 
Les réflexions de comptoir 2 - Oct2016
Les réflexions de comptoir   2 - Oct2016Les réflexions de comptoir   2 - Oct2016
Les réflexions de comptoir 2 - Oct2016
 
Q4_2015_2016_Outlook
Q4_2015_2016_OutlookQ4_2015_2016_Outlook
Q4_2015_2016_Outlook
 

More from kendalfarrier

Explain your current understanding of effective assessment practic.docx
Explain your current understanding of effective assessment practic.docxExplain your current understanding of effective assessment practic.docx
Explain your current understanding of effective assessment practic.docx
kendalfarrier
 
Explain why this would be a more appropriate classification than oth.docx
Explain why this would be a more appropriate classification than oth.docxExplain why this would be a more appropriate classification than oth.docx
Explain why this would be a more appropriate classification than oth.docx
kendalfarrier
 
Explain why whistle-blowing is important to encourage in a firm. P.docx
Explain why whistle-blowing is important to encourage in a firm. P.docxExplain why whistle-blowing is important to encourage in a firm. P.docx
Explain why whistle-blowing is important to encourage in a firm. P.docx
kendalfarrier
 
Explain why the Fourth Amendment applies to use of force by a police.docx
Explain why the Fourth Amendment applies to use of force by a police.docxExplain why the Fourth Amendment applies to use of force by a police.docx
Explain why the Fourth Amendment applies to use of force by a police.docx
kendalfarrier
 
Explain why there are two types of legal systems in the United State.docx
Explain why there are two types of legal systems in the United State.docxExplain why there are two types of legal systems in the United State.docx
Explain why there are two types of legal systems in the United State.docx
kendalfarrier
 
Explain why some organizations are accepting and other organizations.docx
Explain why some organizations are accepting and other organizations.docxExplain why some organizations are accepting and other organizations.docx
Explain why some organizations are accepting and other organizations.docx
kendalfarrier
 
Explain why relativism and egoism pose a challenge to the possib.docx
Explain why relativism and egoism pose a challenge to the possib.docxExplain why relativism and egoism pose a challenge to the possib.docx
Explain why relativism and egoism pose a challenge to the possib.docx
kendalfarrier
 
Explain which steps of intelligence collection and counterterrorism .docx
Explain which steps of intelligence collection and counterterrorism .docxExplain which steps of intelligence collection and counterterrorism .docx
Explain which steps of intelligence collection and counterterrorism .docx
kendalfarrier
 
Explain which HRIS types your current or previous employer uti.docx
Explain which HRIS types your current or previous employer uti.docxExplain which HRIS types your current or previous employer uti.docx
Explain which HRIS types your current or previous employer uti.docx
kendalfarrier
 
Explain whether you believe it is U.S. consumers or policy makers wh.docx
Explain whether you believe it is U.S. consumers or policy makers wh.docxExplain whether you believe it is U.S. consumers or policy makers wh.docx
Explain whether you believe it is U.S. consumers or policy makers wh.docx
kendalfarrier
 
Explain whether psychotherapy has a biological basis. Explain how cu.docx
Explain whether psychotherapy has a biological basis. Explain how cu.docxExplain whether psychotherapy has a biological basis. Explain how cu.docx
Explain whether psychotherapy has a biological basis. Explain how cu.docx
kendalfarrier
 
Explain what the textbook author says about each theme present. Pr.docx
Explain what the textbook author says about each theme present. Pr.docxExplain what the textbook author says about each theme present. Pr.docx
Explain what the textbook author says about each theme present. Pr.docx
kendalfarrier
 
Explain what should qualify as global leadership considering the dep.docx
Explain what should qualify as global leadership considering the dep.docxExplain what should qualify as global leadership considering the dep.docx
Explain what should qualify as global leadership considering the dep.docx
kendalfarrier
 
Explain what is mean by media planning and how advertisers decide .docx
Explain what is mean by media planning and how advertisers decide .docxExplain what is mean by media planning and how advertisers decide .docx
Explain what is mean by media planning and how advertisers decide .docx
kendalfarrier
 
Explain what communication barriers are, then describe a situation t.docx
Explain what communication barriers are, then describe a situation t.docxExplain what communication barriers are, then describe a situation t.docx
Explain what communication barriers are, then describe a situation t.docx
kendalfarrier
 
Explain what areas a forensic psychology professional may like.docx
Explain what areas a forensic psychology professional may like.docxExplain what areas a forensic psychology professional may like.docx
Explain what areas a forensic psychology professional may like.docx
kendalfarrier
 
Explain two major differences between common-sense understandings an.docx
Explain two major differences between common-sense understandings an.docxExplain two major differences between common-sense understandings an.docx
Explain two major differences between common-sense understandings an.docx
kendalfarrier
 
Explain three forces leading companies to pursue international ope.docx
Explain three forces leading companies to pursue international ope.docxExplain three forces leading companies to pursue international ope.docx
Explain three forces leading companies to pursue international ope.docx
kendalfarrier
 
Explain the various forms of social engineering tactics that hackers.docx
Explain the various forms of social engineering tactics that hackers.docxExplain the various forms of social engineering tactics that hackers.docx
Explain the various forms of social engineering tactics that hackers.docx
kendalfarrier
 
Explain the two major types of bias. Identify a peer-reviewed epidem.docx
Explain the two major types of bias. Identify a peer-reviewed epidem.docxExplain the two major types of bias. Identify a peer-reviewed epidem.docx
Explain the two major types of bias. Identify a peer-reviewed epidem.docx
kendalfarrier
 

More from kendalfarrier (20)

Explain your current understanding of effective assessment practic.docx
Explain your current understanding of effective assessment practic.docxExplain your current understanding of effective assessment practic.docx
Explain your current understanding of effective assessment practic.docx
 
Explain why this would be a more appropriate classification than oth.docx
Explain why this would be a more appropriate classification than oth.docxExplain why this would be a more appropriate classification than oth.docx
Explain why this would be a more appropriate classification than oth.docx
 
Explain why whistle-blowing is important to encourage in a firm. P.docx
Explain why whistle-blowing is important to encourage in a firm. P.docxExplain why whistle-blowing is important to encourage in a firm. P.docx
Explain why whistle-blowing is important to encourage in a firm. P.docx
 
Explain why the Fourth Amendment applies to use of force by a police.docx
Explain why the Fourth Amendment applies to use of force by a police.docxExplain why the Fourth Amendment applies to use of force by a police.docx
Explain why the Fourth Amendment applies to use of force by a police.docx
 
Explain why there are two types of legal systems in the United State.docx
Explain why there are two types of legal systems in the United State.docxExplain why there are two types of legal systems in the United State.docx
Explain why there are two types of legal systems in the United State.docx
 
Explain why some organizations are accepting and other organizations.docx
Explain why some organizations are accepting and other organizations.docxExplain why some organizations are accepting and other organizations.docx
Explain why some organizations are accepting and other organizations.docx
 
Explain why relativism and egoism pose a challenge to the possib.docx
Explain why relativism and egoism pose a challenge to the possib.docxExplain why relativism and egoism pose a challenge to the possib.docx
Explain why relativism and egoism pose a challenge to the possib.docx
 
Explain which steps of intelligence collection and counterterrorism .docx
Explain which steps of intelligence collection and counterterrorism .docxExplain which steps of intelligence collection and counterterrorism .docx
Explain which steps of intelligence collection and counterterrorism .docx
 
Explain which HRIS types your current or previous employer uti.docx
Explain which HRIS types your current or previous employer uti.docxExplain which HRIS types your current or previous employer uti.docx
Explain which HRIS types your current or previous employer uti.docx
 
Explain whether you believe it is U.S. consumers or policy makers wh.docx
Explain whether you believe it is U.S. consumers or policy makers wh.docxExplain whether you believe it is U.S. consumers or policy makers wh.docx
Explain whether you believe it is U.S. consumers or policy makers wh.docx
 
Explain whether psychotherapy has a biological basis. Explain how cu.docx
Explain whether psychotherapy has a biological basis. Explain how cu.docxExplain whether psychotherapy has a biological basis. Explain how cu.docx
Explain whether psychotherapy has a biological basis. Explain how cu.docx
 
Explain what the textbook author says about each theme present. Pr.docx
Explain what the textbook author says about each theme present. Pr.docxExplain what the textbook author says about each theme present. Pr.docx
Explain what the textbook author says about each theme present. Pr.docx
 
Explain what should qualify as global leadership considering the dep.docx
Explain what should qualify as global leadership considering the dep.docxExplain what should qualify as global leadership considering the dep.docx
Explain what should qualify as global leadership considering the dep.docx
 
Explain what is mean by media planning and how advertisers decide .docx
Explain what is mean by media planning and how advertisers decide .docxExplain what is mean by media planning and how advertisers decide .docx
Explain what is mean by media planning and how advertisers decide .docx
 
Explain what communication barriers are, then describe a situation t.docx
Explain what communication barriers are, then describe a situation t.docxExplain what communication barriers are, then describe a situation t.docx
Explain what communication barriers are, then describe a situation t.docx
 
Explain what areas a forensic psychology professional may like.docx
Explain what areas a forensic psychology professional may like.docxExplain what areas a forensic psychology professional may like.docx
Explain what areas a forensic psychology professional may like.docx
 
Explain two major differences between common-sense understandings an.docx
Explain two major differences between common-sense understandings an.docxExplain two major differences between common-sense understandings an.docx
Explain two major differences between common-sense understandings an.docx
 
Explain three forces leading companies to pursue international ope.docx
Explain three forces leading companies to pursue international ope.docxExplain three forces leading companies to pursue international ope.docx
Explain three forces leading companies to pursue international ope.docx
 
Explain the various forms of social engineering tactics that hackers.docx
Explain the various forms of social engineering tactics that hackers.docxExplain the various forms of social engineering tactics that hackers.docx
Explain the various forms of social engineering tactics that hackers.docx
 
Explain the two major types of bias. Identify a peer-reviewed epidem.docx
Explain the two major types of bias. Identify a peer-reviewed epidem.docxExplain the two major types of bias. Identify a peer-reviewed epidem.docx
Explain the two major types of bias. Identify a peer-reviewed epidem.docx
 

Recently uploaded

The Challenger.pdf DNHS Official Publication
The Challenger.pdf DNHS Official PublicationThe Challenger.pdf DNHS Official Publication
The Challenger.pdf DNHS Official Publication
Delapenabediema
 
Welcome to TechSoup New Member Orientation and Q&A (May 2024).pdf
Welcome to TechSoup   New Member Orientation and Q&A (May 2024).pdfWelcome to TechSoup   New Member Orientation and Q&A (May 2024).pdf
Welcome to TechSoup New Member Orientation and Q&A (May 2024).pdf
TechSoup
 
CACJapan - GROUP Presentation 1- Wk 4.pdf
CACJapan - GROUP Presentation 1- Wk 4.pdfCACJapan - GROUP Presentation 1- Wk 4.pdf
CACJapan - GROUP Presentation 1- Wk 4.pdf
camakaiclarkmusic
 
Honest Reviews of Tim Han LMA Course Program.pptx
Honest Reviews of Tim Han LMA Course Program.pptxHonest Reviews of Tim Han LMA Course Program.pptx
Honest Reviews of Tim Han LMA Course Program.pptx
timhan337
 
Home assignment II on Spectroscopy 2024 Answers.pdf
Home assignment II on Spectroscopy 2024 Answers.pdfHome assignment II on Spectroscopy 2024 Answers.pdf
Home assignment II on Spectroscopy 2024 Answers.pdf
Tamralipta Mahavidyalaya
 
Overview on Edible Vaccine: Pros & Cons with Mechanism
Overview on Edible Vaccine: Pros & Cons with MechanismOverview on Edible Vaccine: Pros & Cons with Mechanism
Overview on Edible Vaccine: Pros & Cons with Mechanism
DeeptiGupta154
 
special B.ed 2nd year old paper_20240531.pdf
special B.ed 2nd year old paper_20240531.pdfspecial B.ed 2nd year old paper_20240531.pdf
special B.ed 2nd year old paper_20240531.pdf
Special education needs
 
The Roman Empire A Historical Colossus.pdf
The Roman Empire A Historical Colossus.pdfThe Roman Empire A Historical Colossus.pdf
The Roman Empire A Historical Colossus.pdf
kaushalkr1407
 
Mule 4.6 & Java 17 Upgrade | MuleSoft Mysore Meetup #46
Mule 4.6 & Java 17 Upgrade | MuleSoft Mysore Meetup #46Mule 4.6 & Java 17 Upgrade | MuleSoft Mysore Meetup #46
Mule 4.6 & Java 17 Upgrade | MuleSoft Mysore Meetup #46
MysoreMuleSoftMeetup
 
June 3, 2024 Anti-Semitism Letter Sent to MIT President Kornbluth and MIT Cor...
June 3, 2024 Anti-Semitism Letter Sent to MIT President Kornbluth and MIT Cor...June 3, 2024 Anti-Semitism Letter Sent to MIT President Kornbluth and MIT Cor...
June 3, 2024 Anti-Semitism Letter Sent to MIT President Kornbluth and MIT Cor...
Levi Shapiro
 
aaaaaaaaaaaaaaaaaaaaaaaaaaaaaaaaaaaaaaaaa
aaaaaaaaaaaaaaaaaaaaaaaaaaaaaaaaaaaaaaaaaaaaaaaaaaaaaaaaaaaaaaaaaaaaaaaaaaaaaaaaaa
aaaaaaaaaaaaaaaaaaaaaaaaaaaaaaaaaaaaaaaaa
siemaillard
 
Introduction to AI for Nonprofits with Tapp Network
Introduction to AI for Nonprofits with Tapp NetworkIntroduction to AI for Nonprofits with Tapp Network
Introduction to AI for Nonprofits with Tapp Network
TechSoup
 
CLASS 11 CBSE B.St Project AIDS TO TRADE - INSURANCE
CLASS 11 CBSE B.St Project AIDS TO TRADE - INSURANCECLASS 11 CBSE B.St Project AIDS TO TRADE - INSURANCE
CLASS 11 CBSE B.St Project AIDS TO TRADE - INSURANCE
BhavyaRajput3
 
Model Attribute Check Company Auto Property
Model Attribute  Check Company Auto PropertyModel Attribute  Check Company Auto Property
Model Attribute Check Company Auto Property
Celine George
 
Supporting (UKRI) OA monographs at Salford.pptx
Supporting (UKRI) OA monographs at Salford.pptxSupporting (UKRI) OA monographs at Salford.pptx
Supporting (UKRI) OA monographs at Salford.pptx
Jisc
 
Phrasal Verbs.XXXXXXXXXXXXXXXXXXXXXXXXXX
Phrasal Verbs.XXXXXXXXXXXXXXXXXXXXXXXXXXPhrasal Verbs.XXXXXXXXXXXXXXXXXXXXXXXXXX
Phrasal Verbs.XXXXXXXXXXXXXXXXXXXXXXXXXX
MIRIAMSALINAS13
 
2024.06.01 Introducing a competency framework for languag learning materials ...
2024.06.01 Introducing a competency framework for languag learning materials ...2024.06.01 Introducing a competency framework for languag learning materials ...
2024.06.01 Introducing a competency framework for languag learning materials ...
Sandy Millin
 
678020731-Sumas-y-Restas-Para-Colorear.pdf
678020731-Sumas-y-Restas-Para-Colorear.pdf678020731-Sumas-y-Restas-Para-Colorear.pdf
678020731-Sumas-y-Restas-Para-Colorear.pdf
CarlosHernanMontoyab2
 
The Accursed House by Émile Gaboriau.pptx
The Accursed House by Émile Gaboriau.pptxThe Accursed House by Émile Gaboriau.pptx
The Accursed House by Émile Gaboriau.pptx
DhatriParmar
 
Biological Screening of Herbal Drugs in detailed.
Biological Screening of Herbal Drugs in detailed.Biological Screening of Herbal Drugs in detailed.
Biological Screening of Herbal Drugs in detailed.
Ashokrao Mane college of Pharmacy Peth-Vadgaon
 

Recently uploaded (20)

The Challenger.pdf DNHS Official Publication
The Challenger.pdf DNHS Official PublicationThe Challenger.pdf DNHS Official Publication
The Challenger.pdf DNHS Official Publication
 
Welcome to TechSoup New Member Orientation and Q&A (May 2024).pdf
Welcome to TechSoup   New Member Orientation and Q&A (May 2024).pdfWelcome to TechSoup   New Member Orientation and Q&A (May 2024).pdf
Welcome to TechSoup New Member Orientation and Q&A (May 2024).pdf
 
CACJapan - GROUP Presentation 1- Wk 4.pdf
CACJapan - GROUP Presentation 1- Wk 4.pdfCACJapan - GROUP Presentation 1- Wk 4.pdf
CACJapan - GROUP Presentation 1- Wk 4.pdf
 
Honest Reviews of Tim Han LMA Course Program.pptx
Honest Reviews of Tim Han LMA Course Program.pptxHonest Reviews of Tim Han LMA Course Program.pptx
Honest Reviews of Tim Han LMA Course Program.pptx
 
Home assignment II on Spectroscopy 2024 Answers.pdf
Home assignment II on Spectroscopy 2024 Answers.pdfHome assignment II on Spectroscopy 2024 Answers.pdf
Home assignment II on Spectroscopy 2024 Answers.pdf
 
Overview on Edible Vaccine: Pros & Cons with Mechanism
Overview on Edible Vaccine: Pros & Cons with MechanismOverview on Edible Vaccine: Pros & Cons with Mechanism
Overview on Edible Vaccine: Pros & Cons with Mechanism
 
special B.ed 2nd year old paper_20240531.pdf
special B.ed 2nd year old paper_20240531.pdfspecial B.ed 2nd year old paper_20240531.pdf
special B.ed 2nd year old paper_20240531.pdf
 
The Roman Empire A Historical Colossus.pdf
The Roman Empire A Historical Colossus.pdfThe Roman Empire A Historical Colossus.pdf
The Roman Empire A Historical Colossus.pdf
 
Mule 4.6 & Java 17 Upgrade | MuleSoft Mysore Meetup #46
Mule 4.6 & Java 17 Upgrade | MuleSoft Mysore Meetup #46Mule 4.6 & Java 17 Upgrade | MuleSoft Mysore Meetup #46
Mule 4.6 & Java 17 Upgrade | MuleSoft Mysore Meetup #46
 
June 3, 2024 Anti-Semitism Letter Sent to MIT President Kornbluth and MIT Cor...
June 3, 2024 Anti-Semitism Letter Sent to MIT President Kornbluth and MIT Cor...June 3, 2024 Anti-Semitism Letter Sent to MIT President Kornbluth and MIT Cor...
June 3, 2024 Anti-Semitism Letter Sent to MIT President Kornbluth and MIT Cor...
 
aaaaaaaaaaaaaaaaaaaaaaaaaaaaaaaaaaaaaaaaa
aaaaaaaaaaaaaaaaaaaaaaaaaaaaaaaaaaaaaaaaaaaaaaaaaaaaaaaaaaaaaaaaaaaaaaaaaaaaaaaaaa
aaaaaaaaaaaaaaaaaaaaaaaaaaaaaaaaaaaaaaaaa
 
Introduction to AI for Nonprofits with Tapp Network
Introduction to AI for Nonprofits with Tapp NetworkIntroduction to AI for Nonprofits with Tapp Network
Introduction to AI for Nonprofits with Tapp Network
 
CLASS 11 CBSE B.St Project AIDS TO TRADE - INSURANCE
CLASS 11 CBSE B.St Project AIDS TO TRADE - INSURANCECLASS 11 CBSE B.St Project AIDS TO TRADE - INSURANCE
CLASS 11 CBSE B.St Project AIDS TO TRADE - INSURANCE
 
Model Attribute Check Company Auto Property
Model Attribute  Check Company Auto PropertyModel Attribute  Check Company Auto Property
Model Attribute Check Company Auto Property
 
Supporting (UKRI) OA monographs at Salford.pptx
Supporting (UKRI) OA monographs at Salford.pptxSupporting (UKRI) OA monographs at Salford.pptx
Supporting (UKRI) OA monographs at Salford.pptx
 
Phrasal Verbs.XXXXXXXXXXXXXXXXXXXXXXXXXX
Phrasal Verbs.XXXXXXXXXXXXXXXXXXXXXXXXXXPhrasal Verbs.XXXXXXXXXXXXXXXXXXXXXXXXXX
Phrasal Verbs.XXXXXXXXXXXXXXXXXXXXXXXXXX
 
2024.06.01 Introducing a competency framework for languag learning materials ...
2024.06.01 Introducing a competency framework for languag learning materials ...2024.06.01 Introducing a competency framework for languag learning materials ...
2024.06.01 Introducing a competency framework for languag learning materials ...
 
678020731-Sumas-y-Restas-Para-Colorear.pdf
678020731-Sumas-y-Restas-Para-Colorear.pdf678020731-Sumas-y-Restas-Para-Colorear.pdf
678020731-Sumas-y-Restas-Para-Colorear.pdf
 
The Accursed House by Émile Gaboriau.pptx
The Accursed House by Émile Gaboriau.pptxThe Accursed House by Émile Gaboriau.pptx
The Accursed House by Émile Gaboriau.pptx
 
Biological Screening of Herbal Drugs in detailed.
Biological Screening of Herbal Drugs in detailed.Biological Screening of Herbal Drugs in detailed.
Biological Screening of Herbal Drugs in detailed.
 

Module 2 Lecture - GDP A Measure Of Total Production And Income (.docx

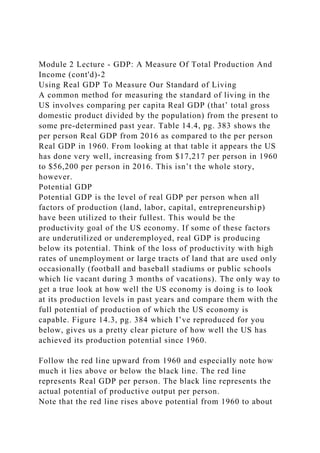
  • 1. Module 2 Lecture - GDP: A Measure Of Total Production And Income (cont'd)-2 Using Real GDP To Measure Our Standard of Living A common method for measuring the standard of living in the US involves comparing per capita Real GDP (that’ total gross domestic product divided by the population) from the present to some pre-determined past year. Table 14.4, pg. 383 shows the per person Real GDP from 2016 as compared to the per person Real GDP in 1960. From looking at that table it appears the US has done very well, increasing from $17,217 per person in 1960 to $56,200 per person in 2016. This isn’t the whole story, however. Potential GDP Potential GDP is the level of real GDP per person when all factors of production (land, labor, capital, entrepreneurship) have been utilized to their fullest. This would be the productivity goal of the US economy. If some of these factors are underutilized or underemployed, real GDP is producing below its potential. Think of the loss of productivity with high rates of unemployment or large tracts of land that are used only occasionally (football and baseball stadiums or public schools which lie vacant during 3 months of vacations). The only way to get a true look at how well the US economy is doing is to look at its production levels in past years and compare them with the full potential of production of which the US economy is capable. Figure 14.3, pg. 384 which I’ve reproduced for you below, gives us a pretty clear picture of how well the US has achieved its production potential since 1960. Follow the red line upward from 1960 and especially note how much it lies above or below the black line. The red line represents Real GDP per person. The black line represents the actual potential of productive output per person. Note that the red line rises above potential from 1960 to about
  • 2. 1970. The potential productive output per person was actually rising at about 2.8% per year. Since 1970 the red line is either on or well below the black line (except for two minor rises). Real GDP per person has fallen below the economy’s potential. It actually shows a growth rate of only about 1.9% a year since 1970. This means that the economy’s POTENTIAL GDP has fallen well below that of 1960. If the economy had kept up with the 1960’s rate of growth in production it would mean a cumulative effect (from 1960 to 2013) of about $406,000 added income/productivity per person. This is one of the more compelling reasons behind the emphasis on not just per capita (per person) Real GDP but also its comparison to POTENTIAL GDP. Wouldn’t it have been nice to have an extra $400,000 over a span of 40 years (1970-2010)? That’s an extra $10,000 a year; serious added income. Why Does Real GDP (levels of production and income) Increase Positively Some Years And Then Become Negative In Other Years? The Business Cycle: this is a term used to describe fluctuations in economic activity. In a sense, it measures the economic growth during the expansion phase (more investment, more jobs, more income, more growth) and the economic decline during the contraction stage (less investment, fewer jobs, less income, less spending). The goal for economists is to keep the highs and lows of the economy to a bare minimum. Think of the U.S. economy as running in a marathon – always trying to move forward at a sustainable pace in a seemingly never-ending journey. Obviously, going backward in a marathon is undesirable as we are moving farther away from where we are trying to get to – moving forward is the desired direction. But it’s not just about moving forward – we want to move forward at a relatively swift pace, not just walk (we’re better than that!). However, a marathon needs to be run at a sustainable pace. Trying to sprint a marathon is unsustainable and will lead to
  • 3. over-exhaustion and ultimately slow us down in the long run. A recession is going backwards in the marathon (with a negative real GDP growth rate), while an expansion is moving forward in the marathon (with a positive real GDP growth rate). A peak is when we stop moving forward and start to go backward (turning point between positive and negative), while a trough is when we stop going backward and start moving forward again (turning point between negative and positive). Our goal is for a sustainable pace for expansion, which is typically thought of as a real GDP growth rate of approximately 3 percent - that is the jogging pace at which the U.S. economy has demonstrated it is capable of sustainably expanding. Expanding more rapidly than that can only be done temporarily, and trying to expand beyond that pace for an extended period will lead to “overheating” in the economy (which leads to high inflation and loss of purchasing power of the dollar in the US) and an eventual backlash - a recession. Expanding less than that level is not living up to our potential. This also brings up the non-technical term of “ growth recession” – when the economy is growing (so it can’t technically be in a recession), though growing so slowly there will still be some recession-like characteristics (such as rising or high unemployment). A growth recession is like walking in the marathon. While growth recession is not defined by the National Bureau of Economic Research (NBER) or introduced in this textbook, it has grown in popularity in the media as it sometimes serves as a useful description of the seemingly “gray” area of the business cycle that is not a recession, but not a healthy expansion either. Growth recession sometimes precedes actual recession (a slowdown before GDP growth ultimately turns negative – such as the tail end of the expansions before the early 80s double-dip recession and the 2001 recession), follows a recession (GDP growth turns positive but is still lower than a healthy rate – such as the recoveries following 1990-1991, 2001, and 2007-2009 recessions), or in
  • 4. the middle of an expansion (a slowdown that almost takes the place of an actual recession – such as the soft patch in the mid- 90s). Business cycles or economic fluctuations of the production level in an economy are defined by 2 phases which have 2 corresponding turning points: · Expansion: The expansion phase is the period during which real GDP is increasing. · Recession: The recession phase is commonly defined as a period during which real GDP decreases for at least six months, though the NBER has a broader definition. · Peak: A peak is the highest level of real GDP yet attained. A peak is a turning point between an expansion and a recession. · Trough: A trough is the temporary low-point in real GDP. A trough is a turning point between a recession and an expansion. Let’s look at a picture of the US’s business cycles or fluctuations from 2003 through September of to 2013 as seen in Figure 14.4, and reproduced below: It’s interesting to see the long period of expansion between 2003 to the latter part of 2007. For much of that period Real GDP was actually greater than Potential GDP. The growth period was so long that economists focused more on sustaining even faster growth rather than looking at the warning signs of the business cycle model that they had begun to ignore. Then in
  • 5. 2008 the bubble burst, reaching bottom or trough in 2009 but since 2009 the expansion has been extremely slow, falling well below Potential GDP. This continued expansion, especially above the ‘potential’ GDP line, illustrates an overheated economy – too much spending, higher inflation rates, higher employment levels etc. The economy in this situation will eventually correct itself falling back to or a little below the ‘potential’ GDP line. In the 2008- 2009 case, however; Real GDP hit an almost record low. The economy was then in a severe recession highlighted by little spending or investment, high unemployment rate, severe corrections in both the stock and real estate markets, etc. Even though economists tend to avoid the word ‘cycle’ that’s pretty much what you see when looking at Figure 14.4: slow expansion then mild contraction over and over (cycle) until the huge contraction in 2008-2009. Explaining the Business Cycle Economists tend to link business fluctuations to 3 main forces: external factors, business investment, and government activity. External Shocks External events can cause or contribute to a fluctuation in the US economy. World War II for instance (something occurring outside the US economy) had a tremendous impact upon the US economy. It turned a nation from a devastating economic depression where 13 million people were unemployed, productive output was down to 35% of the nation’s productive capacity, and farm income down to 20% of its 1929 level, to a nation of full employment and production that exceeded US output at any other time. The demand for war supplies was so great that factories operated on a 24-hour basis, employing all able-bodied workers including women. Business Investment When businesses believe its future prospects for profit are positive, they increase capital investment: buying new machines, building new factories, expanding old ones etc. This produces more jobs, more productivity, and more income. When
  • 6. businesses expect poor future prospects from the US economy as to create more profit, they will do the exact opposite of the above which will decrease productivity, jobs, and income, slowing down consumer spending. Government Activity The government’s changing economic policies may also influence business fluctuations in the US economy. Raising or lowering taxes or increasing or decreasing government expenditures may have either a positive or negative effect upon the economy. PUTTING IT ALL TOGETHER: ECONOMIC FLUCTUATIONS (ALSO CALLED THE BUSINESS CYCLE) Everything we’ve discussed thus far in all modules both Micro and Macro come together to define an economy as one that is growing at an acceptable rate to one that is stagnant or even contracting. These economic fluctuations are common to all economies and, although sometimes termed business cycles, there is no predictable pattern as to the up and down movement of our economy’s growth over a period of time. What causes these fluctuations is extremely difficult and cause for debate among most economists. What occurs during the fluctuations is easier to identify. I want to give you an oversimplified example of an economic fluctuation from expansion to contraction. This is a model only, but it does reflect some degree what occurs during one cycle: 1. Assume you are a retailer selling casual and dress shoes. At the moment, your sales are fairly stagnant, so for every pair of shoes on the sales’ floor, you have one pair of shoes in inventory. There are plenty of people who want to purchase a pair of shoes for you, but most of them just don’t have the disposable income necessary to do so 2. Now, assume that there is an increase in economic activity. Christmas is a few months away, and many part-time positions are being filled by people who had been unemployed. 3. Now that more people are employed, there is more money in the hands of consumers. Many of them now have the ability to
  • 7. purchase a pair of shoes from you. 4. When demand initially increases for your product, you’re caught short of inventory, so you order more from the manufacturer. You now need five pairs of shoes in inventory for every one pair you have on the retail floor. 5. The manufacturer, fairly idle until now, is caught short, so he hires more labor and purchases more resources to accommodate this new demand. 6. The new labor means people are making even more money and therefore spending more, creating even more shortages. The economy is now booming with rapid growth. 7. Eventually, the manufacturer and retailers catch up to the demand and possess the number of inventories and labor that they need to satisfy consumer demand. 8. Once this new demand is satisfied, however, retailers find they have too much inventory. So they cut back on their demand for manufactured products. Orders drop at the same rate as when they went up. 9. Because of the decrease in orders, manufacturers begin laying off labor, meaning fewer incomes, meaning less demand (purchases) for your product. 10. The retailers feel this decrease in demand and stop ordering from the manufacturer altogether. 11. Plants close down and all workers are laid off. 12. This creates another drop in demand for retailers who lay off all of their workers before going out of business altogether. The economy is now in recession FACTS ABOUT ECONOMIC FLUCTUATIONS The above gives you a broad idea of what takes place during economic fluctuations, and how an economy might go from boom to bust over an extended period of time. Since we know that these fluctuations will always occur, the goal for any economy is to keep both the expansions and the contractions at a minimum level. We also would like to see expansions occur over long periods of time while minimizing the period of time for the contractions. As much controversy as there is about
  • 8. causes and remedies for business fluctuations, there are a few facts which always hold true about them: 1. As I stated before, they are unpredictable. Remember that ‘Real’ GDP is the value of all final goods and services produced in our economy. That means we may use measurements of ‘Real’ GDP to determine the level of our economy’s activity. 2. As ‘Real’ GDP falls into recession so does investment spending. If corporations and businesses discontinue investment, profits will fall, as will spending by consumers, which foreshadow decreases in sales across the economic spectrum: retail, cars, homes etc. Decreases in sales and profits for corporations and businesses leads to; 3. Layoffs and high unemployment levels. Notice this rippling effect throughout the entire economy. Using only the housing industry as an example, look at the tremendous number of people affected by layoffs because of a recession: the producers of wood, cement, and other materials used in housing construction as well as the tremendous number of foundation layers, carpenters, window installers, floor tilers, plumbers, electricians etc. In 2008-2009, the combination of failures by major banks, corporations, automobile manufacturers, and the housing industry drove the U.S. into its most devastating and serious recession since the Great Depression of the 1930’s. Does Real GDP Give an Accurate Measure of an Economy’s Standard of Living? If you look back on pg. 46, Figure 2.3 you’ll see that the average income per person per day in the US outranks all other countries. Income per person per day in the US is 3x that of Russia and 6x that of China. Using a common factor to compare incomes we also see some startling results of income disparities among countries. While we in the US enjoy a per person income of over $125 per day, 66% of the world’s population which is Africa earn a per person income of less than $2 per day. Limitations of Real GDP Measurements
  • 9. Remember that Real GDP measures the value of goods and services that are bought and sold in the marketplace. But what about those goods or services that are not sold in the marketplace? Household Production It sometimes seems rather ironic that a stay-at-home Mom (or Dad) has no value when it comes to Real GDP because their services (raising children, cooking meals, shopping etc.) are not for sale in the marketplace. In the late 20th and now 21st century in the US, some of this has begun to change primarily because of the increase in the number of women in the workforce. Now that many women no longer stay at home they purchase child care services on the open market and rely more and more upon fast foods for their families because they no longer have the time to prepare meals at home. Illegal or Underground Production Almost any good or service deemed illegal in the US can be purchased in the illegal underground market. The most notable of these is the sale of illegal prescription and non-prescription drugs. It also includes prostitution, sales of restricted firearms, pornography, unlicensed gambling etc. Added to these are the unreported tips by food servers, hairdressers, and cab drivers as well as unreported income of illegal immigrants. As state in your text, the estimated total of unreported underground production not included in GDP makes up 16% of GDP (early 1990’s figure). This, of course, is just an educated guess based upon the number of people caught engaging in these enterprises. The figure may actually be quite higher since people involved in illegal activities will not report their activities to the authorities. Leisure Time It’s very difficult to put a monetary value on leisure time unless you calculate the opportunity cost in $ of the money you could be making during your leisure time. This would be a legitimate figure for a $ amount value of our leisure time but is not
  • 10. included in GDP. Levels of Happiness Happiness is not only a difficult term to define (happiness for one person may be totally different for another) but almost impossible to assign a monetary value. There is a picture of a family from a mountainous region in India and all of their belongings compared to a picture of an upper-middle-class family in the US and all of their belongings. The family from India possesses the bare essentials: an adobe one-room structure for housing; a mule for transportation; two sets of clothing (warm weather and cold weather); pots and pans; and bedding. The family from the US has much more than the essentials: a 2- story 4-bedroom house; garage with two cars; three computers; 4 cell phones and so on. The interesting thing about the picture is that it was part of a study done to determine levels of happiness. The study found that as long as the basic necessities of life were included, the family with the least possessions was the happiest. If anything, it’s an interesting concept that the more material goods you possess the less happy you may be. Again, this is just one opinion and using the word ‘happiness’ as a measurable quality makes it fairly subjective. image1.png image2.png image3.png MACROECONOMICS MODULE 2 HOMEWORK ASSIGNMENT (CH. 14B pp. 383-390) Figure 14.3 1. Referring to Figure 14.3 above, explain what is occurring in the years 2008-2010 and then in 2005-2007 in terms of real GDP and potential. 2. From 2010 onward it appears that US real GDP is recovering.
  • 11. After referring to Figure 14.3 once again, what conclusion might you make about this recovery especially in terms of potential GDP? 3. How would you define a ‘recession’? 4. Explain why economists termed the period following 1991 as the Great Moderation. 5. Real GDP does not include all goods and services produced. Explain. 6. The United Nations has constructed a Human Development Index (HDI). What does this index measure? 7. Where does the United States rank using the United Nation’s HDI? 8. Why isn’t the US ranked highest since it has one of the highest GDP’s per person in the world? 9. If GDP increased and the unemployment rate decreased, what phase of the business cycle would you assume the economy is in? 10. When exactly do economists say that an economic expansion ends and a recession begins? When does a recession end? 11. Robert Kennedy, when seeking the Democratic presidential nomination in 1968, remarked that GDP measures everything except that which makes life worthwhile. What do you think he meant by this statement? What do you think he feels is missing when measuring GDP. 12. Do you feel that economists are guilty of discrimination when they don’t count the long hours a stay at home mother or father spends raising a family? 13. Table 14.4 in your text (pg. 383) compares real GDP per person in the US between 1960 and 2016. This shows real GDP per person in 2013 at almost 3 times that of 1960. Does that mean that people in the US are 3 times happier in 2013 as compared to 1960? 14. During the 1960’s the potential growth rate of GDP grew at an average of 20.8% per year. Since 1970 though, the growth
  • 12. rate of a potential of GDP has been about 1.9% a year (pg. 383 bottoms). Using this as a gauge explain why you think the US economy is either better or worse off today than it was 50 years ago. 15. If underground production esp. the production and sale of illegal drugs were counted in GDP, it would have made up about 16% of GDP; a huge amount. Explain why you feel that economists and the government do not count these goods as part of GDP. 16. Even though the per person real GDP in the US is among the highest in the world, explain why you feel that this may be misleading in terms of the quality of life for individuals in the US (think leisure, environment, health, social justice etc.). image1.png