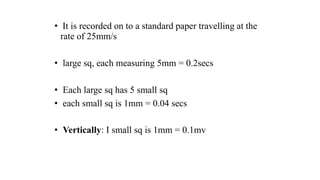
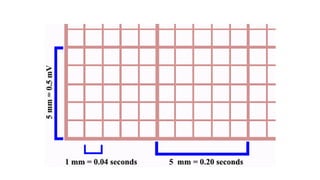
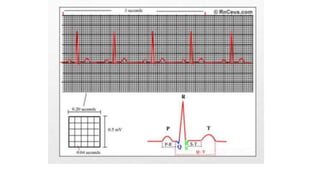
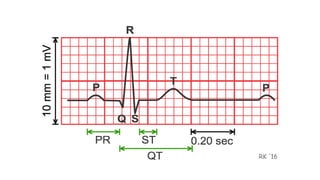
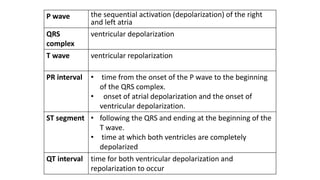
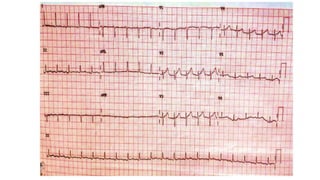
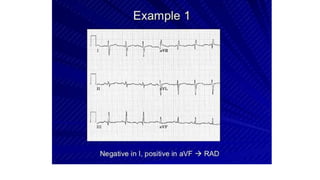
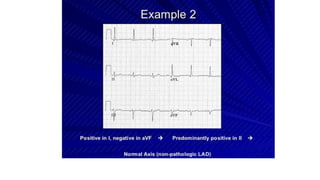
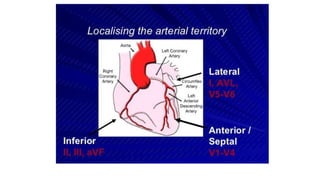
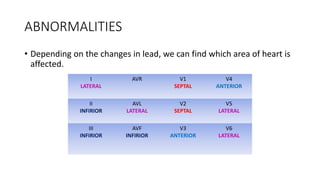
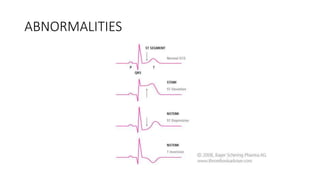
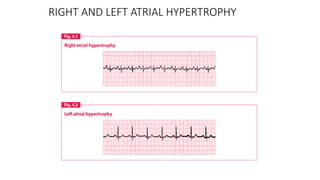
ELECTROCARDIOGRAM(ECG)
• It is recorded on to a standard paper travelling at the
rate of 25mm/s
• large sq, each measuring 5mm = 0.2secs
• Each large sq has 5 small sq
• each small sq is 1mm = 0.04 secs
• Vertically: I small sq is 1mm = 0.1mv
P wave the sequential activation (depolarization) of the right
and left atria
QRS
complex
ventricular depolarization
T wave ventricular repolarization
PR interval • time from the onset of the P wave to the beginning
of the QRS complex.
• onset of atrial depolarization and the onset of
ventricular depolarization.
ST segment • following the QRS and ending at the beginning of the
T wave.
• time at which both ventricles are completely
depolarized
QT interval time for both ventricular depolarization and
repolarization to occur
Precordial Leads
Adapted from: www.numed.co.uk/electrodepl.html
Precordial Leads
Summary of Leads
Limb Leads Precordial Leads
Bipolar I, II, III
(standard limb leads)
-
Unipolar aVR, aVL, aVF
(augmented limb leads)
V1-V6
Anatomic Groups
(Septum)
RATE
Rate (rhythm regular) =
• 300 / no. of big boxes between two peaks
• 1500 / no. of small boxes between two peaks
RHYTHM
1. Check lead II
2. Regular - ‘r waves’ are at equal interval's (equal no of small/ large
boxes between 2 r waves)
3. Irregular - ‘r waves’ are not at equal interval's
EXAMPLE 1
The QRS Axis
The QRS axis represents the net overall direction of the
heart’s electrical activity.
Abnormalities of axis can hint at:
Ventricular enlargement
Conduction blocks (i.e. hemiblocks)
The Quadrant Approach
1. Examine the QRS complex in leads I and aVF to determine if they
are predominantly positive or predominantly negative. The
combination should place the axis into one of the 4 quadrants
below.
ABNORMALITIES
• Depending on the changes in lead, we can find which area of heart is
affected.
I
LATERAL
AVR V1
SEPTAL
V4
ANTERIOR
II
INFIRIOR
AVL
LATERAL
V2
SEPTAL
V5
LATERAL
III
INFIRIOR
AVF
INFIRIOR
V3
ANTERIOR
V6
LATERAL
ABNORMALITIES
SEQUENCE OF EVENTS IN MYOCARDIAL INFARCTION ON ECG
Elevation of ST segment
Appearance of Q waves
T wave inversion
ST segment returns to baseline within 24-48 hrs
T wave inversion permanent
Called as ST segment Elevation Myocardial Infarctions(STEMIs)
Infarction not full thickness  T wave inversion present  Q waves absent  non-ST
segment Elevation Myocardial Infarctions(NSTEMIs)
ABNORMALITIES
• ST elevation - ACUTE MI
• T wave inversion - Chronic MI
• ST depression - Ischaemia
ABNORMALITIES- EX 1
RIGHT AND LEFT ATRIAL HYPERTROPHY
• Thank You

ECG-REVISION.pptx

  • 1.
  • 2.
    • It isrecorded on to a standard paper travelling at the rate of 25mm/s • large sq, each measuring 5mm = 0.2secs • Each large sq has 5 small sq • each small sq is 1mm = 0.04 secs • Vertically: I small sq is 1mm = 0.1mv
  • 7.
    P wave thesequential activation (depolarization) of the right and left atria QRS complex ventricular depolarization T wave ventricular repolarization PR interval • time from the onset of the P wave to the beginning of the QRS complex. • onset of atrial depolarization and the onset of ventricular depolarization. ST segment • following the QRS and ending at the beginning of the T wave. • time at which both ventricles are completely depolarized QT interval time for both ventricular depolarization and repolarization to occur
  • 8.
    Precordial Leads Adapted from:www.numed.co.uk/electrodepl.html
  • 9.
  • 10.
    Summary of Leads LimbLeads Precordial Leads Bipolar I, II, III (standard limb leads) - Unipolar aVR, aVL, aVF (augmented limb leads) V1-V6
  • 13.
  • 14.
    RATE Rate (rhythm regular)= • 300 / no. of big boxes between two peaks • 1500 / no. of small boxes between two peaks
  • 16.
    RHYTHM 1. Check leadII 2. Regular - ‘r waves’ are at equal interval's (equal no of small/ large boxes between 2 r waves) 3. Irregular - ‘r waves’ are not at equal interval's
  • 17.
  • 19.
    The QRS Axis TheQRS axis represents the net overall direction of the heart’s electrical activity. Abnormalities of axis can hint at: Ventricular enlargement Conduction blocks (i.e. hemiblocks)
  • 21.
    The Quadrant Approach 1.Examine the QRS complex in leads I and aVF to determine if they are predominantly positive or predominantly negative. The combination should place the axis into one of the 4 quadrants below.
  • 26.
    ABNORMALITIES • Depending onthe changes in lead, we can find which area of heart is affected. I LATERAL AVR V1 SEPTAL V4 ANTERIOR II INFIRIOR AVL LATERAL V2 SEPTAL V5 LATERAL III INFIRIOR AVF INFIRIOR V3 ANTERIOR V6 LATERAL
  • 27.
  • 28.
    SEQUENCE OF EVENTSIN MYOCARDIAL INFARCTION ON ECG Elevation of ST segment Appearance of Q waves T wave inversion ST segment returns to baseline within 24-48 hrs T wave inversion permanent Called as ST segment Elevation Myocardial Infarctions(STEMIs) Infarction not full thickness  T wave inversion present  Q waves absent  non-ST segment Elevation Myocardial Infarctions(NSTEMIs)
  • 29.
    ABNORMALITIES • ST elevation- ACUTE MI • T wave inversion - Chronic MI • ST depression - Ischaemia
  • 30.
  • 31.
    RIGHT AND LEFTATRIAL HYPERTROPHY
  • 32.