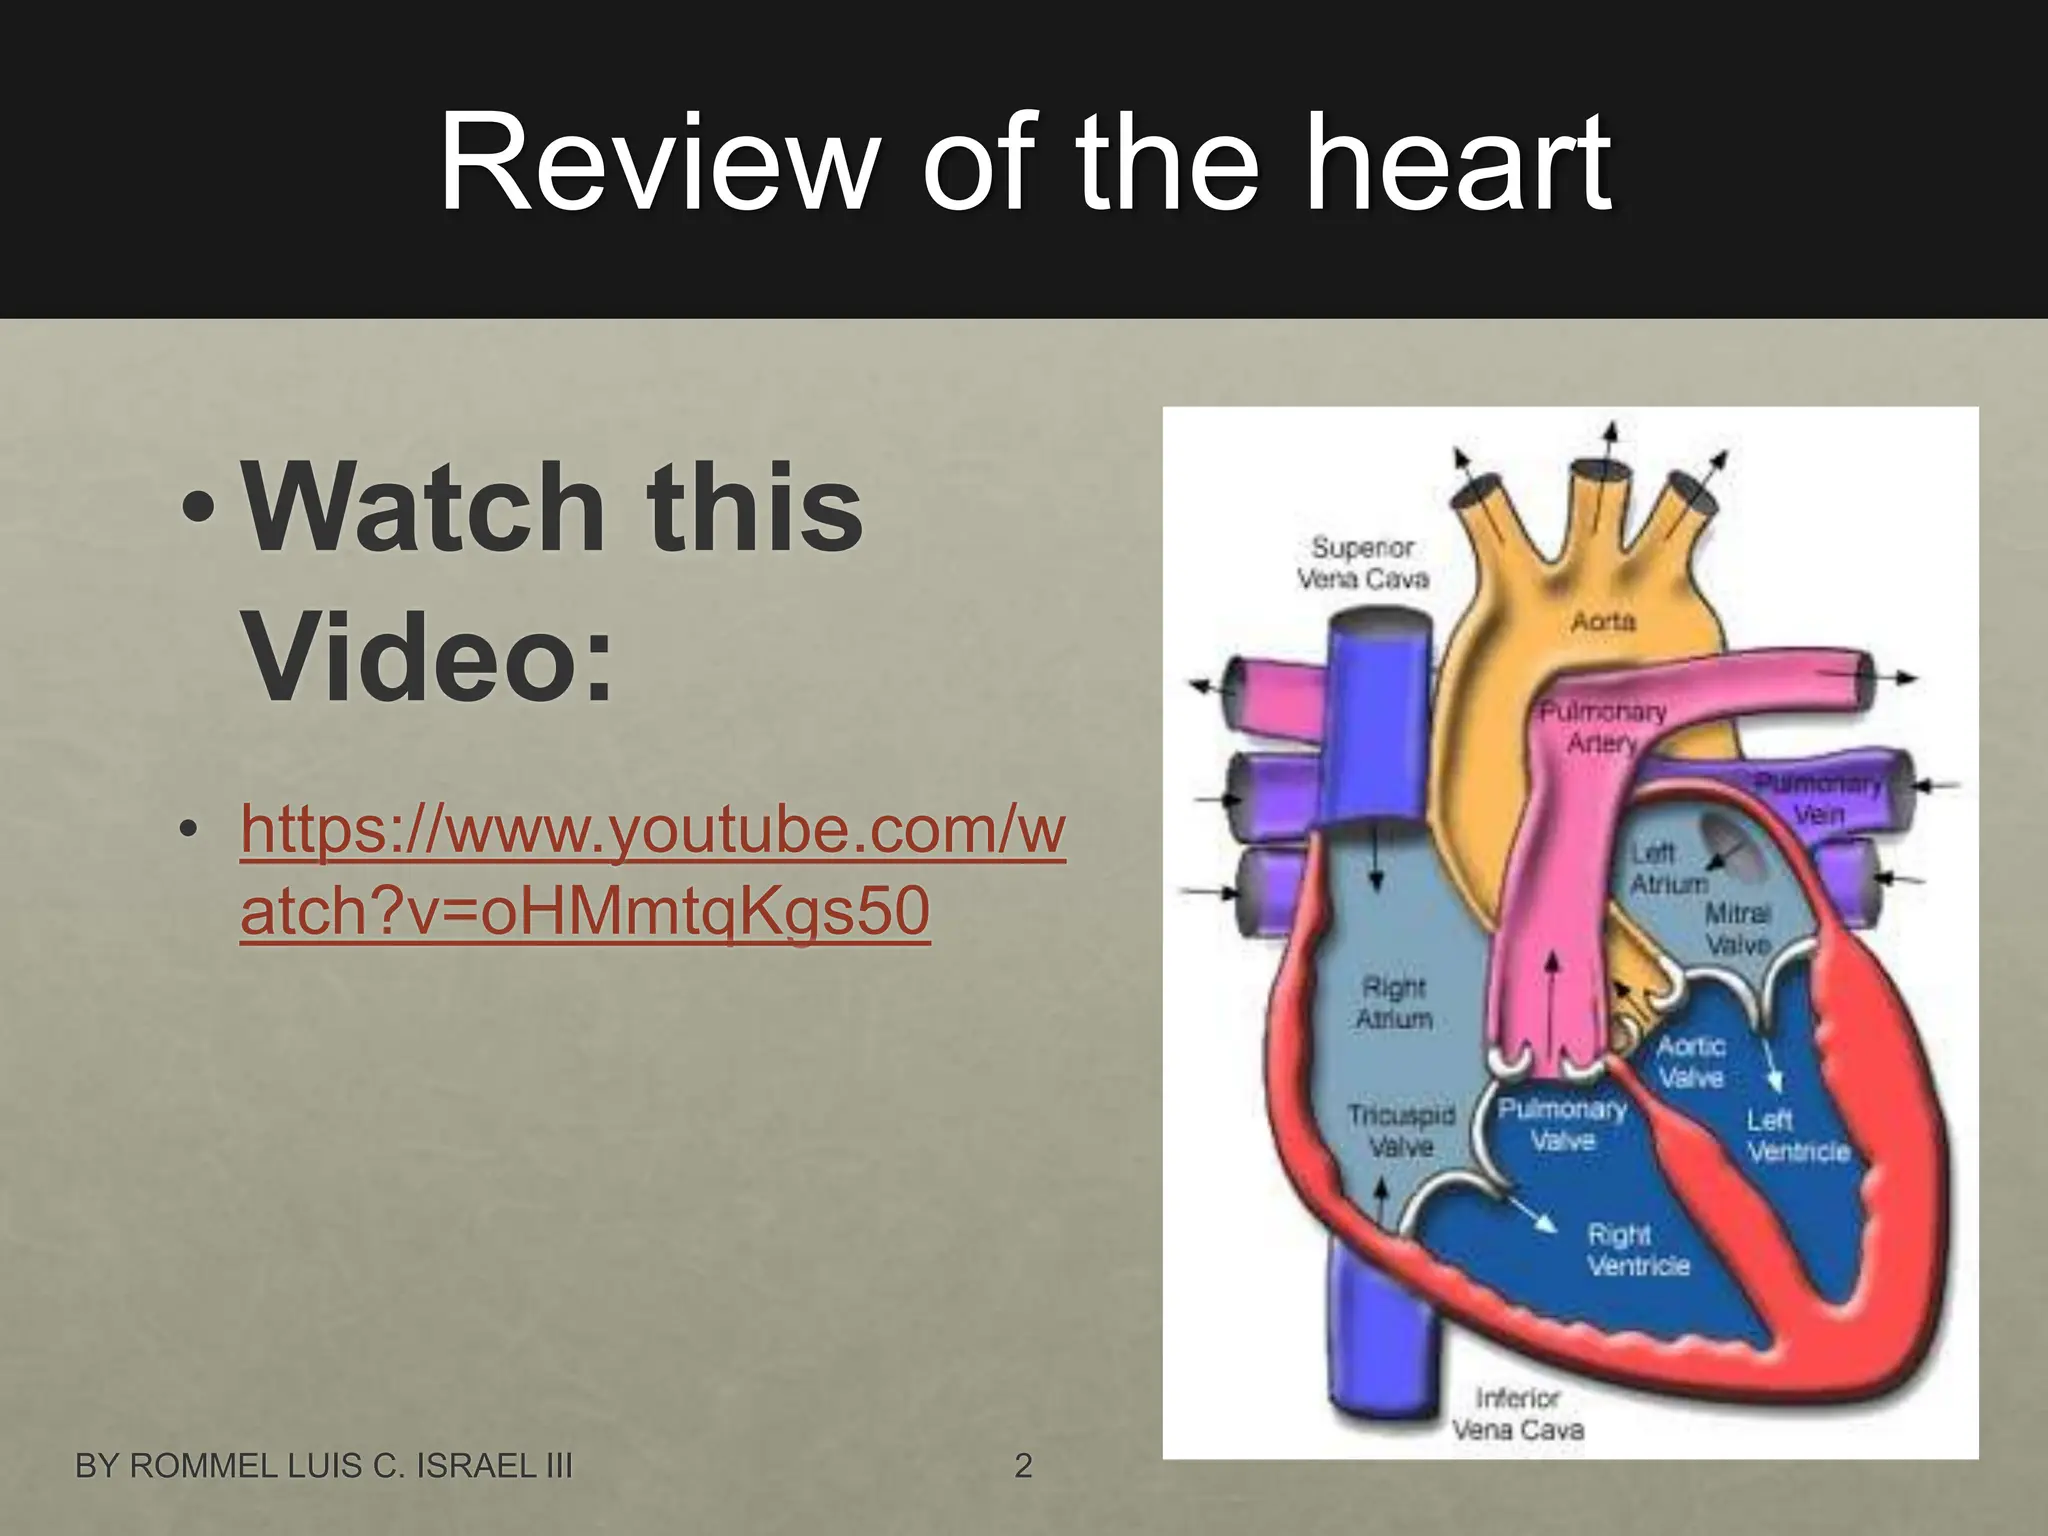
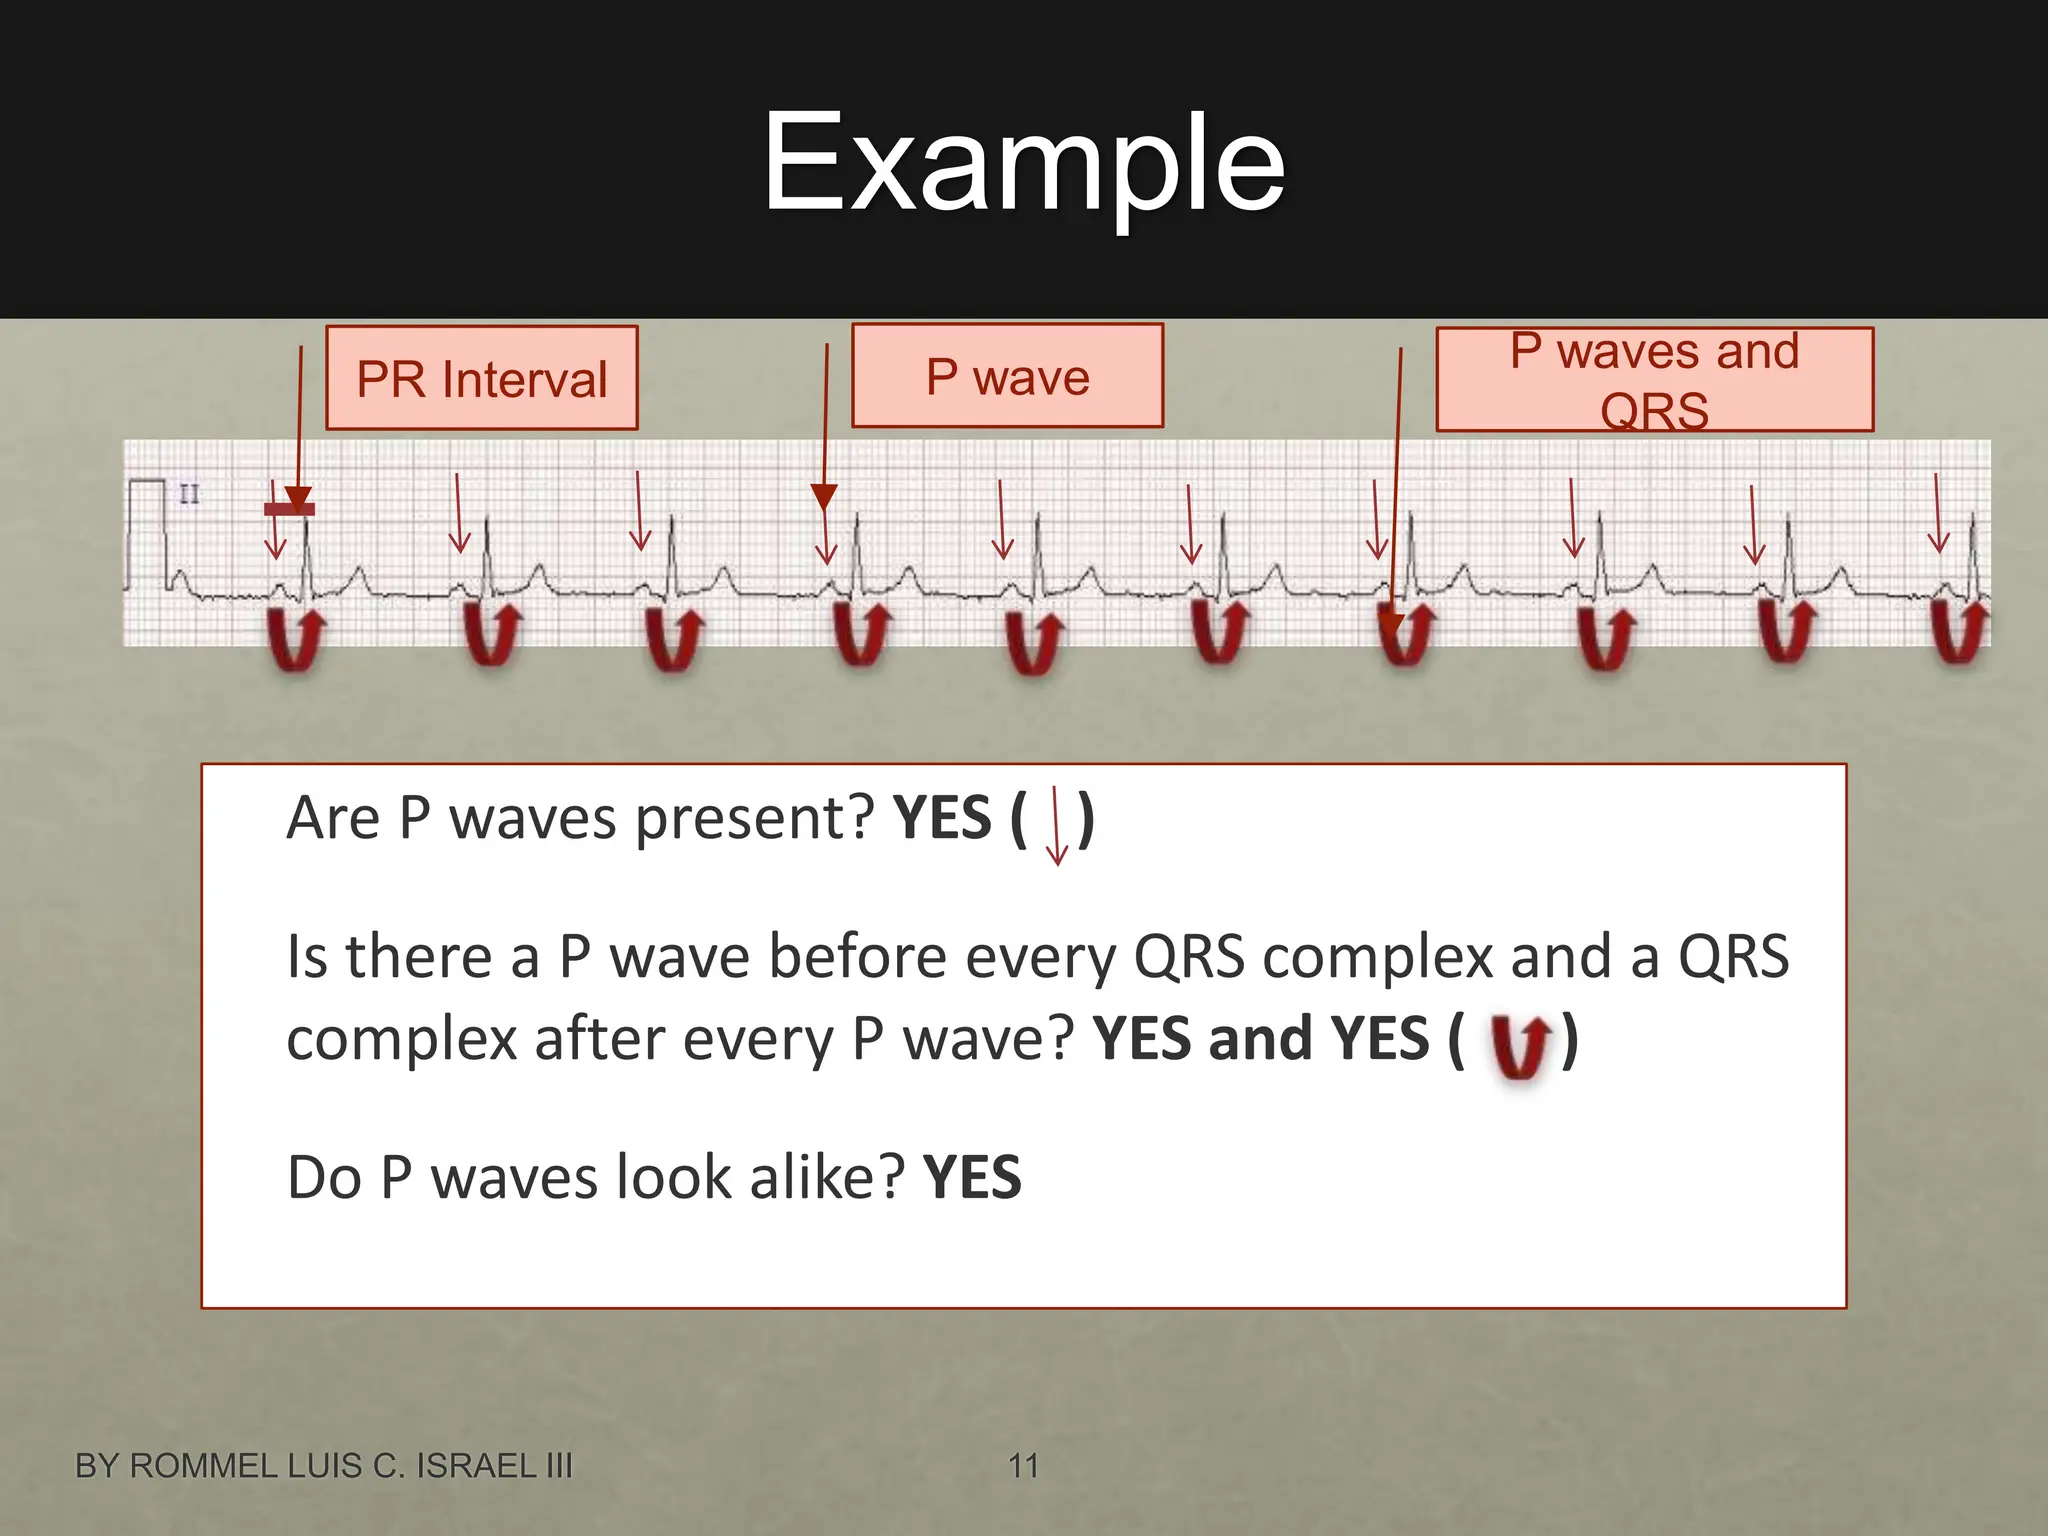
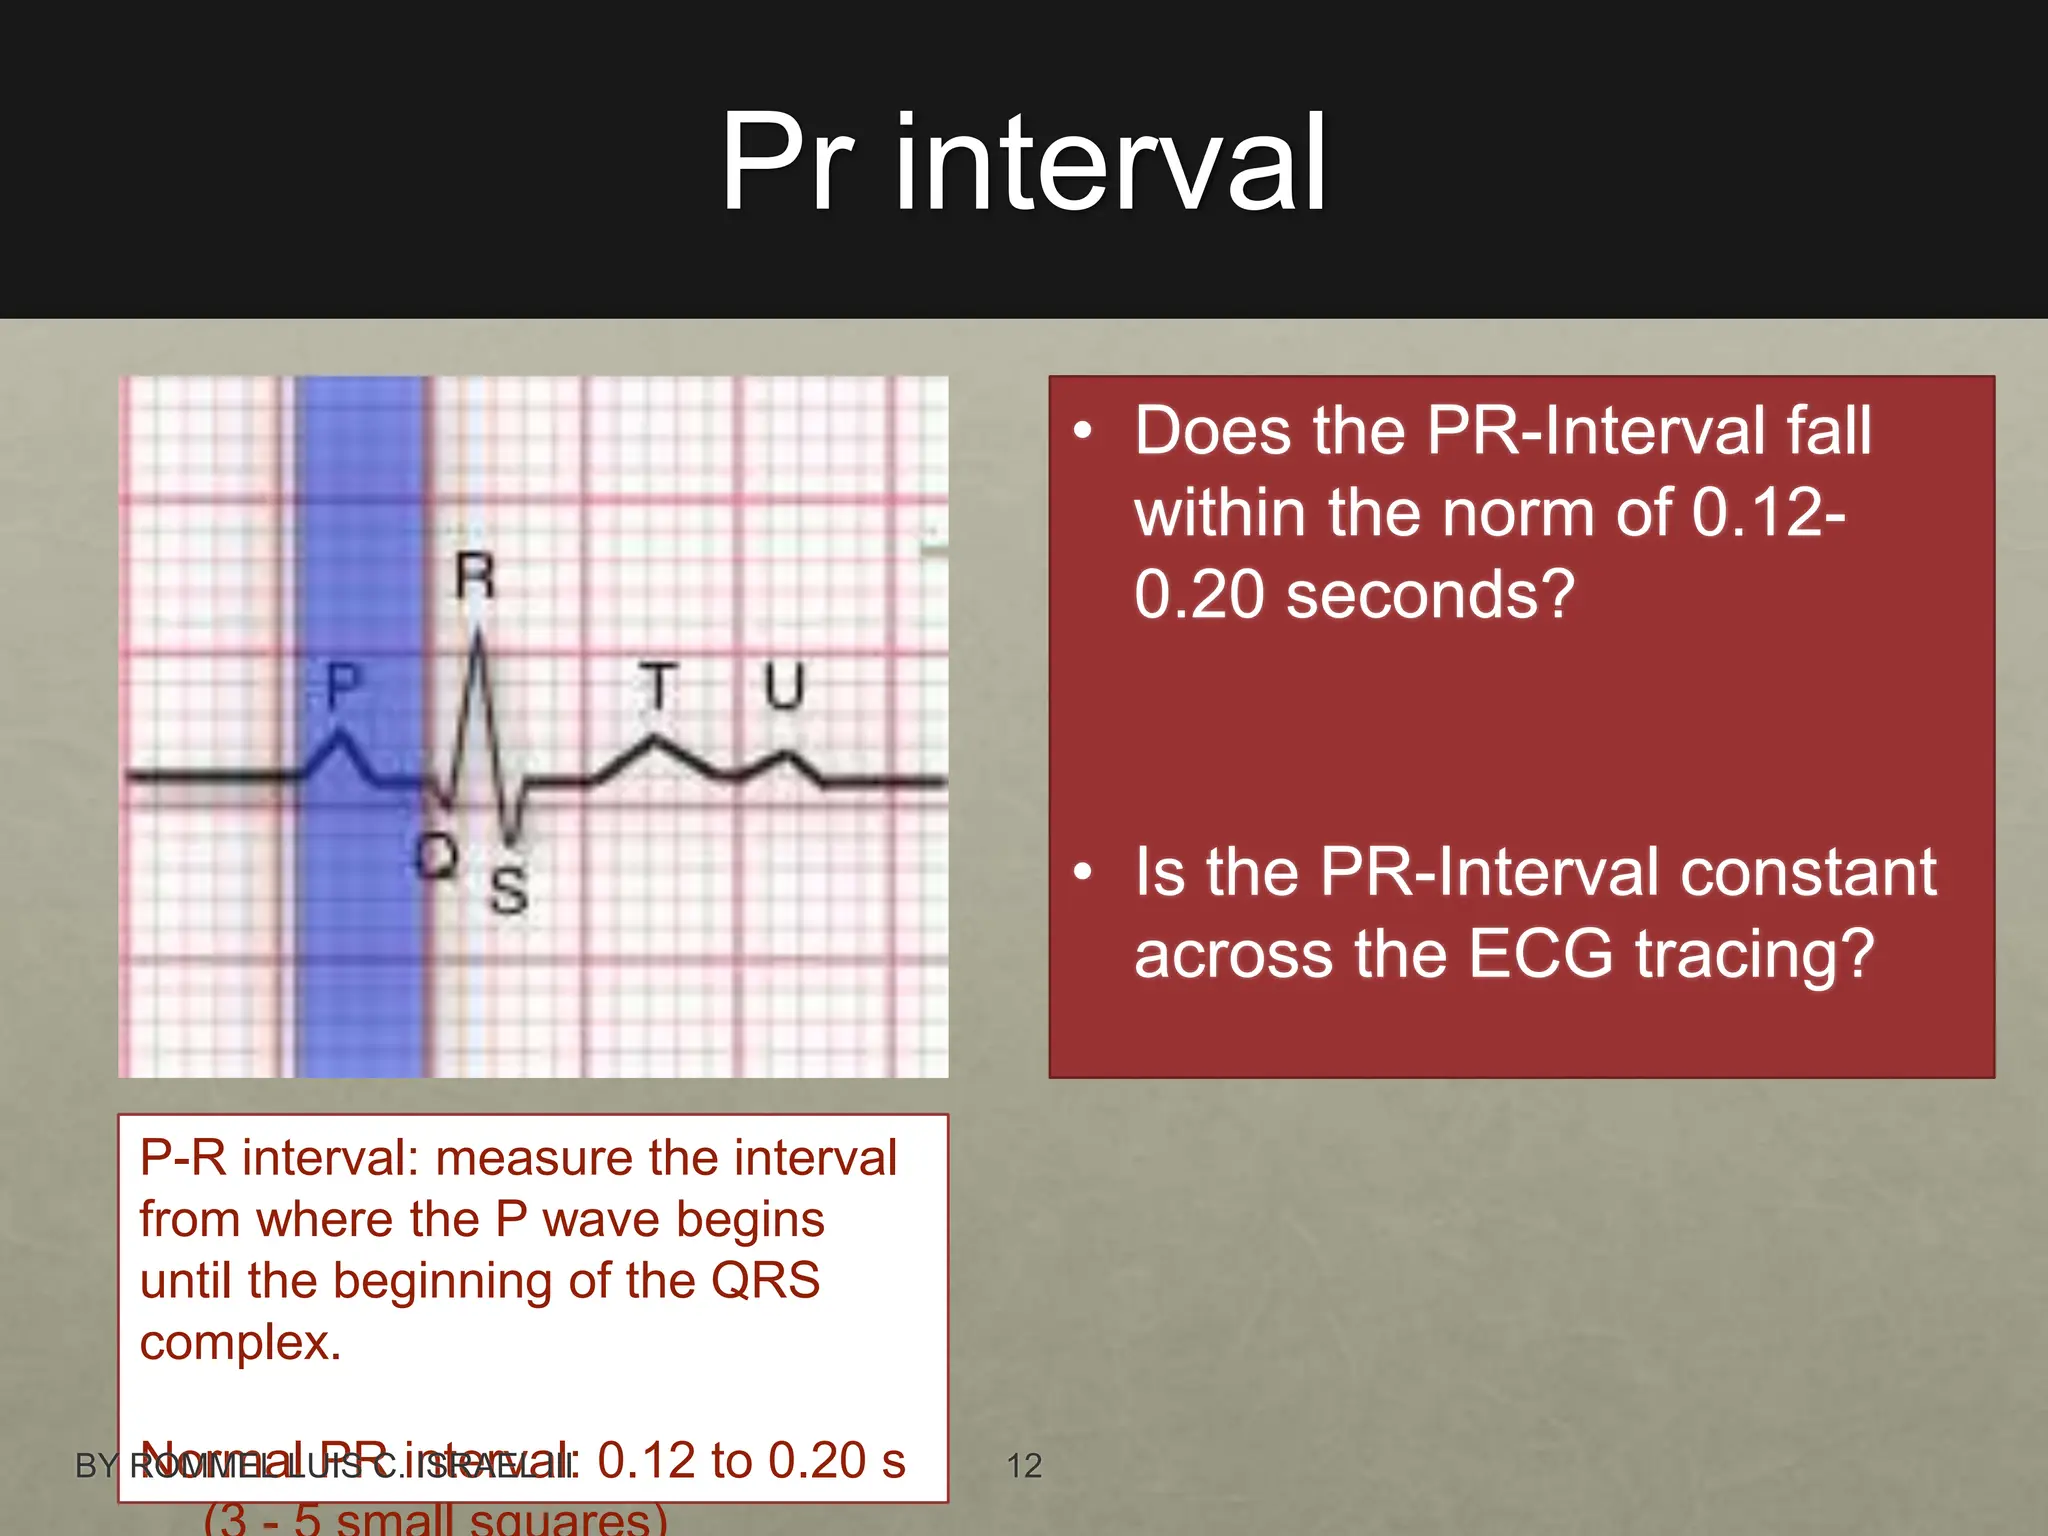
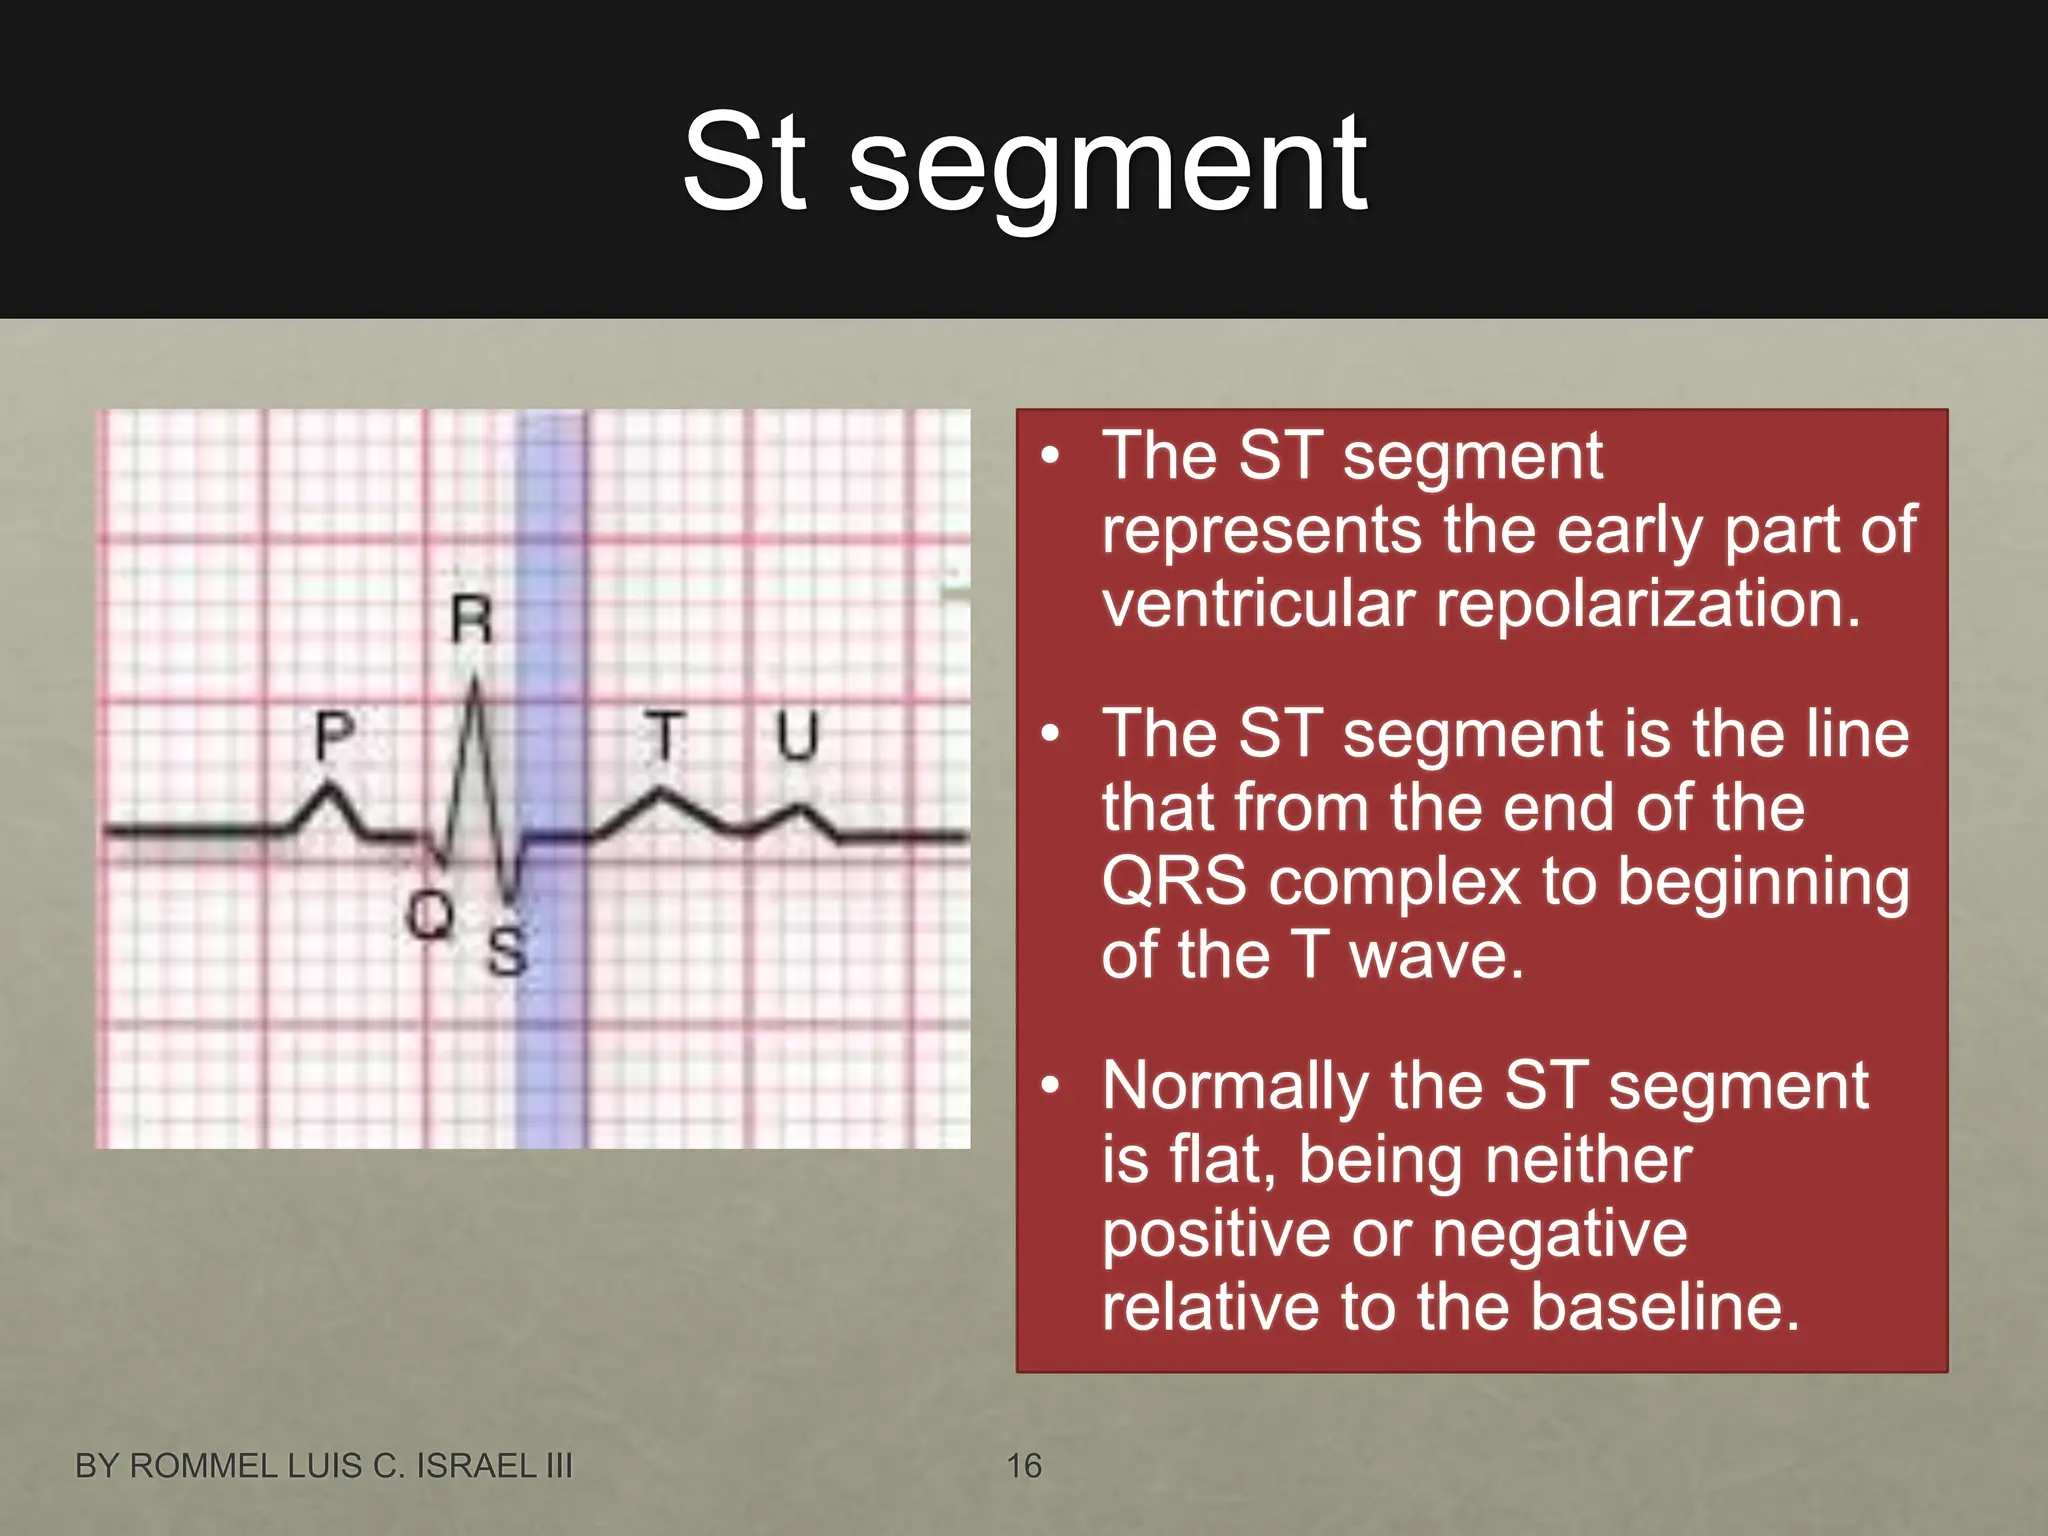
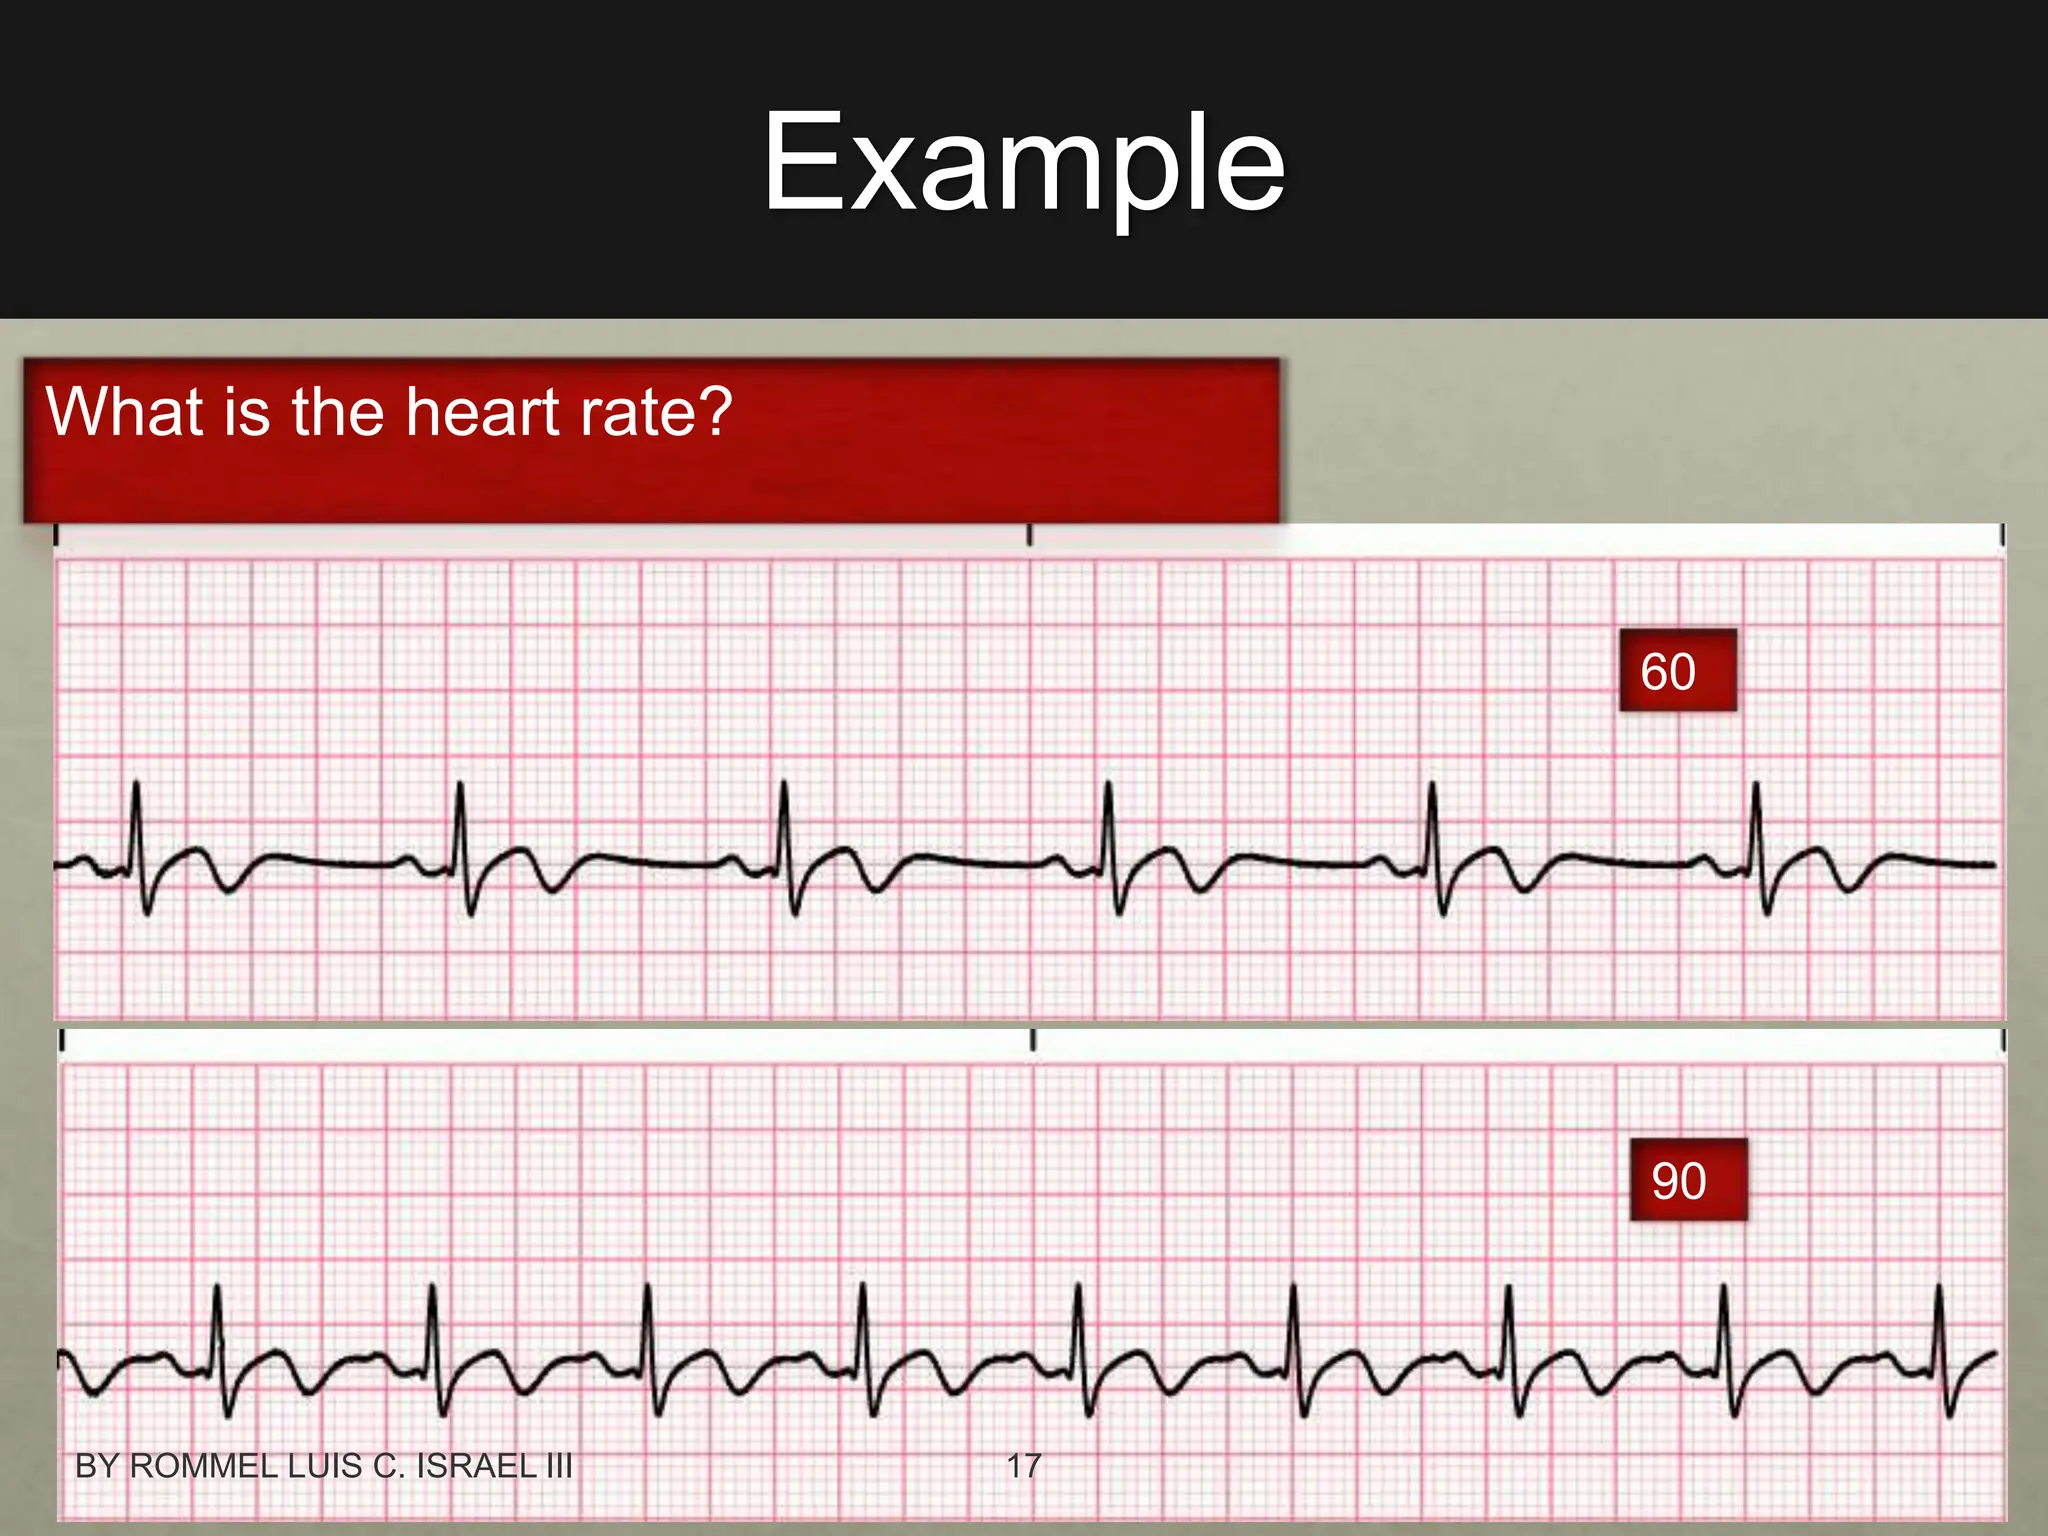
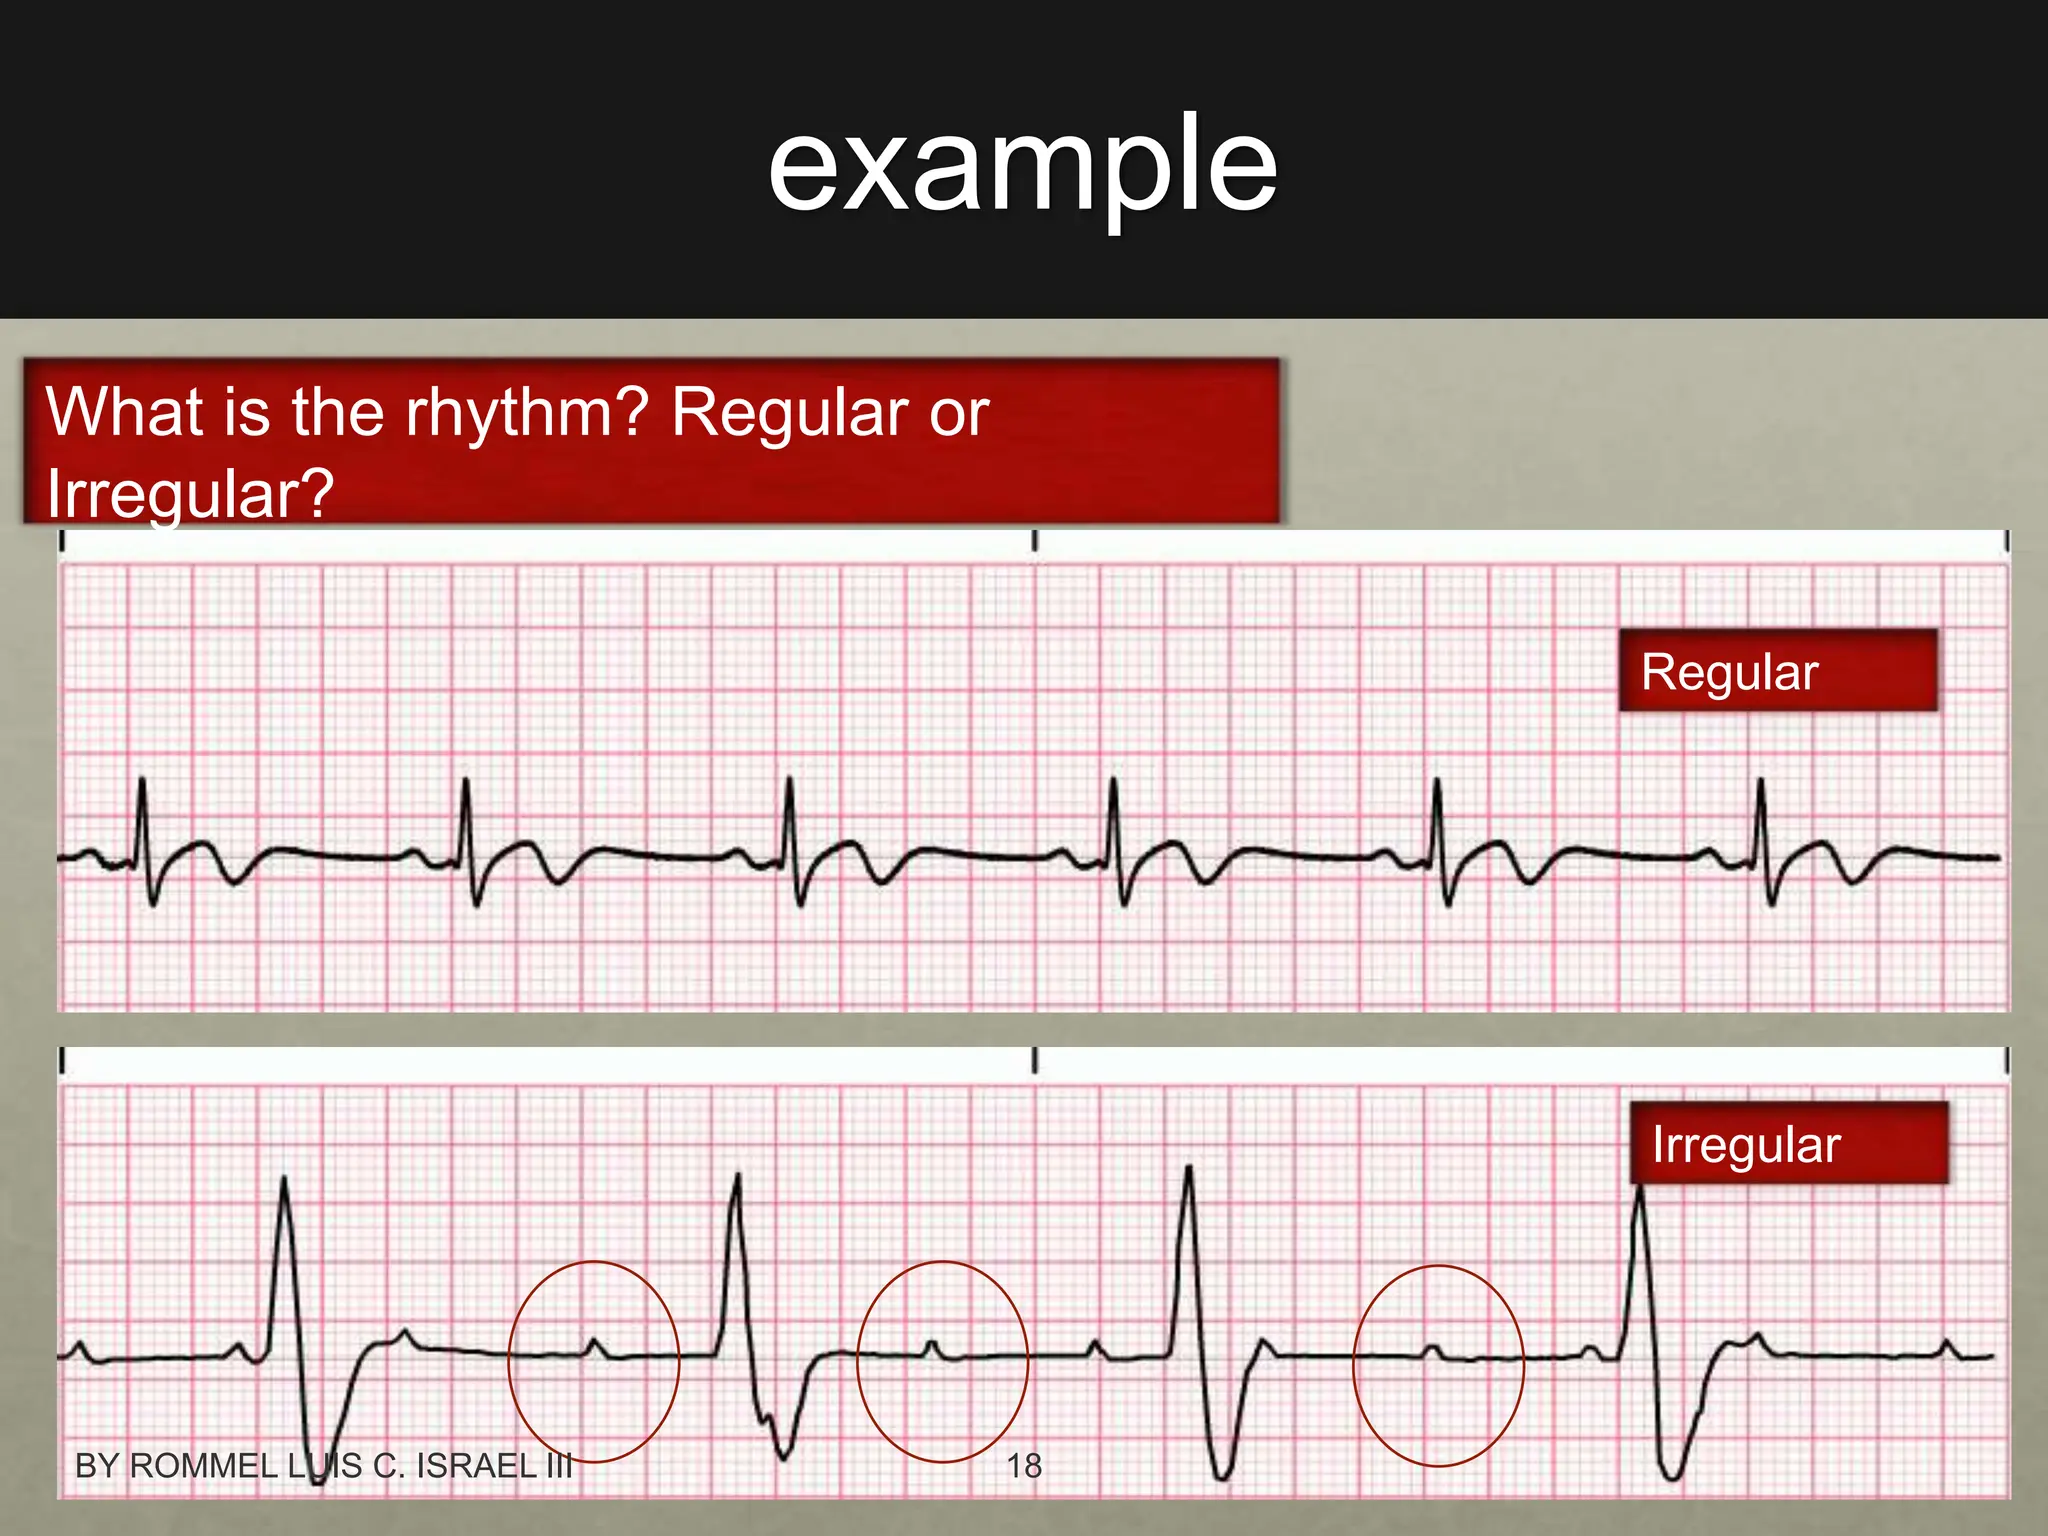
Electrical conduction of the heart
and
Ecg interpretation
Prepared by: ROMMEL LUIS C. ISRAEL III
BY ROMMEL LUIS C. ISRAEL III 1
Review of the heart
• Watch this
Video:
• https://www.youtube.com/w
atch?v=oHMmtqKgs50
BY ROMMEL LUIS C. ISRAEL III 2
Conduction system
• Watch this
video:
• https://www.youtube.c
om/watch?v=RYZ4da
FwMa8
BY ROMMEL LUIS C. ISRAEL III 3
Electrical conduction
BY ROMMEL LUIS C. ISRAEL III 4
Understanding an Ecg strip
• This is a 6 seconds ECG strip that
is usually taken and read to look
for electric abnormalities in the
heart.
• It is important to learn the times
indicated by each box to be able to
Each box is 0.2
secs
Black marks at the top
indicate 3 secs intervals
The smallest
boxes are 0.04
secs
BY ROMMEL LUIS C. ISRAEL III 5
A normal ecg
• P wave is the first
upward (positive)
deflection
waveform.
• It indicates atrial
depolarization
• QRS complex follows the P
wave.
• Normally, it begins with a
downward deflection, Q; a
larger upwards deflection, R;
and then a downwards S
wave.
• The QRS complex
represents ventricular
depolarization and
contraction.
• T wave is
normally a
modest
upwards
waveform.
• It representing
ventricular
repolarization
• U wave indicates the
recovery of the
Purkinje conduction
fibers.
• This wave component
may not be
observable.
BY ROMMEL LUIS C. ISRAEL III 6
Reading ecg
How to read an ECG strip?
An 8 step procedure is
followed:
1. Rate
2. Rhythm
3. P Wave
4. PR Interval
5. QRS Interval
6. T Wave
7. QT Interval
8. ST Segment
BY ROMMEL LUIS C. ISRAEL III 7
rate
Counting R waves:
Count the number of R
waves in a 6 second rhythm
strip, then multiply by 10.
Or
Count the number of R
waves in a 10 second
rhythm strip, then multiply by
6.
Counting boxes: 300 - 150 - 100
- 75 - 60 - 50
Count the number of large boxes
to the next R wave. If the second
R wave is 1 large box away the
rate is 300, 2 boxes - 150, 3
boxes - 100, 4 boxes - 75, etc.
Normal: 60 – 100 bmp
BY ROMMEL LUIS C. ISRAEL III 8
rhythm
• For ventricular rhythm, examine the R-R intervals.
Are they regular?
• For atrial rhythm, observe the P-P intervals. Are they
regular?
P-P Interval R-R Interval
BY ROMMEL LUIS C. ISRAEL III 9
P Wave
How to determine the rhythm?
• Are P waves present?
• Is there a P wave before every QRS complex and a QRS
complex after every P wave?
• Do P waves look alike? (smooth, rounded and upright)
P waves: atrial
rhythm
R waves: ventricular
rhythm
BY ROMMEL LUIS C. ISRAEL III 10
Example
• Are P waves present? YES ( )
• Is there a P wave before every QRS complex and a QRS
complex after every P wave? YES and YES ( )
• Do P waves look alike? YES
PR Interval P wave
P waves and
QRS
BY ROMMEL LUIS C. ISRAEL III 11
Pr interval
• Does the PR-Interval fall
within the norm of 0.12-
0.20 seconds?
• Is the PR-Interval constant
across the ECG tracing?
P-R interval: measure the interval
from where the P wave begins
until the beginning of the QRS
complex.
Normal PR interval: 0.12 to 0.20 s
BY ROMMEL LUIS C. ISRAEL III 12
Qrs Interval
The QRS complex indicates
ventricular depolarization that
triggers contraction of the
ventricles.
• Does the QRS interval fall within
the range of 0.08-0.12 seconds?
• Are the QRS complexes similar in
appearance across the ECG
tracing?
QRS interval: measure the QRS
interval from the end of the PR
interval to the end of the S
wave.
Normal QRS interval is 0.06 to
BY ROMMEL LUIS C. ISRAEL III 13
T wave
• The T wave indicates the
repolarization of the
ventricles.
• T waves which have a
downward (negative)
deflection or of T waves
with tall, pointed peaks
should be looked into.
• The U-wave is a small
upright, rounded bump.
When observed, it follows
the T-wave.
BY ROMMEL LUIS C. ISRAEL III 14
Qt interval
• The QT interval represents
the time of ventricular
activity (both
depolarization and
repolarization).
• QT interval: measured
from the beginning of the
QRS complex to the end
of the T wave.
• Normally, the QT interval
is 0.36 to 0.44 seconds (9-
11 boxes).
BY ROMMEL LUIS C. ISRAEL III 15
St segment
• The ST segment
represents the early part of
ventricular repolarization.
• The ST segment is the line
that from the end of the
QRS complex to beginning
of the T wave.
• Normally the ST segment
is flat, being neither
positive or negative
relative to the baseline.
BY ROMMEL LUIS C. ISRAEL III 16
Example
What is the heart rate?
60
90
BY ROMMEL LUIS C. ISRAEL III 17
example
What is the rhythm? Regular or
Irregular?
Regular
Irregular
BY ROMMEL LUIS C. ISRAEL III 18
example
How are the P waves?
P wave shape
varies
Normal
BY ROMMEL LUIS C. ISRAEL III 19
example
How are the PR intervals?
Long PR interval
Normal
BY ROMMEL LUIS C. ISRAEL III 20
example
How are the QRS intervals?
Wide QRS, bizarre
appearance
No QRS, bizarre rhythm
BY ROMMEL LUIS C. ISRAEL III 21
example
How are the QT intervals?
QT intervals are short
Normal
BY ROMMEL LUIS C. ISRAEL III 22

ECG Interpretation

  • 1.
    Electrical conduction ofthe heart and Ecg interpretation Prepared by: ROMMEL LUIS C. ISRAEL III BY ROMMEL LUIS C. ISRAEL III 1
  • 2.
    Review of theheart • Watch this Video: • https://www.youtube.com/w atch?v=oHMmtqKgs50 BY ROMMEL LUIS C. ISRAEL III 2
  • 3.
    Conduction system • Watchthis video: • https://www.youtube.c om/watch?v=RYZ4da FwMa8 BY ROMMEL LUIS C. ISRAEL III 3
  • 4.
    Electrical conduction BY ROMMELLUIS C. ISRAEL III 4
  • 5.
    Understanding an Ecgstrip • This is a 6 seconds ECG strip that is usually taken and read to look for electric abnormalities in the heart. • It is important to learn the times indicated by each box to be able to Each box is 0.2 secs Black marks at the top indicate 3 secs intervals The smallest boxes are 0.04 secs BY ROMMEL LUIS C. ISRAEL III 5
  • 6.
    A normal ecg •P wave is the first upward (positive) deflection waveform. • It indicates atrial depolarization • QRS complex follows the P wave. • Normally, it begins with a downward deflection, Q; a larger upwards deflection, R; and then a downwards S wave. • The QRS complex represents ventricular depolarization and contraction. • T wave is normally a modest upwards waveform. • It representing ventricular repolarization • U wave indicates the recovery of the Purkinje conduction fibers. • This wave component may not be observable. BY ROMMEL LUIS C. ISRAEL III 6
  • 7.
    Reading ecg How toread an ECG strip? An 8 step procedure is followed: 1. Rate 2. Rhythm 3. P Wave 4. PR Interval 5. QRS Interval 6. T Wave 7. QT Interval 8. ST Segment BY ROMMEL LUIS C. ISRAEL III 7
  • 8.
    rate Counting R waves: Countthe number of R waves in a 6 second rhythm strip, then multiply by 10. Or Count the number of R waves in a 10 second rhythm strip, then multiply by 6. Counting boxes: 300 - 150 - 100 - 75 - 60 - 50 Count the number of large boxes to the next R wave. If the second R wave is 1 large box away the rate is 300, 2 boxes - 150, 3 boxes - 100, 4 boxes - 75, etc. Normal: 60 – 100 bmp BY ROMMEL LUIS C. ISRAEL III 8
  • 9.
    rhythm • For ventricularrhythm, examine the R-R intervals. Are they regular? • For atrial rhythm, observe the P-P intervals. Are they regular? P-P Interval R-R Interval BY ROMMEL LUIS C. ISRAEL III 9
  • 10.
    P Wave How todetermine the rhythm? • Are P waves present? • Is there a P wave before every QRS complex and a QRS complex after every P wave? • Do P waves look alike? (smooth, rounded and upright) P waves: atrial rhythm R waves: ventricular rhythm BY ROMMEL LUIS C. ISRAEL III 10
  • 11.
    Example • Are Pwaves present? YES ( ) • Is there a P wave before every QRS complex and a QRS complex after every P wave? YES and YES ( ) • Do P waves look alike? YES PR Interval P wave P waves and QRS BY ROMMEL LUIS C. ISRAEL III 11
  • 12.
    Pr interval • Doesthe PR-Interval fall within the norm of 0.12- 0.20 seconds? • Is the PR-Interval constant across the ECG tracing? P-R interval: measure the interval from where the P wave begins until the beginning of the QRS complex. Normal PR interval: 0.12 to 0.20 s BY ROMMEL LUIS C. ISRAEL III 12
  • 13.
    Qrs Interval The QRScomplex indicates ventricular depolarization that triggers contraction of the ventricles. • Does the QRS interval fall within the range of 0.08-0.12 seconds? • Are the QRS complexes similar in appearance across the ECG tracing? QRS interval: measure the QRS interval from the end of the PR interval to the end of the S wave. Normal QRS interval is 0.06 to BY ROMMEL LUIS C. ISRAEL III 13
  • 14.
    T wave • TheT wave indicates the repolarization of the ventricles. • T waves which have a downward (negative) deflection or of T waves with tall, pointed peaks should be looked into. • The U-wave is a small upright, rounded bump. When observed, it follows the T-wave. BY ROMMEL LUIS C. ISRAEL III 14
  • 15.
    Qt interval • TheQT interval represents the time of ventricular activity (both depolarization and repolarization). • QT interval: measured from the beginning of the QRS complex to the end of the T wave. • Normally, the QT interval is 0.36 to 0.44 seconds (9- 11 boxes). BY ROMMEL LUIS C. ISRAEL III 15
  • 16.
    St segment • TheST segment represents the early part of ventricular repolarization. • The ST segment is the line that from the end of the QRS complex to beginning of the T wave. • Normally the ST segment is flat, being neither positive or negative relative to the baseline. BY ROMMEL LUIS C. ISRAEL III 16
  • 17.
    Example What is theheart rate? 60 90 BY ROMMEL LUIS C. ISRAEL III 17
  • 18.
    example What is therhythm? Regular or Irregular? Regular Irregular BY ROMMEL LUIS C. ISRAEL III 18
  • 19.
    example How are theP waves? P wave shape varies Normal BY ROMMEL LUIS C. ISRAEL III 19
  • 20.
    example How are thePR intervals? Long PR interval Normal BY ROMMEL LUIS C. ISRAEL III 20
  • 21.
    example How are theQRS intervals? Wide QRS, bizarre appearance No QRS, bizarre rhythm BY ROMMEL LUIS C. ISRAEL III 21
  • 22.
    example How are theQT intervals? QT intervals are short Normal BY ROMMEL LUIS C. ISRAEL III 22