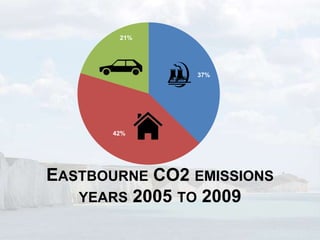
The document presents data on carbon dioxide (CO2) emissions in Eastbourne, UK from 2005 to 2009. It shows that:
1) CO2 emissions in Eastbourne decreased from 505 kilotonnes in 2005 to 458 kilotonnes in 2009.
2) Road transport accounted for the largest share of CO2 emissions in Eastbourne (42% in 2009), followed by domestic emissions (37%) and emissions from industry and commercial sectors (21%).
3) Per capita CO2 emissions in Eastbourne were higher than the national and regional averages for road transport and domestic emissions but lower for industry and commercial emissions.
This document summarizes CO2 emissions data for Lewes, UK between 2005 and 2009. It shows that:
- 37% of Lewes' emissions came from industry and commercial sectors, 36% from domestic uses, and 27% from road transport.
- Lewes' per capita emissions were higher than the national and regional averages, at around 2.5 tonnes per person per year.
- Emissions from domestic uses decreased over time, in line with national trends of reduced gas consumption. Emissions from industry/commercial and road transport remained relatively stable.
1) The document analyzes the global and national mitigation costs of alternative metrics for comparing greenhouse gases like 100-year global warming potentials (GWPs) and global temperature change potentials (GTPs).
2) It finds that while alternative metrics address some issues with GWPs, fixed 100-year GTPs are even less cost-effective than GWPs globally. Time-dependent GTPs that focus on temperature change in 2100 could be more cost-effective.
3) For New Zealand, the economic implications of alternative metrics depend on assumptions about agriculture emissions reductions and global climate policy scenarios more than the metrics alone.
The document summarizes a presentation given by Charlie Brandt on ocean energy and renewable resources. It discusses how population growth and economic activity are increasing global energy demand, particularly in developing nations like China and India. This is driving up coal prices and electricity costs. It then outlines the potential of ocean renewable resources like hydrokinetic, offshore wind, and algal biofuels to provide large amounts of clean energy near coastal demand centers.
Energy the carbon imperative - short versionJohn Shurtz
This document discusses energy and carbon in the context of green building. It begins with an introduction from Dr. Alexandra von Meier on the carbon imperative and sustainability. It then provides information on the natural carbon cycle and current CO2 emissions. Graphs show historical CO2 emissions and targets for reduction. Additional slides define energy, discuss the carbon cycle and combustion, energy resources and quality, energy units, electricity and gas rates, renewable energy challenges, and Chernobyl exclusion zone solar power potential. The document presents information on energy, carbon, and sustainability across multiple topics in a lecture format.
The document summarizes renewable energy development in Germany. It notes that renewable energy targets include achieving 18% of final energy consumption from renewables by 2020, and increasing to 60% by 2050. It also outlines Germany's plan to phase out nuclear energy completely by 2022 following Fukushima. Charts show strong growth in wind, solar PV, and biomass electricity generation due to Germany's feed-in tariff policy. Renewables contributed over 25% of Germany's electricity in 2012 and 10.4% of heat in 2011.
This curriculum vitae outlines the professional experience and qualifications of Eng. Wael Darkazanli. It provides personal details such as contact information, education history including a Master's in Construction Management and Bachelor's in Civil/Structural Engineering. It also lists work experience with companies such as FADEN Trading and Contracting in Saudi Arabia and Redco International in Qatar, describing roles and responsibilities as well as notable projects.
Sebastian and Valentina met while stealing jewelry for their boss and have since needed to work together, developing feelings for each other in the process. Uli and Sol met in school as friends but realized they loved each other and began a relationship, understanding what true love means. Augusto and Francisca are married but do not love each other, with Francisca suffering due to Augusto's irresponsibility and their impending divorce, leaving her wanting a real family. The school teaches that love is life's most important aspect, and though the students each have friends who are not perfect, they share beautiful experiences together.
Sebastian and Valentina met while stealing jewelry for their boss and have since needed to work together, developing feelings for each other in the process. Uli and Sol met in school as friends but realized they loved each other and began a relationship, understanding what true love means. Augusto and Francisca are married but do not love each other, with Francisca suffering due to Augusto's irresponsibility and they are near divorcing, leaving Francisca sad as she wants a real family. Students at St. Bartolome School know love is most important in life and though not all friends are good, they share beautiful experiences together.
The document describes OMNI's TvantageSuite, a talent management software solution. It provides concise overviews and sample reports/views of the suite's main modules: Internal Talent Management, External Talent Management, Interview Management, and Performance Management. The modules allow organizations to match internal talent to jobs, conduct surveys and performance reviews, manage the interview process, and define job profiles to identify and select external talent.
Sebastian and Valentina met while stealing jewelry for their boss and have since needed to work together, developing feelings for each other in the process. Uli and Sol met in school as friends but realized they loved each other and began a relationship, understanding what true love means. Augusto and Francisca are married but do not love each other, with Francisca suffering due to Augusto's irresponsibility and their impending divorce, leaving her wanting a real family. The school teaches that love is life's most important aspect, and though the students each have friends who are not perfect, they share beautiful experiences together.
Twitter is a useful tool for networking, extending one's audience and brand, and researching topics. It allows users to connect with others, gain honest feedback, and frequently update blogs or websites. However, security issues exist, as hackers can see users' tweets even if blocked and take over accounts by guessing passwords. Twitter recommends verifying email addresses and resetting passwords regularly to prevent hacking.
This document provides labor market data for East Sussex, the South East region of England, and Great Britain:
1) The population of East Sussex in 2010 was 515,500 people, with 247,000 males and 268,500 females.
2) Median earnings for full-time male and female workers in East Sussex were lower than the South East and Great Britain averages in 2011.
3) In 2008, the largest employment sectors in East Sussex were distribution, hotels, and restaurants (27%), and public administration, education, and health (24%).
This document discusses creating a virtual classroom space using netbooks. It describes how netbooks can provide resources for different learning styles, allow synchronous learning when students are off campus, and help address the digital divide. Concerns about internet access and behavior standards are also addressed.
The document discusses the local money multiplier effect and how money circulating within a local economy strengthens that economy through jobs, wealth, and well-being. It provides examples comparing the economic impact of hotels versus bed and breakfasts in Tayside, showing that while hotels bring in more initial income, bed and breakfasts recirculate a greater percentage of money within the local economy through local staff, suppliers, and owner spending. Similarly, independent local retailers recirculate a higher percentage of their turnover within the local economy compared to supermarkets, whose profits and supply chains extend beyond the local community. Keeping money circulating within a local area rather than leaving it provides greater economic benefits.
The document discusses SPRL, an automotive parts manufacturer in Delhi, and its initiatives to overcome the economic downturn while maintaining its long-term growth strategy. It outlines SPRL's history and growth trends. Facing challenges like lower bookings, high inflation, and negative cash flow, SPRL implemented initiatives like reducing inventory, improving cash flow, optimizing resources, reducing dependencies, and reorganizing to address the short-term crisis while still pursuing its long-term expansion plans.
The Index of Multiple Deprivation measures poverty and deprivation across seven domains: income, employment, education, health, crime, barriers to housing and services, and living environment. It ranks small areas in England from most to least deprived based on indicators in each domain. Local authorities use the index to identify areas with high levels of deprivation and prioritize allocation of resources and services to disadvantaged neighborhoods and populations.
The document discusses turnover and retention, outlining the difference between wanted and unwanted turnover. It provides a model of the various factors that impact turnover, including economic trends, industry trends, organizational characteristics, leadership and culture, skills development, rewards and recognition, job characteristics, and individual characteristics. Finally, it recommends six key areas to reduce unwanted turnover: early interventions, skill interventions, leadership interventions, rewards/recognition interventions, selection interventions, and job enrichment.
The document discusses national income accounting and how it was developed in response to the Great Depression. It explains how GDP, GNP, and other measures are calculated and what they represent. Specifically, it outlines the three approaches to calculating GDP - output, income, and expenditure - and how GDP is used to measure a country's economic performance and standard of living. However, it also notes some limitations of GDP as an indicator.
The document summarizes CO2 emissions data for Brighton & Hove from 2005 to 2009. It reports that:
1) The target amount of CO2 emissions per person to stabilize climate change is 1 tonne per year. Brighton & Hove residents emitted 4.8 tonnes per person in 2009.
2) Road transport accounted for 27% of end-user CO2 emissions in Brighton & Hove in 2009, while industry and commercial sectors accounted for 43% and the domestic sector accounted for 30%.
3) Emissions vary locally mainly due to economic and geographic differences between areas. The document urges readers to act now on CO2 emissions before it's too late.
Vanessa Haverd_Multiple observation types reduce uncertainty in Australia's t...TERN Australia
The document summarizes the carbon budget of Australia from 1990-2011. It finds that Australia's net biosphere production of 36 ± 35 TgC/year offsets 38% of fossil fuel emissions of 95 ± 6 TgC/year. Gross fire emissions account for 6% of net primary production. Land use change emissions are similar to net fire emissions and account for 1% of net primary production. Fossil fuel exports are approximately 1.5-2.5 times greater than territorial fossil fuel emissions. The interannual variability in net ecosystem production exceeds Australia's total carbon emissions from fossil fuels.
An easily traceable scenario for GHG 80% reduction in Japan for local energy ...Masayuki Horio
To develop a scenario sure and easily traceable even for ordinary citizens toward the national challenge target of 80% CO2 reduction by 2050, we first developed a model to calculate the total CO2 emission corresponding to the final consumption and second developed an appropriate technology based scenario consisting of the following consumer oriented sub-scenarios: (1) energy saving through electrification of all transportation, (2) promotion of wood utilization for housing and household energy saving; (3) introduction of renewable energies; and (4) efficient energy utilization of wastes. Applying the scenario to Kyoto that has the similar strategies to our proposed scenarios, we found that about 80% CO2 emission reduction is possible just within the appropriate technology limit with the effect of population reduction and with the potential emission reduction from construction of private and public infrastructures, and that shifting our final consumption mode into low CO2 emission mode has a significant impact.
Keywords: CO2 emission reduction, appropriate technologies, local energy strategy, the final consumption
Karl Pepple, Director of Environmental Programming with the City of Houston. He reviewed the City of Houston's wastewater treatment energy expenditures and emissions associated with that energy use.
The EPA document discusses greenhouse gas emissions from Ireland's transport sector from 1990 to 2009 and projections to 2020. It finds that transport has been the fastest growing emissions sector since 1990. While Ireland is projected to exceed its annual emissions limits by 2016 without additional measures, the EPA funds transport research and reports emissions to inform policy development and ensure progress towards national targets.
Kids in the Haifa-bay area of Israel are still exposed to high levels of air pollution, according to recent monitoring data from 2006-2009. Industrial emissions and electricity production are major sources of particulate matter and volatile organic compounds in the area. Soil sampling from 2007 also validated long-term exposure to heavy metals from industrial sources. Air samples from schools and neighborhoods in 2007-2008 showed levels of carcinogens like benzene and formaldehyde that exceeded safety limits. Measured dioxin levels were also unusually high. The World Health Organization recognizes causal links between air pollution exposure and adverse health effects in children.
The Post-2020 Cost- Competitiveness of CCScanaleenergia
The document summarizes the key findings of a study on the post-2020 cost competitiveness of carbon capture and storage (CCS) technologies. The study found that:
1) CCS can be technically and cost-competitively applied to both coal and gas power plants.
2) Successful demonstration of CCS technologies through the EU program will validate costs and pave the way for CCS to be competitive with other low-carbon technologies like wind and solar.
3) Strategic planning of large-scale CO2 transport and storage infrastructure is needed to achieve economies of scale and reduce long-term costs of CCS.
Philippe Joubert, Deputy CEO of Alstom, presented on the technology provider’s portfolio of projects around the world. He also discussed challenges for CCS.
This document is a guide for using a map that shows average corrosion rates for zinc coatings across the UK and Ireland from 1998-2000. The map uses color-coded squares to represent five corrosion rate categories ranging from 0.5 to 2.5 micrometers per year. It also provides the minimum galvanized coating thickness required for steelwork and how to calculate the expected life of an 85 micrometer galvanized coating based on the local corrosion rate. It acknowledges organizations that contributed to creating the map and collecting corrosion rate data.
The document discusses arguments around funding and privatization of the UK National Health Service (NHS). It notes that the NHS was created after WWII when the national debt was over double current levels. It questions why the NHS can't be afforded now despite the UK being wealthy. Critics argue funding cuts may be to pave the way for privatization. While the US spends more on healthcare, the UK NHS was ranked the best system by the Commonwealth Fund in 2014 despite lower spending per capita. However, UK health spending as a percentage of GDP is falling. Many NHS trusts are in deficit and some see underfunding as a path to more private involvement in the NHS against public wishes.
Small local businesses struggle to compete against large chains, but can operate as a supportive network through community currencies like the Lewes Pound, which aims to keep jobs, money and wealth circulating within the local Lewes economy rather than leaking out to national suppliers, head offices, nonlocal landlords and shareholders. A workshop hosted by the New Economics Foundation and Community Currencies in Action will discuss ensuring the Lewes Pound is clear in its purpose to support the needs of local Lewes businesses.
East Sussex Health & Social InequalitiesGavin Barker
The document summarizes health inequalities in East Sussex based on a landmark report by Professor Marmot. It finds significant variations in life expectancy, disability-free life expectancy, and social indicators based on area of deprivation. People in the most deprived areas have lower life expectancies, spend more years with disabilities, and face higher rates of unemployment, lower education achievement, and greater receipt of means-tested benefits. The report argues inequalities in income and wealth translate to inequalities in health outcomes, and that doing nothing to address social determinants of health will increase economic and healthcare costs.
A presentation which draws on the evidence of the ground breaking report 'The Spirit Level, to show that levels of high inequality are detrimental to the wellbeing of developed societies across a whole range of indicators, from crime and mental health, to obesity and even teenage pregnancy.
Brighton and Hove has a population of 258,800. The document provides data on earnings, employment by occupation, employee jobs, employment and unemployment rates, and qualifications for Brighton and Hove compared to the South East region and Great Britain. Key findings include that Brighton has higher rates of managers and professionals and public sector employment, lower earnings for women, and more residents with qualifications above NVQ4 level compared to national averages.
The document summarizes health inequalities in Brighton and Hove based on a landmark report. It finds that life expectancy and quality of life vary significantly based on location, with those in deprived areas having lower life expectancies and more years living with disability. Social indicators like child development, employment, benefits receipt, and deprivation levels are predictors of these health outcomes and inequalities. Addressing social determinants of health from early childhood on is necessary to reduce inequalities according to the report.
The document discusses health inequalities in Westminster based on the Marmot report. It finds that those living in the most deprived areas of Westminster have lower life expectancy and disability-free life expectancy compared to those in affluent areas, with inequalities of up to 17 years. Health inequalities largely result from social inequalities, as shown by indicators such as lower rates of childhood development, higher youth unemployment, greater receipt of benefits, and deprivation levels.
This document provides guidance on community enterprise. It outlines types of community enterprises like community centers that provide services to geographical areas. It emphasizes the importance of making an "enterprise leap" from depending on grants to operating as a business through selling goods and services. Key recommendations include carrying out an organizational review, being business minded by understanding markets, securing contracts and income streams, building networks, and working with local authorities. Tools highlighted include online self-assessments, community shares, contracting opportunities, and asset transfers.
You cannot address health inequalities without looking at the social determinants such as education and employment skills. This applies at the individual as well as the neighbourhood level.
Some communities are much better equipped than others to shape the area they live in and to use the new opportunities that the Localism agenda affords to co-design and deliver public services. Whether in terms of human and financial capital or levels of volunteering and prevalence of voluntary organisations, it is the more affluent neighbourhoods and communities that have a head start. If we disregard this fact, the whole localist agenda could inadvertently exacerbate existing inequalities rather than closing the gap.
- There are currently around 215 million international migrants worldwide, comprising 3% of the global population. In 2008, there was a net migration of 163,000 people to the UK.
- Migrants make significant contributions to the UK economy and public services. They account for 38% of UK doctors, 16% of UK nurses, and 40% of new UK dentists. However, concerns are often raised around their impacts on jobs, housing, and public services.
- Studies show migrants do not have significant negative impacts on these areas. They tend to demand less housing than UK-born residents. Their young age means they place relatively low demands on health services. And available evidence suggests they do not
Main Java[All of the Base Concepts}.docxadhitya5119
This is part 1 of my Java Learning Journey. This Contains Custom methods, classes, constructors, packages, multithreading , try- catch block, finally block and more.
A workshop hosted by the South African Journal of Science aimed at postgraduate students and early career researchers with little or no experience in writing and publishing journal articles.
Thinking of getting a dog? Be aware that breeds like Pit Bulls, Rottweilers, and German Shepherds can be loyal and dangerous. Proper training and socialization are crucial to preventing aggressive behaviors. Ensure safety by understanding their needs and always supervising interactions. Stay safe, and enjoy your furry friends!
Assessment and Planning in Educational technology.pptxKavitha Krishnan
In an education system, it is understood that assessment is only for the students, but on the other hand, the Assessment of teachers is also an important aspect of the education system that ensures teachers are providing high-quality instruction to students. The assessment process can be used to provide feedback and support for professional development, to inform decisions about teacher retention or promotion, or to evaluate teacher effectiveness for accountability purposes.
বাংলাদেশের অর্থনৈতিক সমীক্ষা ২০২৪ [Bangladesh Economic Review 2024 Bangla.pdf] কম্পিউটার , ট্যাব ও স্মার্ট ফোন ভার্সন সহ সম্পূর্ণ বাংলা ই-বুক বা pdf বই " সুচিপত্র ...বুকমার্ক মেনু 🔖 ও হাইপার লিংক মেনু 📝👆 যুক্ত ..
আমাদের সবার জন্য খুব খুব গুরুত্বপূর্ণ একটি বই ..বিসিএস, ব্যাংক, ইউনিভার্সিটি ভর্তি ও যে কোন প্রতিযোগিতা মূলক পরীক্ষার জন্য এর খুব ইম্পরট্যান্ট একটি বিষয় ...তাছাড়া বাংলাদেশের সাম্প্রতিক যে কোন ডাটা বা তথ্য এই বইতে পাবেন ...
তাই একজন নাগরিক হিসাবে এই তথ্য গুলো আপনার জানা প্রয়োজন ...।
বিসিএস ও ব্যাংক এর লিখিত পরীক্ষা ...+এছাড়া মাধ্যমিক ও উচ্চমাধ্যমিকের স্টুডেন্টদের জন্য অনেক কাজে আসবে ...
The simplified electron and muon model, Oscillating Spacetime: The Foundation...RitikBhardwaj56
Discover the Simplified Electron and Muon Model: A New Wave-Based Approach to Understanding Particles delves into a groundbreaking theory that presents electrons and muons as rotating soliton waves within oscillating spacetime. Geared towards students, researchers, and science buffs, this book breaks down complex ideas into simple explanations. It covers topics such as electron waves, temporal dynamics, and the implications of this model on particle physics. With clear illustrations and easy-to-follow explanations, readers will gain a new outlook on the universe's fundamental nature.
How to Manage Your Lost Opportunities in Odoo 17 CRMCeline George
Odoo 17 CRM allows us to track why we lose sales opportunities with "Lost Reasons." This helps analyze our sales process and identify areas for improvement. Here's how to configure lost reasons in Odoo 17 CRM
A Strategic Approach: GenAI in EducationPeter Windle
Artificial Intelligence (AI) technologies such as Generative AI, Image Generators and Large Language Models have had a dramatic impact on teaching, learning and assessment over the past 18 months. The most immediate threat AI posed was to Academic Integrity with Higher Education Institutes (HEIs) focusing their efforts on combating the use of GenAI in assessment. Guidelines were developed for staff and students, policies put in place too. Innovative educators have forged paths in the use of Generative AI for teaching, learning and assessments leading to pockets of transformation springing up across HEIs, often with little or no top-down guidance, support or direction.
This Gasta posits a strategic approach to integrating AI into HEIs to prepare staff, students and the curriculum for an evolving world and workplace. We will highlight the advantages of working with these technologies beyond the realm of teaching, learning and assessment by considering prompt engineering skills, industry impact, curriculum changes, and the need for staff upskilling. In contrast, not engaging strategically with Generative AI poses risks, including falling behind peers, missed opportunities and failing to ensure our graduates remain employable. The rapid evolution of AI technologies necessitates a proactive and strategic approach if we are to remain relevant.
1. 21%
37%
42%
EASTBOURNE CO2 EMISSIONS
YEARS 2005 TO 2009
2. Eastbourne CO2 emissions years 2005 to 2009
Kilotonnes CO2 Tonnes per person
600 9
8
500 7
6
400 Road Transport
t CO2
5 Eastbourne
Kt CO2
300 4 England Total
Domestic
3
South East Total
200 2
Industry and
Commercial 1
100
0
- Yr 2005 Yr 2006 Yr 2007 Yr 2008 Yr 2009
Yr 2005 Yr 2006 Yr 2007 Yr 2008 Yr 2009
How does this compare to UK
Eastbourne
•
wide data in 2009?
The number of tonnes 43 per cent of end-user emissions
1 per person per year to assigned to local authority areas
21%
stabilise climate change were attributed to the industry and
37% commercial sector,
The number of tonnes • 30 per cent to the domestic sector
4.63
per person per year • 27 per cent to road transport.
emitted by There are wide local variations on this mainly
42%
Eastbourne residents because of the economy and geography of
different local areas.
3. Eastbourne per capita emissions
2.5
Industry and Commercial
Domestic 2.0
Road Transport
1.5
The number of tonnes per t CO2 1.0
1 person per year to stabilise
climate change
0.5
The number of tonnes per
4.63 person per year emitted by
Eastbourne residents (2009)
-
Yr 2005 Yr 2006 Yr 2007 Yr 2008 Yr 2009
4. Road transport: Eastbourne per capita emissions
compared to England and South East
3
Road transport emissions include
both freight and passenger
2.5
transport, both private and for
business purposes. The estimates
2 are made on the basis of the
distribution of traffic. This means that
t CO2
Eastbourne some of the emissions within an
1.5
England Total authority represent through traffic, or
South East Total part of trips into or out of the area
1
whether by residents or non-
residents.
0.5
0
Yr 2005 Yr 2006 Yr 2007 Yr 2008 yr 2009
5. Domestic CO2 emissions: Eastbourne
compared to England, South East
3
National picture: In 2009, about 47 per
2.5 cent of domestic end-user emissions
arose from gas use, 42 per cent from
electricity, and 10 per cent from
2
consumption of other fuels. Between
2005 and 2009, there was a decrease
t CO2
Eastbourne
1.5 in domestic gas consumption of 16%.
England Total
South East Total
1
0.5
0
Yr 2005 Yr 2006 Yr 2007 Yr 2008 yr 2009
6. Industry and Commercial CO2 emissions:
Eastbourne compared to England, South East
4
3.5
National picture: the industry and
3 commercial sector had the highest
2.5
share of end-user emissions in 43 per
cent of authorities. The domestic sector
t CO2
Eastbourne
2 the highest share in 32 per cent, and
England Total
the road transport sector had the
South East Total 1.5
highest share in 25 per cent of
1 authorities.
0.5
0
Yr 2005 Yr 2006 Yr 2007 Yr 2008 yr 2009
7. Slideshow by Gavin Barker
KEY SOURCES
Click to access source
Dept of Energy and Climate
Change
Local authority subset data
YOU ARE WELCOME TO USE THIS SLIDESHOW TO EMBED IN
YOUR OWN BLOG OR WEBSITE
If you choose to amend or add to this presentation, please delete my name and delete the
background picture for this slideshow (go to View>Slidemaster on the toolbar to replace
slide background with your own image )