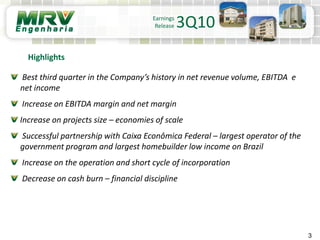
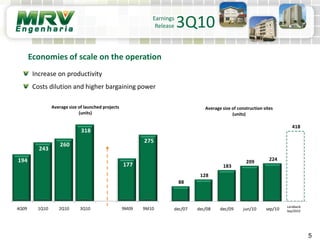
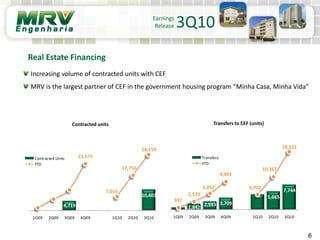
MRV reported its strongest third quarter results in the company's history in terms of net revenue, EBITDA, and net income. Key metrics such as EBITDA margin and net margin increased compared to the prior year. The company also saw increases in average project size, allowing for economies of scale. MRV maintained its position as the largest operator in Brazil's government housing program "Minha Casa Minha Vida" and operator with the largest number of contracted units.
According to the Rishiculture Ashtanga Yoga tradition codified by Yogamaharishi Dr Swami Gitananda Giri, there are six lower and six higher Chakras making a total of twelve Chakras. The lower Chakras known as the Pinda Chakras are related to the physical body while the higher six Chakras, the Anda Chakras are related to the Cosmos. Chakras vibrate at very high speeds of vibration and at their highest speeds of vibration are related to the cosmos. Each of the lower six Chakras has various neuro-endocrine correlates and is associated with one of the five Jnanendriyas and Karmendriyas as also different psychological qualities. This book deals with the Chakras in a detailed manner with magnificent images that were conceptualized by Pujya Swamiji more than 50 years ago. Asanas related to each Chakra and their specific Mandala Pranayamas are elaborated in detail. The unique practices of Chakra Mediation and Mandala Dharana are also added bonuses in this book.
To order this book and others from ICYER at Ananda Ashram, Pondicherry, India please visit www.icyer.inChakras ebook sample
3. 3
Earnings
Release 3Q10
Best third quarter in the Company’s history in net revenue volume, EBITDA e
net income
Increase on EBITDA margin and net margin
Increase on projects size – economies of scale
Successful partnership with Caixa Econômica Federal – largest operator of the
government program and largest homebuilder low income on Brazil
Increase on the operation and short cycle of incorporation
Decrease on cash burn – financial discipline
Highlights
5. Earnings
Release 3Q10
Economies of scale on the operation
Average size of launched projects
(units)
Average size of construction sites
(units)
Increase on productivity
Costs dilution and higher bargaining power
194
243
260
318
177
275
4Q09 1Q10 2Q10 3Q10 9M09 9M10
88
128
183
209 224
418
dec/07 dec/08 dec/09 jun/10 sep/10
Landbank
Sep/2010
5
6. Earnings
Release 3Q10
Transfers to CEF (units)
Real Estate Financing
Increasing volume of contracted units with CEF
MRV is the largest partner of CEF in the government housing program “Minha Casa, Minha Vida”
6
Contracted units
1,842
2,553 3,709
5,665
7,744
697
2,539
5,092
8,801
4,702
10,367
18,111
1Q09 2Q09 3Q09 4Q09 1Q10 2Q10 3Q10
Transfers
YTD
4,719
10,403
23,575
7,016
17,756
28,159
1Q09 2Q09 3Q09 4Q09 1Q10 2Q10 3Q10
Contracted Units
YTD
7. Earnings
Release 3Q10
Land bank
Quick turnover of land bank
Operating cycle shorter than the industry average
Age of launched lands
(number of projects)
60%
52%
70%
10%
0%
7%
30%
48%
23%
0%
10%
20%
30%
40%
50%
60%
70%
80%
90%
100%
1Q10 2Q10 3Q10
Up to 12 months Between 13 and 18 months Above 19 months
7
8. 100.6
123.8
0.1
89.8 75.9
133.3
108.6
60.0
26.1
19.4
1Q09 2Q09 3Q09 4Q09 1Q10 2Q10 3Q10
MRV Engenharia Effects of CEF process MRV LOG
Earnings
Release 3Q10
Cash Burn
Change in Net Debt
(R$ million)
8
Constant financial discipline and
Shorter operational cycle determine decreasing cash burn
9. 9
Land Bank
Launches
Contracted Sales
Inventories at Market Value
Production
Productivity Index
Indebtedness and Net Debt
Unearned Results
Guidance
Operational and Financial
Performance 3Q10
Operational and Financial Performance
10. ... On September 30, 2010:
•127 thousand potential units
• Average price of R$97.8 thousand (focus on low
income)
• 418 units per construction site (average)
•Increase on land bank to attend the strong and
increasing demand
... by financing source Sep/10% swap / land cost % land cost/ PSV
10
Operational and Financial
Performance
Land Bank (%MRV)
Land Bank %MRV (R$ billion)
3Q10
Swap
43% FGTS
96%
SBPE
4%
8,991.2
10,614.1 10,923.0 11,347.3
12,422.0
dec/08 dec/09 mar/10 jun/10 sep/10
Cabral– Sep/08
7,009 units
Mauá – Mar/08
3,119 units
Cost
9.2%
11. ... by price range in 3Q10
Operational and Financial
Performance
11
3Q10
... by financing source in 3Q10
... in 3Q10
• Launches of 42 new projects
• PSV of R$1.033 million – 11,122 units
• 83% of the launched units are eligible to MCMV
• Launches in 8 states and 24 cities
Launches (%MRV)
Launches %MRV (in R$ million)
650.8
1,032.9
1,533.4
2,752.1
3Q09 3Q10 9M09 9M10
58.7%
79.5%
Below
R$80,000
11%
R$80,001to
R$130,000
86%
Over
R$130,000
3%
FGTS
83%
SBPE
17%
12. 12
Operational and Financial
Performance 3Q10
Contracted Sales (%MRV)
... in 3Q10
• Total sales of R$889.7 million
• 8,557 sold units
• Sales over Supply of 33%
• Sales in 14 states + DF and 62 cities
Contracted Sales%MRV (em R$ milhões)
... by price range in 3Q10
... by financing source in 3Q10
789.4 889.7
2,070.9
2,604.4
3Q09 3Q10 9M09 9M10
12.7%
25.8%
FGTS
71%
SBPE
29%
Até
R$80.000
8%
De R$80.001 a
R$130.000
73%
Acima de
R$130.000
19%
13. 13
Inventory distribution of units for sale
per construction phase as of Sep/30/10
Inventory at Market Value 09/30/10 = R$ 1.8 billion
Inventory distribution of units for sale
per financing source as of Sep/30/10
Operational and Financial
Performance 3Q10
Inventory at Market Value (%MRV)
56%
43%
1%
Notiniciated
Under construction
Finished
FGTS
92%
SBPE
8%
14. 14
Units produced
Operational and Financial
Performance 3Q10
Production
2,800
4,300 4,000
5,000
6,500
7,400
9,600
18,800
-
0
0
0
0
0
0
0
0
0
0
2Q09 3Q09 4Q09 1Q10 2Q10 3Q10 9M09 9M10
72.1%
95.8%
Work force evolution
09/30/09 09/30/10
Construction sites 201 255
Units per site 181 224
# employees for construction 12,422 23,882
Engineering Staff 480 680
15. Selling Expenses
(R$ million)
Selling Expenses / Contracted Sales %MRV (%)
and Selling Expenses / Net Revenue (%)
15
Operational and Financial
Performance 3Q10
Productivity Index
... in 3Q10
• 30% of contracted sales via internet
• The most visited website among
homebuilders in Brazil – 14.7 million (9M10)
• 2,500 brokers (internal and outsourced)
25.6
40.3
73.4
110.3
3Q09 3Q10 9M09 9M10
57.5%
50.2%
5.7%
4.6%
6.6%
5.1%
3.2%
4.5%
3.5% 4.2%
3Q09 3Q10 9M09 9M10
%NetRevenue
% Sales
16. G&A Expenses
(R$ million)
G&A Expenses / Contracted Sales %MRV (%)
and G&A Expenses / Net Revenue (%)
16
Operational and Financial
Performance 3Q10
Productivity Index
... in 3Q10
• Continued investments in IT
• Shared Service Centre – productivity and cost
reduction
BPM ECM GED
Cognos (Planning) SAP - BO (Cube) Microsoft (Report)
BI - Business Inteligence
RM - HR Management
Microsoft Dynamics
Microsoft Sharepoint
ECM - Content Management
ERP
Portal Colaboration
SAP ECC 6.0
MRV Obras
CRM
Client Relationship Management
27.2
40.7
70.3
107.3
3Q09 3Q10 9M09 9M10
49.8%
52.5%
6.0%
4.6%
6.3%
5.0%
3.4%
4.6%
3.4%
4.1%
3Q09 3Q10 9M09 9M10
%Net Revenue
%Sales
17. 17
Debt Maturity Schedule
Loans and Financing and Net Debt
Operational and Financial
Performance 3Q10
Composition of the Indebtedness Net Debt
180.1
99.5
357.9
257.8
310.1
268.2
113.4
4.7
12 meses 13 a 24 meses 25 a 36 meses 37 meses em diante
Debenture Loans - Financing
(R$ million) set/10 jun/10 Var. %
Total debt 1,591.8 1,432.3 11.1% ↑
(-) Cash and cash equivalents (1,013.7) (982.2) 3.2% ↑
Net Debt 578.2 450.1 28.4% ↑
Shareholder's Equity 2,880.4 2,663.3 8.2% ↑
Net Debt / Shareholder's Equity 20.1% 16.9% 3.2 p.p. ↑
sep/10 jun/10
Debentures - 1st Issuance
1st series 06/15/2013 CDI + 1.5% p.a. 280.9 272.7
2nd series 06/15/2013 IPCA+ 10.8% p.a. 32.7 31.9
Debentures - 2nd Issuance 05/25/2011 CDI + 3.7% p.a. 60.8 81.0
Debentures - 3rd Issuance 2/1/2014 CDI + 1.6% p.a. 526.6 538.3
Construction Finance 10/06/2011 to 11/30/2013 TR + 8% to 12% p.a. 460.6 409.4
Working capital – CDI 10/04/2010 to 08/09/2013 CDI + 1.02% to 2.18% p.a. 229.7 99.0
Others 6.2 6.3
Expenses from debenture's issuance (5.6) (6.3)
1,591.8 1,432.3
(R$ million) Maturity Charges
Balance Due
18. 18
Unearned Results
Operational and Financial
Performance 3Q10
(R$ million) jun/10 mar/10 Var. %
Unearned Sales Revenues 2,809.9 3,058.2 8.1% ↓
(-) Unearned Costs of Units Sold (1,461.6) (1,590.9) 8.1% ↓
Unearned Results 1,348.3 1,467.3 8.1% ↓
Unearned Results Margin 48.0% 48.0% 0.0 p.p. ↑
19. 19
Guidance 2010
Operational and Financial
Performance 3Q10
Guidance 2010 Previous Revised
Contracted Sales (%MRV) - R$ million 3,700 ~ 4,300 3,700 ~ 4,300
EBITDA Margin* 25% ~ 28% 26% ~ 29%
* according to the accounting practices of 2009
20. 20
Disclaimer
Earnings
Release 3Q10
The material that follows is a presentation of general background information about MRV Engenharia e Participações S.A. and its
subsidiaries (collectively, “MRV” or the “Company”) as of the date of the presentation. It is information in summary form and does
not purport to be complete. No representation or warranty, express or implied, is made concerning, and no reliance should be
placed on, the accuracy, fairness, or completeness of this information.
This presentation may contain certain forward-looking statements and information relating to MRV that reflect the current views
and/or expectations of the Company and its management with respect to its performance, business and future events. Forward
looking statements include, without limitation, any statement that may predict, forecast, indicate or imply future results,
performance or achievements, and may contain words like “believe,” “anticipate,” “expect,” “envisages,” “will likely result,” or any
other words or phrases of similar meaning. Such statements are subject to a number of risks, uncertainties and assumptions. We
caution you that a number of important factors could cause actual results to differ materially from the plans, objectives,
expectations, estimates and intentions expressed in this presentation. In no event, neither the Company nor any of its affiliates,
directors, officers, agents or employees shall be liable before any third party (including investors) for any investment or business
decision made or action taken in reliance on the information and statements contained in this presentation or for any
consequential, special or similar damages.
This presentation does not constitute an offer, or invitation, or solicitation of an offer to purchase any securities. Neither this
presentation nor anything contained herein shall form the basis of any contract or commitment whatsoever.
The market and competitive position data, including market forecasts, used throughout this presentation was obtained from internal
surveys, market research, publicly available information and industry publications. Although we have no reason to believe that any
of this information or these reports are inaccurate in any material respect, we have not independently verified the competitive
position, market share, market size, market growth or other data provided by third parties or by industry or other publications. MRV
does not make any representation as to the accuracy of such information.
This presentation and its contents are proprietary information and may not be reproduced or otherwise disseminated in whole or in
part without MRV’s prior written consent.