Download to read offline
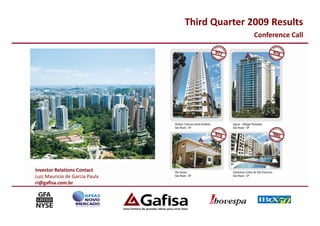
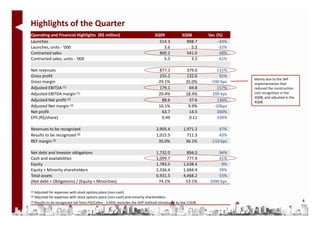
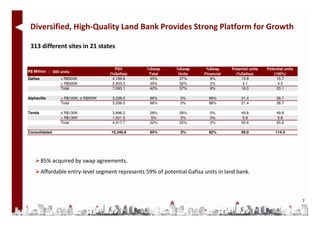
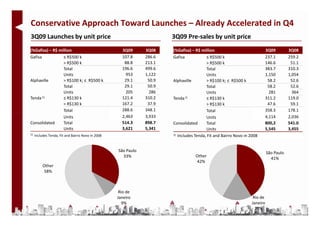
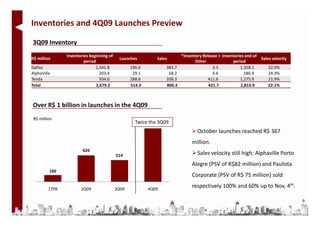
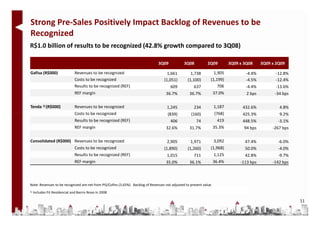

- The document summarizes Gafisa's third quarter 2009 results conference call. - Key highlights include a 43% decrease in launches but a 48% increase in contracted sales compared to the previous year. Net revenues increased 131% while gross margins decreased. - Recent developments discussed include strong sales in mid-to-mid-high segments, expansion of the affordable housing program, and plans to merge shares of Tenda into Gafisa to increase scale and efficiency. - Gafisa has a diversified land bank of 313 sites in 21 states representing over 15 billion reais in potential sales.


