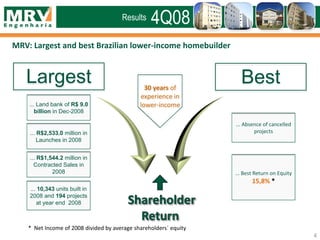
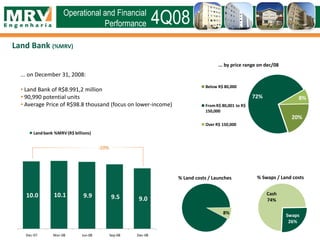
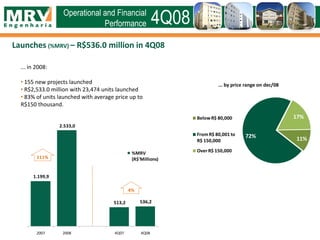
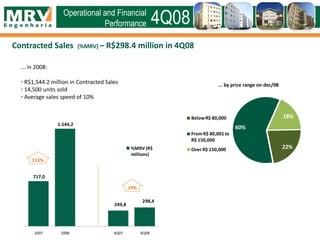
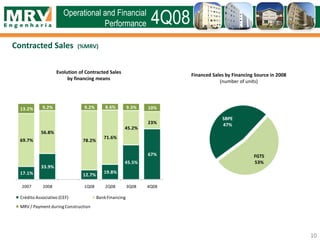
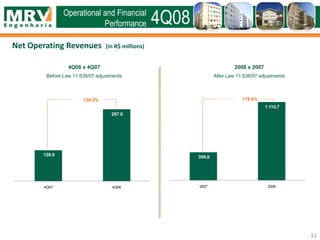
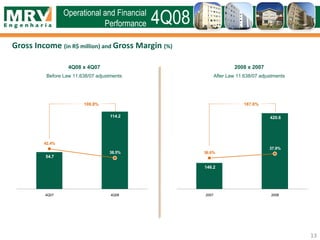
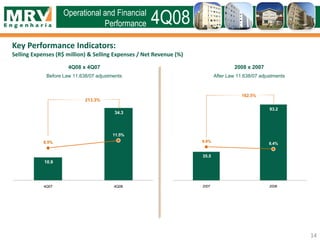
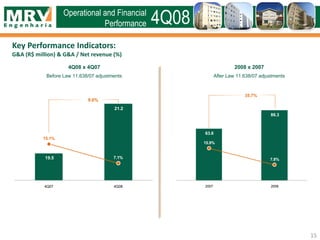
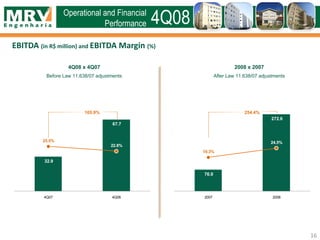
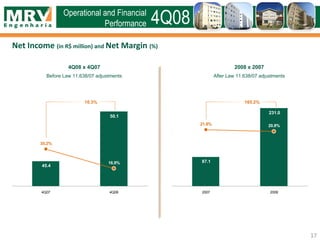
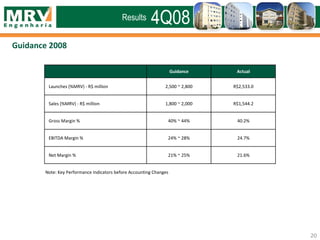
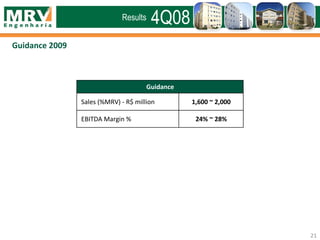
4Q08 Results
March 26, 2009
Comments
4Q08Results
Recent Events
MRV Rating
• Standard and Poor’s: brA+/stable – Best rating in the Brazilian real estate sector...
ADR Program
• Depositary Bank: Deutsche Bank Trust Company Americas
• Program Type : Level 1
• Market: United States of America
• Ratio of Shares per ADR: 2 MRVE3 for 1 ADR
Debentures
• Insurance – Small premium compared to security/liquidity
Accounting changes Law 11.638/07: Uniformity = Transparency
Government Package
• Caixa Econômica Federal (CEF) is the executor of the government’s housing policy
• Partnership
3
4Q08Results
MRV: Largest and best Brazilian lower-income homebuilder
30 years of
experience in
lower-income
... Absence of cancelled
projects
BestLargest
... Best Return on Equity
15,8% *
... Land bank of R$ 9.0
billion in Dec-2008
... R$2,533.0 million in
Launches in 2008
... R$1,544.2 million in
Contracted Sales in
2008
4
... 10,343 units built in
2008 and 194 projects
at year end 2008
* Net Income of 2008 divided by average shareholders´ equity
4Q08Results
Operational and Financial Performance
4Q08Results
Land Bank
Launches
Contracted Sales
Net Operating Revenues
Gross Income
Key Performance Indicators
EBITDA
Net Income
Indebtedness
Guidance
8%
Operational and Financial
Performance 4Q08
... by price range on dec/08
% Swaps / Land costs% Land costs / Launches
... on December 31, 2008:
• Land Bank of R$8.991,2 million
• 90,990 potential units
• Average Price of R$98.8 thousand (focus on lower-income)
Land Bank (%MRV)
10.0 10.1 9.9 9.5 9.0
Dec-07 Mar-08 Jun-08 Sep-08 Dec-08
Landbank %MRV(R$ billions)
-10%
Swaps
26%
Cash
74%
20%
72% 8%
Below R$ 80,000
FromR$ 80,001 to R$
150,000
Over R$ 150,000
... in 2008:
• 155 new projects launched
• R$2,533.0 million with 23,474 units launched
• 83% of units launched with average price up to
R$150 thousand.
Launches (%MRV) – R$536.0 million in 4Q08
Operational and Financial
Performance 4Q08
... by price range on dec/08
1.199,9
2.533,0
513,2 536,2
2007 2008 4Q07 4Q08
%MRV
(R$'Millions)111%
4%
11%72%
17%BelowR$ 80,000
FromR$ 80,001 to
R$ 150,000
Over R$ 150,000
Launches (%MRV)
8
Evolution of Launches
by financing means
4Q08Operational and Financial
Performance
Launches by Financing Source in 2008
(number of units)
28.5%
78.4%
57.9%
79.0%
88.2% 92.7%
71.5%
21.6%
42.1%
21.0%
11.8% 7.3%
2007 2008 1Q08 2Q08 3Q08 4Q08
Crédito Associativo (CEF) BankFinancing
FGTS
52%
SBPE
48%
... in 2008:
• R$1,544.2 million in Contracted Sales
• 14,500 units sold
• Average sales speed of 10%
Contracted Sales (%MRV) – R$298.4 million in 4Q08
Operational and Financial
Performance 4Q08
... by price range on dec/08
717,0
1.544,2
249,8
298,4
2007 2008 4Q07 4Q08
%MRV(R$
millions)
115%
19%
22%
60%
18%BelowR$ 80,000
FromR$ 80,001 to
R$ 150,000
Over R$ 150,000
Contracted Sales (%MRV)
Evolution of Contracted Sales
by financing means
10
4Q08
17.1%
33.9%
12.7%
19.8%
45.5%
67%
69.7%
56.8%
78.2%
71.6%
45.2%
23%
13.2% 9.2% 9.2% 8.6% 9.3% 10%
2007 2008 1Q08 2Q08 3Q08 4Q08
Crédito Associativo (CEF) BankFinancing
MRV / Payment duringConstruction
Operational and Financial
Performance
Financed Sales by Financing Source in 2008
(number of units)
FGTS
53%
SBPE
47%
Inventory at market value on 12/31/08 = R$ 1.7 billion
Inventory distribution of units for sale
in Dec/08 per construction phase
56%
42%
2%
Construction not
initiated
Under construction
Finished Units
Inventory at Market Value (%MRV)
11
4Q08Operational and Financial
Performance
Net Operating Revenues (in R$ millions)
Operational and Financial
Performance 4Q08
4Q08 x 4Q07
Before Law 11.638/07 adjustments
2008 x 2007
After Law 11.638/07 adjustments
12
128.9
297.0
4Q07 4Q08
130.3%
399,6
1.110,7
2007 2008
178.0%
Gross Income (in R$ million) and Gross Margin (%)
Operational and Financial
Performance 4Q08
4Q08 x 4Q07
Before Law 11.638/07 adjustments
2008 x 2007
After Law 11.638/07 adjustments
54.7
114.2
42.4%
38.5%
4Q07 4Q08
108.8%
146.2
420.6
36.6%
37.9%
2007 2008
187.8%
13
Key Performance Indicators:
Selling Expenses (R$ million) & Selling Expenses / Net Revenue (%)
Operational and Financial
Performance 4Q08
4Q08 x 4Q07
Before Law 11.638/07 adjustments
2008 x 2007
After Law 11.638/07 adjustments
14
10.9
34.3
8.5%
11.5%
4Q07 4Q08
213.3%
35.5
93.2
8.9%
8.4%
2007 2008
162.5%
Operational and Financial
Performance 4Q08
Key Performance Indicators:
G&A (R$ million) & G&A / Net revenue (%)
4Q08 x 4Q07
Before Law 11.638/07 adjustments
2008 x 2007
After Law 11.638/07 adjustments
15
19.5
21.2
15.1%
7.1%
4Q07 4Q08
9.0%
63.6
86.3
15.9%
7.8%
2007 2008
35.7%
EBITDA (in R$ million) and EBITDA Margin (%)
Operational and Financial
Performance 4Q08
4Q08 x 4Q07
Before Law 11.638/07 adjustments
2008 x 2007
After Law 11.638/07 adjustments
76.9
272.6
19.3%
24.5%
2007 2008
254.4%
32.9
67.7
25.5%
22.8%
4Q07 4Q08
105.9%
16
Net Income (in R$ million) and Net Margin (%)
Operational and Financial
Performance 4Q08
4Q08 x 4Q07
Before Law 11.638/07 adjustments
2008 x 2007
After Law 11.638/07 adjustments
45.4
50.1
35.2%
16.9%
4Q07 4Q08
10.3%
17
87.1
231.0
21.8% 20.8%
2007 2008
165.2%
Unearned Results
Operational and Financial
Performance 4Q08
18
in R$ million
Dec/2008 Sep/2008
Unearned Sales Revenue 991,6 892,9
(-) Unearned Cost of Units Sold (505,8) (454,0)
Unearned Results 485,8 438,9
Unearned Margin (%) 49,0% 49,2%
Cash and Indebtedness
Operational and Financial
Performance 4Q08
68,3
56,9
104,0 100,2 100,0
2009 2010 2011 2012 2013
Debt Maturity Schedule
Total Construction Financing
contracted in 2008 = R$ 390 million
Withdrawn during the year = R$ 94 million
19
in R$ million
Dec/2008
Debenture 304.3
Construction Financing 95.0
Other 30.1
Total Debt 429.5
(-) Cash and cash equivalents 150.1
Net Debt 279.4
Net Debt / Equity 18.0%
Guidance 2008
20
Guidance Actual
Launches (%MRV) - R$ million 2,500 ~ 2,800 R$2,533.0
Sales (%MRV) - R$ million 1,800 ~ 2,000 R$1,544.2
Gross Margin % 40% ~ 44% 40.2%
EBITDA Margin % 24% ~ 28% 24.7%
Net Margin % 21% ~ 25% 21.6%
Note: Key Performance Indicators before Accounting Changes
4Q08Results
Guidance 2009
21
Guidance
Sales (%MRV) - R$ million 1,600 ~ 2,000
EBITDA Margin % 24% ~ 28%
4Q08Results
This release contains forward-looking statements that are not merely historical facts but reflect the goals and
expectations of MRV Engenharia’s management. Words such as “anticipates”, “believes”, “may”, “will”, “expects”,
“intends”, “plans”, “estimates” or similar expressions are forward-looking statements. Though we believe that
these forward-looking statements are based on reasonable assumptions, they are subject to risks and
uncertainties, and are based on information currently available with MRV Engenharia. This presentation is current
as of end 3Q08 and MRV Engenharia takes no responsibility to update it with new information and/or forward-
looking statements. MRV Engenharia is not responsible for investments or investment decisions based on
information contained in this presentation.
EBITDA, in accordance with CVM Circular Letter 1/2005, may be defined as income before net financial revenue
(expense), income tax and social contribution, depreciation and amortization and non-operating results. EBITDA is
used as a way of measuring the performance by the Company’s management, and is not a measure adopted by
the Brazilian or U.S. Accounting Practices, does not represent the cash flow for the periods presented and should
not be considered as a substitute for net income, MRV’s operating performance indicator or cash flow substitute,
or liquidity indicator.
MRV’s management believes that EBITDA is a practical measure to assess its operating performance and allow for
a comparison with other peer companies. However, it is important to highlight that EBITDA is not a measure
established according to the Brazilian Accounting Practices (Corporation Law or BR GAAP) or U.S. Accounting
Principles (US GAAP) and may be defined and calculated otherwise by other companies.
Disclaimer
4Q08Results
Leonardo Corrêa
Executive Vice President & Chief Officer for Finances and Investor Relations
Mônica Simão
Financial Director
Tel.: +55 (31) 3348-7150
E-mail: ri@mrv.com.br
www.mrv.com.br/ri
Contacts
4Q08Results

Earnings Release Presentation - Fourth Quarter 2008 (4Q08).

  • 1.
  • 2.
  • 3.
    Recent Events MRV Rating •Standard and Poor’s: brA+/stable – Best rating in the Brazilian real estate sector... ADR Program • Depositary Bank: Deutsche Bank Trust Company Americas • Program Type : Level 1 • Market: United States of America • Ratio of Shares per ADR: 2 MRVE3 for 1 ADR Debentures • Insurance – Small premium compared to security/liquidity Accounting changes Law 11.638/07: Uniformity = Transparency Government Package • Caixa Econômica Federal (CEF) is the executor of the government’s housing policy • Partnership 3 4Q08Results
  • 4.
    MRV: Largest andbest Brazilian lower-income homebuilder 30 years of experience in lower-income ... Absence of cancelled projects BestLargest ... Best Return on Equity 15,8% * ... Land bank of R$ 9.0 billion in Dec-2008 ... R$2,533.0 million in Launches in 2008 ... R$1,544.2 million in Contracted Sales in 2008 4 ... 10,343 units built in 2008 and 194 projects at year end 2008 * Net Income of 2008 divided by average shareholders´ equity 4Q08Results
  • 5.
    Operational and FinancialPerformance 4Q08Results Land Bank Launches Contracted Sales Net Operating Revenues Gross Income Key Performance Indicators EBITDA Net Income Indebtedness Guidance
  • 6.
    8% Operational and Financial Performance4Q08 ... by price range on dec/08 % Swaps / Land costs% Land costs / Launches ... on December 31, 2008: • Land Bank of R$8.991,2 million • 90,990 potential units • Average Price of R$98.8 thousand (focus on lower-income) Land Bank (%MRV) 10.0 10.1 9.9 9.5 9.0 Dec-07 Mar-08 Jun-08 Sep-08 Dec-08 Landbank %MRV(R$ billions) -10% Swaps 26% Cash 74% 20% 72% 8% Below R$ 80,000 FromR$ 80,001 to R$ 150,000 Over R$ 150,000
  • 7.
    ... in 2008: •155 new projects launched • R$2,533.0 million with 23,474 units launched • 83% of units launched with average price up to R$150 thousand. Launches (%MRV) – R$536.0 million in 4Q08 Operational and Financial Performance 4Q08 ... by price range on dec/08 1.199,9 2.533,0 513,2 536,2 2007 2008 4Q07 4Q08 %MRV (R$'Millions)111% 4% 11%72% 17%BelowR$ 80,000 FromR$ 80,001 to R$ 150,000 Over R$ 150,000
  • 8.
    Launches (%MRV) 8 Evolution ofLaunches by financing means 4Q08Operational and Financial Performance Launches by Financing Source in 2008 (number of units) 28.5% 78.4% 57.9% 79.0% 88.2% 92.7% 71.5% 21.6% 42.1% 21.0% 11.8% 7.3% 2007 2008 1Q08 2Q08 3Q08 4Q08 Crédito Associativo (CEF) BankFinancing FGTS 52% SBPE 48%
  • 9.
    ... in 2008: •R$1,544.2 million in Contracted Sales • 14,500 units sold • Average sales speed of 10% Contracted Sales (%MRV) – R$298.4 million in 4Q08 Operational and Financial Performance 4Q08 ... by price range on dec/08 717,0 1.544,2 249,8 298,4 2007 2008 4Q07 4Q08 %MRV(R$ millions) 115% 19% 22% 60% 18%BelowR$ 80,000 FromR$ 80,001 to R$ 150,000 Over R$ 150,000
  • 10.
    Contracted Sales (%MRV) Evolutionof Contracted Sales by financing means 10 4Q08 17.1% 33.9% 12.7% 19.8% 45.5% 67% 69.7% 56.8% 78.2% 71.6% 45.2% 23% 13.2% 9.2% 9.2% 8.6% 9.3% 10% 2007 2008 1Q08 2Q08 3Q08 4Q08 Crédito Associativo (CEF) BankFinancing MRV / Payment duringConstruction Operational and Financial Performance Financed Sales by Financing Source in 2008 (number of units) FGTS 53% SBPE 47%
  • 11.
    Inventory at marketvalue on 12/31/08 = R$ 1.7 billion Inventory distribution of units for sale in Dec/08 per construction phase 56% 42% 2% Construction not initiated Under construction Finished Units Inventory at Market Value (%MRV) 11 4Q08Operational and Financial Performance
  • 12.
    Net Operating Revenues(in R$ millions) Operational and Financial Performance 4Q08 4Q08 x 4Q07 Before Law 11.638/07 adjustments 2008 x 2007 After Law 11.638/07 adjustments 12 128.9 297.0 4Q07 4Q08 130.3% 399,6 1.110,7 2007 2008 178.0%
  • 13.
    Gross Income (inR$ million) and Gross Margin (%) Operational and Financial Performance 4Q08 4Q08 x 4Q07 Before Law 11.638/07 adjustments 2008 x 2007 After Law 11.638/07 adjustments 54.7 114.2 42.4% 38.5% 4Q07 4Q08 108.8% 146.2 420.6 36.6% 37.9% 2007 2008 187.8% 13
  • 14.
    Key Performance Indicators: SellingExpenses (R$ million) & Selling Expenses / Net Revenue (%) Operational and Financial Performance 4Q08 4Q08 x 4Q07 Before Law 11.638/07 adjustments 2008 x 2007 After Law 11.638/07 adjustments 14 10.9 34.3 8.5% 11.5% 4Q07 4Q08 213.3% 35.5 93.2 8.9% 8.4% 2007 2008 162.5%
  • 15.
    Operational and Financial Performance4Q08 Key Performance Indicators: G&A (R$ million) & G&A / Net revenue (%) 4Q08 x 4Q07 Before Law 11.638/07 adjustments 2008 x 2007 After Law 11.638/07 adjustments 15 19.5 21.2 15.1% 7.1% 4Q07 4Q08 9.0% 63.6 86.3 15.9% 7.8% 2007 2008 35.7%
  • 16.
    EBITDA (in R$million) and EBITDA Margin (%) Operational and Financial Performance 4Q08 4Q08 x 4Q07 Before Law 11.638/07 adjustments 2008 x 2007 After Law 11.638/07 adjustments 76.9 272.6 19.3% 24.5% 2007 2008 254.4% 32.9 67.7 25.5% 22.8% 4Q07 4Q08 105.9% 16
  • 17.
    Net Income (inR$ million) and Net Margin (%) Operational and Financial Performance 4Q08 4Q08 x 4Q07 Before Law 11.638/07 adjustments 2008 x 2007 After Law 11.638/07 adjustments 45.4 50.1 35.2% 16.9% 4Q07 4Q08 10.3% 17 87.1 231.0 21.8% 20.8% 2007 2008 165.2%
  • 18.
    Unearned Results Operational andFinancial Performance 4Q08 18 in R$ million Dec/2008 Sep/2008 Unearned Sales Revenue 991,6 892,9 (-) Unearned Cost of Units Sold (505,8) (454,0) Unearned Results 485,8 438,9 Unearned Margin (%) 49,0% 49,2%
  • 19.
    Cash and Indebtedness Operationaland Financial Performance 4Q08 68,3 56,9 104,0 100,2 100,0 2009 2010 2011 2012 2013 Debt Maturity Schedule Total Construction Financing contracted in 2008 = R$ 390 million Withdrawn during the year = R$ 94 million 19 in R$ million Dec/2008 Debenture 304.3 Construction Financing 95.0 Other 30.1 Total Debt 429.5 (-) Cash and cash equivalents 150.1 Net Debt 279.4 Net Debt / Equity 18.0%
  • 20.
    Guidance 2008 20 Guidance Actual Launches(%MRV) - R$ million 2,500 ~ 2,800 R$2,533.0 Sales (%MRV) - R$ million 1,800 ~ 2,000 R$1,544.2 Gross Margin % 40% ~ 44% 40.2% EBITDA Margin % 24% ~ 28% 24.7% Net Margin % 21% ~ 25% 21.6% Note: Key Performance Indicators before Accounting Changes 4Q08Results
  • 21.
    Guidance 2009 21 Guidance Sales (%MRV)- R$ million 1,600 ~ 2,000 EBITDA Margin % 24% ~ 28% 4Q08Results
  • 22.
    This release containsforward-looking statements that are not merely historical facts but reflect the goals and expectations of MRV Engenharia’s management. Words such as “anticipates”, “believes”, “may”, “will”, “expects”, “intends”, “plans”, “estimates” or similar expressions are forward-looking statements. Though we believe that these forward-looking statements are based on reasonable assumptions, they are subject to risks and uncertainties, and are based on information currently available with MRV Engenharia. This presentation is current as of end 3Q08 and MRV Engenharia takes no responsibility to update it with new information and/or forward- looking statements. MRV Engenharia is not responsible for investments or investment decisions based on information contained in this presentation. EBITDA, in accordance with CVM Circular Letter 1/2005, may be defined as income before net financial revenue (expense), income tax and social contribution, depreciation and amortization and non-operating results. EBITDA is used as a way of measuring the performance by the Company’s management, and is not a measure adopted by the Brazilian or U.S. Accounting Practices, does not represent the cash flow for the periods presented and should not be considered as a substitute for net income, MRV’s operating performance indicator or cash flow substitute, or liquidity indicator. MRV’s management believes that EBITDA is a practical measure to assess its operating performance and allow for a comparison with other peer companies. However, it is important to highlight that EBITDA is not a measure established according to the Brazilian Accounting Practices (Corporation Law or BR GAAP) or U.S. Accounting Principles (US GAAP) and may be defined and calculated otherwise by other companies. Disclaimer 4Q08Results
  • 23.
    Leonardo Corrêa Executive VicePresident & Chief Officer for Finances and Investor Relations Mônica Simão Financial Director Tel.: +55 (31) 3348-7150 E-mail: ri@mrv.com.br www.mrv.com.br/ri Contacts 4Q08Results