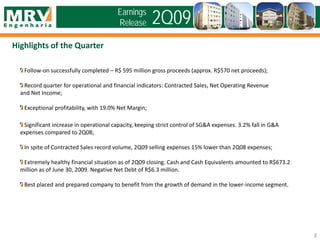
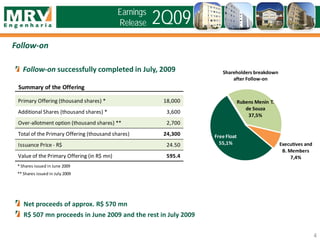
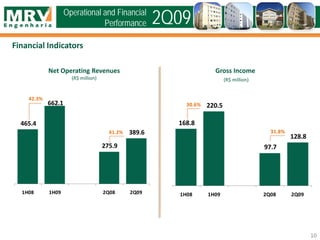
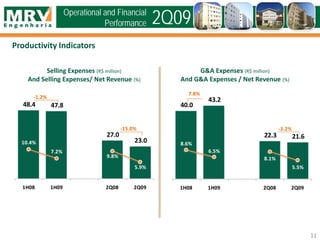
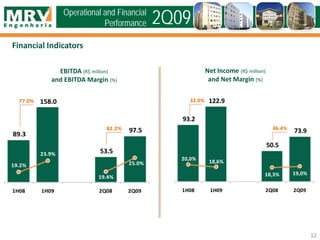
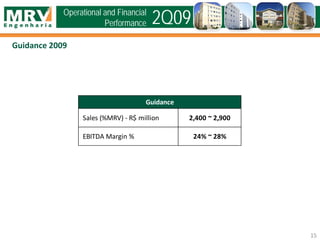
Earnings Release 2Q09
August 17, 2009
2Q09
Comments
Earnings
Release
2
Rubens Menin
Highlights of the Quarter
3
2Q09Earnings
Release
Follow-on successfully completed – R$ 595 million gross proceeds (approx. R$570 net proceeds);
Record quarter for operational and financial indicators: Contracted Sales, Net Operating Revenue
and Net Income;
Exceptional profitability, with 19.0% Net Margin;
Significant increase in operational capacity, keeping strict control of SG&A expenses. 3.2% fall in G&A
expenses compared to 2Q08;
In spite of Contracted Sales record volume, 2Q09 selling expenses 15% lower than 2Q08 expenses;
Extremely healthy financial situation as of 2Q09 closing. Cash and Cash Equivalents amounted to R$673.2
million as of June 30, 2009. Negative Net Debt of R$6.3 million.
Best placed and prepared company to benefit from the growth of demand in the lower-income segment.
Follow-on
4
2Q09
Follow-on successfully completed in July, 2009
Net proceeds of approx. R$ 570 mn
R$ 507 mn proceeds in June 2009 and the rest in July 2009
Shareholders breakdown
after Follow-on
Earnings
Release
Free Float
55,1%
Rubens Menin T.
de Souza
37,5%
Executives and
B. Members
7,4%
Summary of the Offering
Primary Offering (thousand shares) * 18,000
Additional Shares (thousand shares) * 3,600
Over-allotment option (thousand shares) ** 2,700
Total of the Primary Offering (thousand shares) 24,300
Issuance Price - R$ 24.50
Value of the Primary Offering (in R$ mn) 595.4
* Shares issued in June 2009
** Shares issued in July 2009
Operational and Financial Performance
Land bank
Launches
Contracted Sales
Net Operating Revenue
Gross Income
Productivity Indicators
EBITDA
Net Income
Loans and Financing and Net Debt
Unearned results
Guidance
5
2Q09Earnings
Release
... by Financing Source in Jun/09
% of swaps / land acquisition cost% of land acquisition cost/ PSV
... On June 30, 2009:
• Land bank of R$8,377.2 million
• 85,669 potential units
• Average Price of R$97.8 thousand (focus on lower-income segment)
Land Bank (%MRV)
6
Operational and Financial
Performance 2Q09
75%
25%
MinhaCasa, Minha Vida
SFH - SBPE
8%
37%
9.9 9.5
9.0 8.7 8.4
Jun/08 Sep/08 Dec/08 Mar/09 Jun/09
Land Bank %MRV (R$ billion)
... by Price Range in 2Q09
... in 2Q09:
• Launching of 50 new projects
• PSV of R$614.0 million with 5,977 units
• 88% of unit launched with average prices
up to R$130 thousand.
Launches (%MRV): R$614.0 million in 2Q09
7
... by Financing Source in 2Q09
Operational and Financial
Performance 2Q09
72%
28%
SFH - FGTS
SFH - SBPE
1,489.3
882.6
797.7
614.0
1H08 1H09 2Q08 2Q09
-23.0%
-40.7%
10%
78%
12%
Bellow R$ 80,000
FromR$ 80,001 toR$
130,000
Over R$ 130,000
... in 2Q09:
• Total of R$851.5 million in contracted sales
• 8,874 units sold
• Average sales speed of 20% per month
Contracted Sales (%MRV): R$851.5 million in 2Q09
... by average Price in 2Q09
8
Operational and Financial
Performance 2Q09
... by Financing Source in 2Q09
(number of units)
76%
24%
SFH - FGTS
SFH - SBPE
820.9
1,281.6
480.7
851.5
1H08 1H09 2Q08 2Q09
56.1%
77.1%
24%
60% 16%
Below R$80,000
FromR$80,001 to
R$130,000
Over R$130,000
Inventory at Market Value (%MRV)
9
Inventory distribution of units for sale
as of Jun/30/09 per construction phase
Inventory at Market Value as of 06/30/09 = R$ 1.3 billion
Inventory distribution of units for sale
as of Jun/30/09 per source of funds
Operational and Financial
Performance 2Q09
48%52%
Constructionnot initiated
Under Construction
42%
58%
MinhaCasa, Minha Vida
SFH - SBPE
Financial Indicators
10
Net Operating Revenues
(R$ million)
Gross Income
(R$ million)
Operational and Financial
Performance 2Q09
465.4
662.1
275.9
389.6
1H08 1H09 2Q08 2Q09
42.3%
41.2%
168.8
220.5
97.7
128.8
1H08 1H09 2Q08 2Q09
30.6%
31.8%
11
Productivity Indicators
Selling Expenses (R$ million)
And Selling Expenses/ Net Revenue (%)
G&A Expenses (R$ million)
And G&A Expenses / Net Revenue (%)
Operational and Financial
Performance 2Q09
48.4 47.8
27.0
23.010.4%
7.2%
9.8%
5.9%
1H08 1H09 2Q08 2Q09
-1.2%
-15.0%
40.0
43.2
22.3 21.6
8.6%
6.5%
8.1%
5.5%
1H08 1H09 2Q08 2Q09
7.8%
-3.2%
12
Financial Indicators
EBITDA (R$ million)
and EBITDA Margin (%)
Net Income (R$ million)
and Net Margin (%)
Operational and Financial
Performance 2Q09
93.2
122.9
50.5
73.9
20,0% 18,6%
18,3% 19,0%
1H08 1H09 2Q08 2Q09
32.0%
46.4%
89.3
158.0
53.5
97.5
19.2%
23.9%
19.4%
25.0%
1H08 1H09 2Q08 2Q09
77.0%
82.2%
(R$ million) jun/09 mar/09 Chg. %
Debentures 404.2 314.4 28.6%
Promissory Notes - 100.0 -100.0%
Construction Financing 222.3 165.9 34.0%
Others 45.1 20.7 118.1%
Total debt 671.6 600.9 11.8%
Expenses from debenture's issuance (4.7) (2.3) 102.0%
Total Debt (Net of Fees) 666.9 598.6 11.4%
13
Loans and Financing and Net Debt
Loans and Financing Breakdown
Payments Schedule
Net Debt
Operational and Financial
Performance 2Q09
(R$ million) jun/09
12 months 166.1
13 to 24 months 167.6
25 to 36 months 188.6
Over 37 months 144.5
Total Debt 666.9
(R$ million) jun/09 mar/09 Chg. %
Total debt 666.9 598.6 11.4%
(-) Cash and cash equivalents (673.2) (221.2) 204.4%
Net Debt (6.3) 377.4 -101.7%
Shareholder's Equity 2,186.3 1,603.2
Net Debt / Shareholder's Equity -0.3% 23.5% -23.8 p.p.
Unearned Results
14
Operational and Financial
Performance 2Q09
(R$ million) jun/09 mar/09 Var. %
Unearned Sales Revenues 1.422,0 1.013,7 40,3%
Unearned Costs or Units Sold (768,7) (531,0) 44,8%
Unearned Results 653,3 482,7 35,3%
Unearned Results Margin 45,9% 47,6% -1,7 p.p.
Guidance 2009
15
2Q09Operational and Financial
Performance
Guidance
Sales (%MRV) - R$ million 2,400 ~ 2,900
EBITDA Margin % 24% ~ 28%
The material that follows is a presentation of general background information about MRV Engenharia e Participações S.A. and
its subsidiaries (collectively, “MRV” or the “Company”) as of the date of the presentation. It is information in summary form and
does not purport to be complete. No representation or warranty, express or implied, is made concerning, and no reliance should
be placed on, the accuracy, fairness, or completeness of this information.
This presentation may contain certain forward-looking statements and information relating to MRV that reflect the current views
and/or expectations of the Company and its management with respect to its performance, business and future events. Forward
looking statements include, without limitation, any statement that may predict, forecast, indicate or imply future results,
performance or achievements, and may contain words like “believe,” “anticipate,” “expect,” “envisages,” “will likely result,” or
any other words or phrases of similar meaning. Such statements are subject to a number of risks, uncertainties and
assumptions. We caution you that a number of important factors could cause actual results to differ materially from the plans,
objectives, expectations, estimates and intentions expressed in this presentation. In no event, neither the Company nor any of
its affiliates, directors, officers, agents or employees shall be liable before any third party (including investors) for any
investment or business decision made or action taken in reliance on the information and statements contained in this
presentation or for any consequential, special or similar damages.
This presentation does not constitute an offer, or invitation, or solicitation of an offer to purchase any securities. Neither this
presentation nor anything contained herein shall form the basis of any contract or commitment whatsoever.
The market and competitive position data, including market forecasts, used throughout this presentation was obtained from
internal surveys, market research, publicly available information and industry publications. Although we have no reason to
believe that any of this information or these reports are inaccurate in any material respect, we have not independently verified
the competitive position, market share, market size, market growth or other data provided by third parties or by industry or other
publications. MRV does not make any representation as to the accuracy of such information.
This presentation and its contents are proprietary information and may not be reproduced or otherwise disseminated in whole
or in part without MRV’s prior written consent.
Disclaimer
16
2Q09Earnings
Release
Leonardo Corrêa
Executive Vice President, CFO and Investor Relations Officer
Mônica Simão
Financial Director
Tel.: (+ 55 31) 3348-7150
E-mail: ri@mrv.com.br
www.mrv.com.br/ri
Contacts
17
2Q09Earnings
Release

Earnings Release Presentation - Second Quarter 2009 (2Q09).

  • 1.
  • 2.
  • 3.
    Highlights of theQuarter 3 2Q09Earnings Release Follow-on successfully completed – R$ 595 million gross proceeds (approx. R$570 net proceeds); Record quarter for operational and financial indicators: Contracted Sales, Net Operating Revenue and Net Income; Exceptional profitability, with 19.0% Net Margin; Significant increase in operational capacity, keeping strict control of SG&A expenses. 3.2% fall in G&A expenses compared to 2Q08; In spite of Contracted Sales record volume, 2Q09 selling expenses 15% lower than 2Q08 expenses; Extremely healthy financial situation as of 2Q09 closing. Cash and Cash Equivalents amounted to R$673.2 million as of June 30, 2009. Negative Net Debt of R$6.3 million. Best placed and prepared company to benefit from the growth of demand in the lower-income segment.
  • 4.
    Follow-on 4 2Q09 Follow-on successfully completedin July, 2009 Net proceeds of approx. R$ 570 mn R$ 507 mn proceeds in June 2009 and the rest in July 2009 Shareholders breakdown after Follow-on Earnings Release Free Float 55,1% Rubens Menin T. de Souza 37,5% Executives and B. Members 7,4% Summary of the Offering Primary Offering (thousand shares) * 18,000 Additional Shares (thousand shares) * 3,600 Over-allotment option (thousand shares) ** 2,700 Total of the Primary Offering (thousand shares) 24,300 Issuance Price - R$ 24.50 Value of the Primary Offering (in R$ mn) 595.4 * Shares issued in June 2009 ** Shares issued in July 2009
  • 5.
    Operational and FinancialPerformance Land bank Launches Contracted Sales Net Operating Revenue Gross Income Productivity Indicators EBITDA Net Income Loans and Financing and Net Debt Unearned results Guidance 5 2Q09Earnings Release
  • 6.
    ... by FinancingSource in Jun/09 % of swaps / land acquisition cost% of land acquisition cost/ PSV ... On June 30, 2009: • Land bank of R$8,377.2 million • 85,669 potential units • Average Price of R$97.8 thousand (focus on lower-income segment) Land Bank (%MRV) 6 Operational and Financial Performance 2Q09 75% 25% MinhaCasa, Minha Vida SFH - SBPE 8% 37% 9.9 9.5 9.0 8.7 8.4 Jun/08 Sep/08 Dec/08 Mar/09 Jun/09 Land Bank %MRV (R$ billion)
  • 7.
    ... by PriceRange in 2Q09 ... in 2Q09: • Launching of 50 new projects • PSV of R$614.0 million with 5,977 units • 88% of unit launched with average prices up to R$130 thousand. Launches (%MRV): R$614.0 million in 2Q09 7 ... by Financing Source in 2Q09 Operational and Financial Performance 2Q09 72% 28% SFH - FGTS SFH - SBPE 1,489.3 882.6 797.7 614.0 1H08 1H09 2Q08 2Q09 -23.0% -40.7% 10% 78% 12% Bellow R$ 80,000 FromR$ 80,001 toR$ 130,000 Over R$ 130,000
  • 8.
    ... in 2Q09: •Total of R$851.5 million in contracted sales • 8,874 units sold • Average sales speed of 20% per month Contracted Sales (%MRV): R$851.5 million in 2Q09 ... by average Price in 2Q09 8 Operational and Financial Performance 2Q09 ... by Financing Source in 2Q09 (number of units) 76% 24% SFH - FGTS SFH - SBPE 820.9 1,281.6 480.7 851.5 1H08 1H09 2Q08 2Q09 56.1% 77.1% 24% 60% 16% Below R$80,000 FromR$80,001 to R$130,000 Over R$130,000
  • 9.
    Inventory at MarketValue (%MRV) 9 Inventory distribution of units for sale as of Jun/30/09 per construction phase Inventory at Market Value as of 06/30/09 = R$ 1.3 billion Inventory distribution of units for sale as of Jun/30/09 per source of funds Operational and Financial Performance 2Q09 48%52% Constructionnot initiated Under Construction 42% 58% MinhaCasa, Minha Vida SFH - SBPE
  • 10.
    Financial Indicators 10 Net OperatingRevenues (R$ million) Gross Income (R$ million) Operational and Financial Performance 2Q09 465.4 662.1 275.9 389.6 1H08 1H09 2Q08 2Q09 42.3% 41.2% 168.8 220.5 97.7 128.8 1H08 1H09 2Q08 2Q09 30.6% 31.8%
  • 11.
    11 Productivity Indicators Selling Expenses(R$ million) And Selling Expenses/ Net Revenue (%) G&A Expenses (R$ million) And G&A Expenses / Net Revenue (%) Operational and Financial Performance 2Q09 48.4 47.8 27.0 23.010.4% 7.2% 9.8% 5.9% 1H08 1H09 2Q08 2Q09 -1.2% -15.0% 40.0 43.2 22.3 21.6 8.6% 6.5% 8.1% 5.5% 1H08 1H09 2Q08 2Q09 7.8% -3.2%
  • 12.
    12 Financial Indicators EBITDA (R$million) and EBITDA Margin (%) Net Income (R$ million) and Net Margin (%) Operational and Financial Performance 2Q09 93.2 122.9 50.5 73.9 20,0% 18,6% 18,3% 19,0% 1H08 1H09 2Q08 2Q09 32.0% 46.4% 89.3 158.0 53.5 97.5 19.2% 23.9% 19.4% 25.0% 1H08 1H09 2Q08 2Q09 77.0% 82.2%
  • 13.
    (R$ million) jun/09mar/09 Chg. % Debentures 404.2 314.4 28.6% Promissory Notes - 100.0 -100.0% Construction Financing 222.3 165.9 34.0% Others 45.1 20.7 118.1% Total debt 671.6 600.9 11.8% Expenses from debenture's issuance (4.7) (2.3) 102.0% Total Debt (Net of Fees) 666.9 598.6 11.4% 13 Loans and Financing and Net Debt Loans and Financing Breakdown Payments Schedule Net Debt Operational and Financial Performance 2Q09 (R$ million) jun/09 12 months 166.1 13 to 24 months 167.6 25 to 36 months 188.6 Over 37 months 144.5 Total Debt 666.9 (R$ million) jun/09 mar/09 Chg. % Total debt 666.9 598.6 11.4% (-) Cash and cash equivalents (673.2) (221.2) 204.4% Net Debt (6.3) 377.4 -101.7% Shareholder's Equity 2,186.3 1,603.2 Net Debt / Shareholder's Equity -0.3% 23.5% -23.8 p.p.
  • 14.
    Unearned Results 14 Operational andFinancial Performance 2Q09 (R$ million) jun/09 mar/09 Var. % Unearned Sales Revenues 1.422,0 1.013,7 40,3% Unearned Costs or Units Sold (768,7) (531,0) 44,8% Unearned Results 653,3 482,7 35,3% Unearned Results Margin 45,9% 47,6% -1,7 p.p.
  • 15.
    Guidance 2009 15 2Q09Operational andFinancial Performance Guidance Sales (%MRV) - R$ million 2,400 ~ 2,900 EBITDA Margin % 24% ~ 28%
  • 16.
    The material thatfollows is a presentation of general background information about MRV Engenharia e Participações S.A. and its subsidiaries (collectively, “MRV” or the “Company”) as of the date of the presentation. It is information in summary form and does not purport to be complete. No representation or warranty, express or implied, is made concerning, and no reliance should be placed on, the accuracy, fairness, or completeness of this information. This presentation may contain certain forward-looking statements and information relating to MRV that reflect the current views and/or expectations of the Company and its management with respect to its performance, business and future events. Forward looking statements include, without limitation, any statement that may predict, forecast, indicate or imply future results, performance or achievements, and may contain words like “believe,” “anticipate,” “expect,” “envisages,” “will likely result,” or any other words or phrases of similar meaning. Such statements are subject to a number of risks, uncertainties and assumptions. We caution you that a number of important factors could cause actual results to differ materially from the plans, objectives, expectations, estimates and intentions expressed in this presentation. In no event, neither the Company nor any of its affiliates, directors, officers, agents or employees shall be liable before any third party (including investors) for any investment or business decision made or action taken in reliance on the information and statements contained in this presentation or for any consequential, special or similar damages. This presentation does not constitute an offer, or invitation, or solicitation of an offer to purchase any securities. Neither this presentation nor anything contained herein shall form the basis of any contract or commitment whatsoever. The market and competitive position data, including market forecasts, used throughout this presentation was obtained from internal surveys, market research, publicly available information and industry publications. Although we have no reason to believe that any of this information or these reports are inaccurate in any material respect, we have not independently verified the competitive position, market share, market size, market growth or other data provided by third parties or by industry or other publications. MRV does not make any representation as to the accuracy of such information. This presentation and its contents are proprietary information and may not be reproduced or otherwise disseminated in whole or in part without MRV’s prior written consent. Disclaimer 16 2Q09Earnings Release
  • 17.
    Leonardo Corrêa Executive VicePresident, CFO and Investor Relations Officer Mônica Simão Financial Director Tel.: (+ 55 31) 3348-7150 E-mail: ri@mrv.com.br www.mrv.com.br/ri Contacts 17 2Q09Earnings Release