Download to read offline
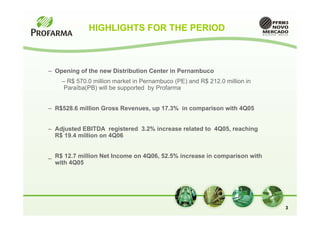
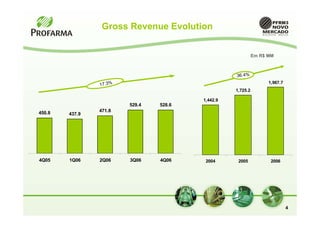
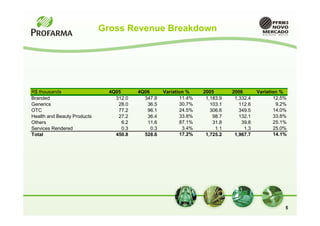
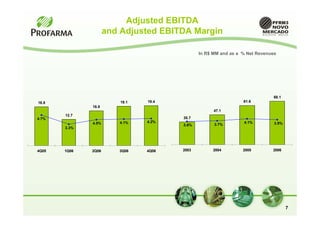
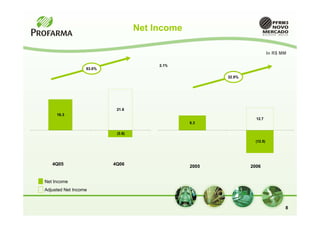

- The company opened a new distribution center in Pernambuco, Brazil which will serve markets in Pernambuco and Paraíba. - Gross revenues increased 17.3% compared to the same period last year, reaching R$528.6 million. - Adjusted EBITDA increased 3.2% compared to the same period last year, reaching R$19.4 million. - Net income increased 52.5% compared to the same period last year, reaching R$12.7 million.


