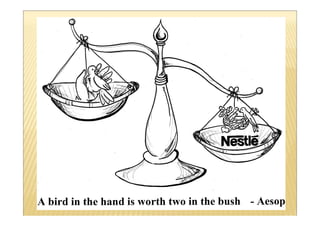
Global Value Equity
    Investing

    Thomas A. Russo
    Value Investing Forum 2009
            Mexico City
        December 7-8, 2009
Musings on “Global Value” Equity Investing
      I.     Background, philosophy and approach
             A.    Stanford Business School early 1980s lecture
      II.    The “value vs. growth” paradox
      III.   Be mindful of agency costs
             A.    Family controlled companies
      IV.    Invest for the long term
             A.    Tax efficiency
             B.    Shareholder value vs. reported profits
      V.     Value of global perspective
      VI.    Focus, focus, focus, focus
      VII.   Virtues of low expectations
           A. Reduce panic factor
      VIII. Global value company investment examples
           A. Nestlé – 35 year horizon
           B. Pernod Ricard – credit default swap mayhem
           C. SABMiller – emerging market specialist
      IX. Final musings
Business Description
Nestle S.A., through its subsidiaries, provides nutrition, health, and wellness products worldwide. The company offers various food and beverage products, including bottled water, baby
foods, breakfast cereals, chocolate and confectionary products, coffee, dairy products, ice creams, nutrition and health products, beverages, prepared kitchen foods, and pet care products.
Its products include various sauces and salads. The company offers its products primarily under the KitKat, PowerBar, Nescafe Dolce Gusto, NaturNes, Nesquik, Purina, Perrier, Chocapic,
Nido, and Maggi brand names. Nestle S.A. also provides pharmaceutical, and health and beauty products. The company was founded in 1866 and is headquartered in Vevey, Switzerland.


Key Financials
                                                                                                         LTM²
For the Fiscal Period Ending                  12 months         12 months         12 months          12 months          12 months          12 months         12 months          12 months
                                           Dec-31-2011E      Dec-31-2010E      Dec-31-2009E       Jun-30-2009A       Dec-31-2008A       Dec-31-2007A      Dec-31-2006A       Dec-31-2005A
Currency                                           CHF               CHF               CHF                CHF                CHF                CHF               CHF                CHF

Total Revenue                                   114,825.6        110,629.5         108,573.5           109,109.0          109,908.0          107,552.0           98,458.0          91,115.0

 Growth Over Prior Year                              3.8%             1.9%             (1.2%)              (0.4%)              2.2%               9.2%              8.1%               7.6%

Gross Profit                                             -                -                  -           62,253.0           62,569.0           62,515.0          57,745.0          53,198.0

 Margin %                                                -                -                  -             57.1%              56.9%              58.1%             58.6%             58.4%

EBITDA                                           19,893.2          19,041.1          18,872.2            18,566.0           18,449.0           17,776.0          16,363.0          14,604.0

 Margin %                                          17.3%             17.2%             17.4%               17.0%              16.8%              16.5%             16.6%             16.0%

EBIT                                             17,215.0          15,778.8          15,549.4            15,718.0           15,676.0           15,024.0          13,302.0          11,876.0

 Margin %                                          15.0%             14.3%             14.3%               14.4%              14.3%              14.0%             13.5%             13.0%

Earnings from Cont. Ops.                                 -                -                  -           17,896.0           18,039.0           10,649.0           9,123.0           8,095.0

 Margin %                                                -                -                  -             16.4%              16.4%               9.9%              9.3%               8.9%

Net Income                                               -                -                  -           17,896.0           18,039.0           10,649.0           9,197.0           8,081.0

 Margin %                                                -                -                  -             16.4%              16.4%               9.9%              9.3%               8.9%

Diluted EPS Excl. Extra Items³                      3.637             3.514             2.907                4.89              4.844              2.761             2.356             2.063

 Growth Over Prior Year                              3.5%            20.9%              0.9%               69.0%              75.5%              17.2%             14.2%             23.9%
Current Capitalization (Millions of CHF)
Currency                                                      CHF
Share Price as of Dec-01-2009                                  48.5
x Shares Out.                                               3,615.6
= Market Capitalization                                   175,357.0
- Cash & Short Term Investments                             7,591.0
+ Total Debt                                               25,040.0
+ Pref. Equity                                                    -
+ Total Minority Interest                                   4,247.0
= Total Enterprise Value (TEV)                            197,053.0
Book Value of Common Equity                                50,361.0
+ Pref. Equity                                                    -
+ Total Minority Interest                                   4,247.0
+ Total Debt                                               25,040.0
= Total Capital                                            79,648.0

Valuation Multiples based on Current Capitalization
                                                                                                              LTM
For the Fiscal Period Ending                             12 months       12 months      12 months†       12 months       12 months
                                                      Dec-31-2011E    Dec-31-2010E    Dec-31-2009E    Jun-30-2009A    Dec-31-2008A
TEV/Total Revenue                                              1.7x            1.8x            1.8x            1.8x            1.8x
TEV/EBITDA                                                     9.9x           10.3x           10.4x           10.1x           10.0x
TEV/EBIT                                                      11.4x           12.5x           12.7x           11.8x           11.6x
P/Diluted EPS Before Extra                                    13.3x           13.8x           16.7x            9.9x           10.0x
P/BV                                                              -               -               -            3.5x            3.5x
Price/Tang BV                                                     -               -               -           14.6x           13.2x

Ratios
                                                             LTM
For the Fiscal Period Ending                             12 months      12 months       12 months       12 months       12 months      12 months
                                                       Jun-30-2009     Dec-31-2008     Dec-31-2007     Dec-31-2006     Dec-31-2005    Dec-31-2004
Profitability
 Return on Assets %                                           8.9%            8.8%            8.6%            8.1%            7.8%          6.5%
 Return on Capital %                                         12.0%           12.1%           11.7%           11.0%           10.5%          8.6%
 Return on Equity %                                          37.1%           34.9%           20.6%           18.5%           18.7%         17.3%
 Return on Common Equity %                                   37.1%           34.9%           20.6%           18.5%           18.7%         17.3%

Margin Analysis
 Gross Margin %                                              57.1%           56.9%           58.1%           58.6%           58.4%         58.3%
 EBITDA Margin %                                             17.0%           16.8%           16.5%           16.6%           16.0%         16.0%
 EBITA Margin %                                              14.6%           14.4%           14.1%           14.0%           13.4%         13.1%
 EBIT Margin %                                               14.4%           14.3%           14.0%           13.5%           13.0%         10.8%
 Earnings from Cont. Ops Margin %                            16.4%           16.4%            9.9%            9.3%            8.9%          7.8%
 Net Income Margin %                                         16.4%           16.4%            9.9%            9.3%            8.9%          7.8%
Business Description
Pernod Ricard SA, together with its subsidiaries, engages in the production and distribution spirits and wines in France and internationally. It offers whisky, ouzo, anis-based spirits,
liqueurs, cognacs and brandies, white spirits and rums, wine-based aperitifs, champagne, vodka, distilled spirits, gin, rum, coolers, tequila, and bitters. The company provides its products
under ABSOLUT, Ricard Pastis, Ballantine’s, Chivas Regal, The Glenlivet Scotch, Jameson Irish, Martell, Havana Club, Beefeater, Kahlúa, Malibu, Mumm, Perrier-Jouët, Jacob’s Creek,
and Montana brand names. Pernod Ricard was founded in 1975 and is headquartered in Paris, France.


Key Financials

For the Fiscal Period Ending                        12 months         12 months    12 months              12 months        12 months         12 months          12 months        12 months
                                                 Jun-30-2012E      Jun-30-2011E Jun-30-2010E           Jun-30-2009A     Jun-30-2008A      Jun-30-2007A       Jun-30-2006A     Jun-30-2005A
Currency                                                   EUR               EUR              EUR               EUR               EUR               EUR                EUR              EUR

Total Revenue                                           7,596.6           7,272.6           7,342.2           7,203.0           6,589.0           6,443.0           6,066.0           3,611.0
 Growth Over Prior Year                                    4.5%            (0.9%)             1.9%              9.3%              2.3%              6.2%             68.0%                NA


Gross Profit                                                   -                 -                 -          4,208.0           3,766.0           3,587.0           3,578.0           2,156.0
 Margin %                                                      -                 -                 -           58.4%             57.2%             55.7%             59.0%             59.7%


EBITDA                                                  2,261.2           2,112.4           1,999.0           1,920.0           1,632.0           1,630.0           1,338.0             842.0
 Margin %                                                29.8%              29.0%            27.2%             26.7%             24.8%             25.3%             22.1%             23.3%


EBIT                                                    2,086.2           1,928.4           1,816.6           1,763.0           1,466.0           1,481.0           1,190.0             741.0
 Margin %                                                27.5%              26.5%            24.7%             24.5%             22.2%             23.0%             19.6%             20.5%


Earnings from Cont. Ops.                                       -                 -                 -            937.0             840.0             831.0             582.0             484.0
 Margin %                                                      -                 -                 -           13.0%             12.7%             12.9%              9.6%             13.4%


Net Income                                                     -                 -                 -            945.0             840.0             831.0             639.0             484.0
 Margin %                                                      -                 -                 -           13.1%             12.7%             12.9%             10.5%             13.4%


Diluted EPS Excl. Extra Items³                            4.795               4.32            3.969             3.884             3.576              3.79             2.712             2.782
 Growth Over Prior Year                                  11.0%               8.8%          (12.8%)              8.6%             (5.6%)            39.7%             (2.5%)               NA
Current Capitalization (Millions of EUR)
Currency                                                 EUR
Share Price as of Dec-01-2009                            57.49
x Shares Out.                                            263.9
= Market Capitalization                                15,170.6
- Cash & Short Term Investments                          520.0
+ Total Debt                                           11,221.0
+ Pref. Equity                                               -
+ Total Minority Interest                                185.0
= Total Enterprise Value (TEV)                         26,056.6
Book Value of Common Equity                             7,431.0
+ Pref. Equity                                               -
+ Total Minority Interest                                185.0
+ Total Debt                                           11,221.0
= Total Capital                                        18,837.0

Valuation Multiples based on Current Capitalization
For the Fiscal Period Ending                         12 months       12 months      12 months†       12 months       12 months
                                                  Jun-30-2012E    Jun-30-2011E    Jun-30-2010E    Jun-30-2009A    Jun-30-2008A
TEV/Total Revenue                                          3.4x            3.6x            3.5x            3.6x            4.0x
TEV/EBITDA                                                11.5x           12.3x           13.0x           13.6x           16.0x
TEV/EBIT                                                  12.5x           13.5x           14.3x           14.8x           17.8x
P/Diluted EPS Before Extra                                12.0x           13.3x           14.5x           14.8x           16.1x
P/BV                                                          -               -               -            2.0x            2.0x
Price/Tang BV                                                 -               -               -            NM              NM

Ratios
                                                                                                                                   Fiscal   Press Release
For the Fiscal Period Ending                         12 months       12 months       12 months       12 months       12 months     Year        12 months
                                                   Jun-30-2009     Jun-30-2008     Jun-30-2007     Jun-30-2006     Jun-30-2005    Change     Dec-31-2004
Profitability                                                                                                                      FYC
 Return on Assets %                                       5.1%            4.8%            4.7%            5.6%             NA      FYC              6.5%
 Return on Capital %                                      6.9%            7.0%            7.1%            8.5%             NA      FYC              8.7%
 Return on Equity %                                      13.5%           13.2%           13.9%           14.1%             NA      FYC             17.2%
 Return on Common Equity %                               13.5%           13.2%           13.9%           14.1%             NA      FYC             17.2%

Margin Analysis                                                                                                                    FYC
 Gross Margin %                                          58.4%           57.2%           55.7%           59.0%           59.7%     FYC             65.8%
 EBITDA Margin %                                         26.7%           24.8%           25.3%           22.1%           23.3%     FYC             23.6%
 EBITA Margin %                                          24.8%           22.7%           23.9%           20.0%           20.7%     FYC             20.8%
 EBIT Margin %                                           24.5%           22.2%           23.0%           19.6%           20.5%     FYC             20.4%
 Earnings from Cont. Ops Margin %                        13.0%           12.7%           12.9%            9.6%           13.4%     FYC             13.6%
 Net Income Margin %                                     13.1%           12.7%           12.9%           10.5%           13.4%     FYC             13.6%
Business Description
SABMiller plc, through its subsidiaries, engages in the manufacture, distribution, and sale of beverages worldwide. It products primarily include beer, soft drinks, and fruit juices. The
company also involves in hop farming. It offers its products primarily under Pilsner Urquell, Peroni Nastro Azzurro, Miller Genuine Draft, Grolsch, Aguila, Castle, Miller Lite, Snow,
and Tyskie brand names. SABMiller also operates as a bottler for Coca-Cola products. The company has a strategic alliance with Castel. SABMiller plc was founded in 1895 and is
headquartered in London, the United Kingdom.


Key Financials

                                                                                                              LTM²
For the Fiscal Period Ending                         12 months    12 months    12 months                  12 months    12 months    12 months    12 months    12 months
                                                  Mar-31-2012E Mar-31-2011E Mar-31-2010E               Sep-30-2009A Mar-31-2009A Mar-31-2008A Mar-31-2007A Mar-31-2006A
Currency                                                     GBP             GBP               GBP               GBP               GBP               GBP              GBP               GBP

Total Revenue                                            13,256.3         12,554.5         11,764.2            8,112.6         10,365.3                            7,541.7            7,116.7
                                                                                                                                                  8,585.6
 Growth Over Prior Year                                     5.6%             6.7%           (22.6%)           (25.3%)           (12.7%)            14.8%             20.1%             16.7%


Gross Profit                                                     -                -                -           5,407.8           6,555.0                           4,847.7            4,482.3
                                                                                                                                                  5,490.5
 Margin %                                                        -                -                -            66.7%             63.2%            64.0%             64.3%             63.0%


EBITDA                                                    3,201.1          2,957.4          2,636.3            2,082.1           2,881.2                           2,065.3            1,846.7
                                                                                                                                                  2,285.7
 Margin %                                                  24.1%            23.6%            22.4%              25.7%             27.8%            26.6%             27.4%             25.9%


EBIT                                                      2,559.2          2,330.0          2,041.0            1,488.7           2,189.6                           1,609.1            1,467.3
                                                                                                                                                  1,787.9
 Margin %                                                  19.3%            18.6%            17.3%              18.4%             21.1%            20.8%             21.3%             20.6%


Earnings from Cont. Ops.                                         -                -                -             894.7           1,310.0                             836.8              827.9
                                                                                                                                                  1,018.3
 Margin %                                                        -                -                -            11.0%             12.6%            11.9%             11.1%             11.6%


Net Income                                                       -                -                -             894.7           1,310.0                             836.8              827.9
                                                                                                                                                  1,018.3
 Margin %                                                        -                -                -            11.0%             12.6%            11.9%             11.1%             11.6%


Diluted EPS Excl. Extra Items³                              1.243            1.136             0.98              0.584             0.868                             0.556                   0.6
                                                                                                                                                     0.675
 Growth Over Prior Year                                     9.5%            15.9%            19.2%            (43.4%)            (7.1%)             22.4%             5.1%           (12.9%)
Current Capitalization (Millions of GBP)
Currency                                                      GBP
Share Price as of Dec-01-2009                                 17.95
x Shares Out.                                               1,574.2
= Market Capitalization                                    28,248.9
- Cash & Short Term Investments                               278.8
+ Total Debt                                                6,019.1
+ Pref. Equity                                                    -
+ Total Minority Interest                                     400.2
= Total Enterprise Value (TEV)                             34,389.4
Book Value of Common Equity                                11,546.7
+ Pref. Equity                                                    -
+ Total Minority Interest                                     400.2
+ Total Debt                                                6,019.1
= Total Capital                                            17,966.0

Valuation Multiples based on Current Capitalization
                                                                                                              LTM
For the Fiscal Period Ending                             12 months       12 months      12 months†       12 months       12 months
                                                      Mar-31-2012E    Mar-31-2011E    Mar-31-2010E    Sep-30-2009A    Mar-31-2009A
TEV/Total Revenue                                                 -               -               -            4.4x            3.8x
TEV/EBITDA                                                        -               -               -           13.8x           12.2x
TEV/EBIT                                                          -               -               -           17.9x           15.6x
P/Diluted EPS Before Extra                                    14.4x           15.8x           18.3x           32.0x           24.0x
P/BV                                                              -               -               -            2.4x            3.1x
Price/Tang BV                                                     -               -               -           14.3x           16.2x

Ratios
                                                              LTM
For the Fiscal Period Ending                              12 months     12 months       12 months      12 months        12 months      12 months
                                                        Sep-30-2009    Mar-31-2009     Mar-31-2008    Mar-31-2007      Mar-31-2006    Mar-31-2005
Profitability
 Return on Assets %                                           4.2%            5.8%            6.8%            7.1%            7.5%          9.2%
 Return on Capital %                                          5.2%            7.3%            8.9%            9.1%            9.6%         11.9%
 Return on Equity %                                           7.9%           11.4%           12.7%           12.0%           13.6%         21.4%
 Return on Common Equity %                                    7.9%           11.4%           12.7%           12.0%           13.6%         21.4%

Margin Analysis
 Gross Margin %                                              66.7%           63.2%           64.0%           64.3%           63.0%         60.8%
 EBITDA Margin %                                             25.7%           27.8%           26.6%           27.4%           25.9%         25.3%
 EBITA Margin %                                              19.5%           22.2%           21.7%           22.4%           21.5%         20.8%
 EBIT Margin %                                               18.4%           21.1%           20.8%           21.3%           20.6%         20.5%
 Earnings from Cont. Ops Margin %                            11.0%           12.6%           11.9%           11.1%           11.6%         14.3%
 Net Income Margin %                                         11.0%           12.6%           11.9%           11.1%           11.6%         14.3%
Tom Russo VIF 2009.
Tom Russo VIF 2009.
Tom Russo VIF 2009.
Tom Russo VIF 2009.
Tom Russo VIF 2009.
Tom Russo VIF 2009.
Tom Russo VIF 2009.

Tom Russo VIF 2009.

  • 1.
    Global Value Equity Investing Thomas A. Russo Value Investing Forum 2009 Mexico City December 7-8, 2009
  • 5.
    Musings on “GlobalValue” Equity Investing I. Background, philosophy and approach A. Stanford Business School early 1980s lecture II. The “value vs. growth” paradox III. Be mindful of agency costs A. Family controlled companies IV. Invest for the long term A. Tax efficiency B. Shareholder value vs. reported profits V. Value of global perspective VI. Focus, focus, focus, focus VII. Virtues of low expectations A. Reduce panic factor VIII. Global value company investment examples A. Nestlé – 35 year horizon B. Pernod Ricard – credit default swap mayhem C. SABMiller – emerging market specialist IX. Final musings
  • 8.
    Business Description Nestle S.A.,through its subsidiaries, provides nutrition, health, and wellness products worldwide. The company offers various food and beverage products, including bottled water, baby foods, breakfast cereals, chocolate and confectionary products, coffee, dairy products, ice creams, nutrition and health products, beverages, prepared kitchen foods, and pet care products. Its products include various sauces and salads. The company offers its products primarily under the KitKat, PowerBar, Nescafe Dolce Gusto, NaturNes, Nesquik, Purina, Perrier, Chocapic, Nido, and Maggi brand names. Nestle S.A. also provides pharmaceutical, and health and beauty products. The company was founded in 1866 and is headquartered in Vevey, Switzerland. Key Financials LTM² For the Fiscal Period Ending 12 months 12 months 12 months 12 months 12 months 12 months 12 months 12 months Dec-31-2011E Dec-31-2010E Dec-31-2009E Jun-30-2009A Dec-31-2008A Dec-31-2007A Dec-31-2006A Dec-31-2005A Currency CHF CHF CHF CHF CHF CHF CHF CHF Total Revenue 114,825.6 110,629.5 108,573.5 109,109.0 109,908.0 107,552.0 98,458.0 91,115.0 Growth Over Prior Year 3.8% 1.9% (1.2%) (0.4%) 2.2% 9.2% 8.1% 7.6% Gross Profit - - - 62,253.0 62,569.0 62,515.0 57,745.0 53,198.0 Margin % - - - 57.1% 56.9% 58.1% 58.6% 58.4% EBITDA 19,893.2 19,041.1 18,872.2 18,566.0 18,449.0 17,776.0 16,363.0 14,604.0 Margin % 17.3% 17.2% 17.4% 17.0% 16.8% 16.5% 16.6% 16.0% EBIT 17,215.0 15,778.8 15,549.4 15,718.0 15,676.0 15,024.0 13,302.0 11,876.0 Margin % 15.0% 14.3% 14.3% 14.4% 14.3% 14.0% 13.5% 13.0% Earnings from Cont. Ops. - - - 17,896.0 18,039.0 10,649.0 9,123.0 8,095.0 Margin % - - - 16.4% 16.4% 9.9% 9.3% 8.9% Net Income - - - 17,896.0 18,039.0 10,649.0 9,197.0 8,081.0 Margin % - - - 16.4% 16.4% 9.9% 9.3% 8.9% Diluted EPS Excl. Extra Items³ 3.637 3.514 2.907 4.89 4.844 2.761 2.356 2.063 Growth Over Prior Year 3.5% 20.9% 0.9% 69.0% 75.5% 17.2% 14.2% 23.9%
  • 9.
    Current Capitalization (Millionsof CHF) Currency CHF Share Price as of Dec-01-2009 48.5 x Shares Out. 3,615.6 = Market Capitalization 175,357.0 - Cash & Short Term Investments 7,591.0 + Total Debt 25,040.0 + Pref. Equity - + Total Minority Interest 4,247.0 = Total Enterprise Value (TEV) 197,053.0 Book Value of Common Equity 50,361.0 + Pref. Equity - + Total Minority Interest 4,247.0 + Total Debt 25,040.0 = Total Capital 79,648.0 Valuation Multiples based on Current Capitalization LTM For the Fiscal Period Ending 12 months 12 months 12 months† 12 months 12 months Dec-31-2011E Dec-31-2010E Dec-31-2009E Jun-30-2009A Dec-31-2008A TEV/Total Revenue 1.7x 1.8x 1.8x 1.8x 1.8x TEV/EBITDA 9.9x 10.3x 10.4x 10.1x 10.0x TEV/EBIT 11.4x 12.5x 12.7x 11.8x 11.6x P/Diluted EPS Before Extra 13.3x 13.8x 16.7x 9.9x 10.0x P/BV - - - 3.5x 3.5x Price/Tang BV - - - 14.6x 13.2x Ratios LTM For the Fiscal Period Ending 12 months 12 months 12 months 12 months 12 months 12 months Jun-30-2009 Dec-31-2008 Dec-31-2007 Dec-31-2006 Dec-31-2005 Dec-31-2004 Profitability Return on Assets % 8.9% 8.8% 8.6% 8.1% 7.8% 6.5% Return on Capital % 12.0% 12.1% 11.7% 11.0% 10.5% 8.6% Return on Equity % 37.1% 34.9% 20.6% 18.5% 18.7% 17.3% Return on Common Equity % 37.1% 34.9% 20.6% 18.5% 18.7% 17.3% Margin Analysis Gross Margin % 57.1% 56.9% 58.1% 58.6% 58.4% 58.3% EBITDA Margin % 17.0% 16.8% 16.5% 16.6% 16.0% 16.0% EBITA Margin % 14.6% 14.4% 14.1% 14.0% 13.4% 13.1% EBIT Margin % 14.4% 14.3% 14.0% 13.5% 13.0% 10.8% Earnings from Cont. Ops Margin % 16.4% 16.4% 9.9% 9.3% 8.9% 7.8% Net Income Margin % 16.4% 16.4% 9.9% 9.3% 8.9% 7.8%
  • 10.
    Business Description Pernod RicardSA, together with its subsidiaries, engages in the production and distribution spirits and wines in France and internationally. It offers whisky, ouzo, anis-based spirits, liqueurs, cognacs and brandies, white spirits and rums, wine-based aperitifs, champagne, vodka, distilled spirits, gin, rum, coolers, tequila, and bitters. The company provides its products under ABSOLUT, Ricard Pastis, Ballantine’s, Chivas Regal, The Glenlivet Scotch, Jameson Irish, Martell, Havana Club, Beefeater, Kahlúa, Malibu, Mumm, Perrier-Jouët, Jacob’s Creek, and Montana brand names. Pernod Ricard was founded in 1975 and is headquartered in Paris, France. Key Financials For the Fiscal Period Ending 12 months 12 months 12 months 12 months 12 months 12 months 12 months 12 months Jun-30-2012E Jun-30-2011E Jun-30-2010E Jun-30-2009A Jun-30-2008A Jun-30-2007A Jun-30-2006A Jun-30-2005A Currency EUR EUR EUR EUR EUR EUR EUR EUR Total Revenue 7,596.6 7,272.6 7,342.2 7,203.0 6,589.0 6,443.0 6,066.0 3,611.0 Growth Over Prior Year 4.5% (0.9%) 1.9% 9.3% 2.3% 6.2% 68.0% NA Gross Profit - - - 4,208.0 3,766.0 3,587.0 3,578.0 2,156.0 Margin % - - - 58.4% 57.2% 55.7% 59.0% 59.7% EBITDA 2,261.2 2,112.4 1,999.0 1,920.0 1,632.0 1,630.0 1,338.0 842.0 Margin % 29.8% 29.0% 27.2% 26.7% 24.8% 25.3% 22.1% 23.3% EBIT 2,086.2 1,928.4 1,816.6 1,763.0 1,466.0 1,481.0 1,190.0 741.0 Margin % 27.5% 26.5% 24.7% 24.5% 22.2% 23.0% 19.6% 20.5% Earnings from Cont. Ops. - - - 937.0 840.0 831.0 582.0 484.0 Margin % - - - 13.0% 12.7% 12.9% 9.6% 13.4% Net Income - - - 945.0 840.0 831.0 639.0 484.0 Margin % - - - 13.1% 12.7% 12.9% 10.5% 13.4% Diluted EPS Excl. Extra Items³ 4.795 4.32 3.969 3.884 3.576 3.79 2.712 2.782 Growth Over Prior Year 11.0% 8.8% (12.8%) 8.6% (5.6%) 39.7% (2.5%) NA
  • 11.
    Current Capitalization (Millionsof EUR) Currency EUR Share Price as of Dec-01-2009 57.49 x Shares Out. 263.9 = Market Capitalization 15,170.6 - Cash & Short Term Investments 520.0 + Total Debt 11,221.0 + Pref. Equity - + Total Minority Interest 185.0 = Total Enterprise Value (TEV) 26,056.6 Book Value of Common Equity 7,431.0 + Pref. Equity - + Total Minority Interest 185.0 + Total Debt 11,221.0 = Total Capital 18,837.0 Valuation Multiples based on Current Capitalization For the Fiscal Period Ending 12 months 12 months 12 months† 12 months 12 months Jun-30-2012E Jun-30-2011E Jun-30-2010E Jun-30-2009A Jun-30-2008A TEV/Total Revenue 3.4x 3.6x 3.5x 3.6x 4.0x TEV/EBITDA 11.5x 12.3x 13.0x 13.6x 16.0x TEV/EBIT 12.5x 13.5x 14.3x 14.8x 17.8x P/Diluted EPS Before Extra 12.0x 13.3x 14.5x 14.8x 16.1x P/BV - - - 2.0x 2.0x Price/Tang BV - - - NM NM Ratios Fiscal Press Release For the Fiscal Period Ending 12 months 12 months 12 months 12 months 12 months Year 12 months Jun-30-2009 Jun-30-2008 Jun-30-2007 Jun-30-2006 Jun-30-2005 Change Dec-31-2004 Profitability FYC Return on Assets % 5.1% 4.8% 4.7% 5.6% NA FYC 6.5% Return on Capital % 6.9% 7.0% 7.1% 8.5% NA FYC 8.7% Return on Equity % 13.5% 13.2% 13.9% 14.1% NA FYC 17.2% Return on Common Equity % 13.5% 13.2% 13.9% 14.1% NA FYC 17.2% Margin Analysis FYC Gross Margin % 58.4% 57.2% 55.7% 59.0% 59.7% FYC 65.8% EBITDA Margin % 26.7% 24.8% 25.3% 22.1% 23.3% FYC 23.6% EBITA Margin % 24.8% 22.7% 23.9% 20.0% 20.7% FYC 20.8% EBIT Margin % 24.5% 22.2% 23.0% 19.6% 20.5% FYC 20.4% Earnings from Cont. Ops Margin % 13.0% 12.7% 12.9% 9.6% 13.4% FYC 13.6% Net Income Margin % 13.1% 12.7% 12.9% 10.5% 13.4% FYC 13.6%
  • 14.
    Business Description SABMiller plc,through its subsidiaries, engages in the manufacture, distribution, and sale of beverages worldwide. It products primarily include beer, soft drinks, and fruit juices. The company also involves in hop farming. It offers its products primarily under Pilsner Urquell, Peroni Nastro Azzurro, Miller Genuine Draft, Grolsch, Aguila, Castle, Miller Lite, Snow, and Tyskie brand names. SABMiller also operates as a bottler for Coca-Cola products. The company has a strategic alliance with Castel. SABMiller plc was founded in 1895 and is headquartered in London, the United Kingdom. Key Financials LTM² For the Fiscal Period Ending 12 months 12 months 12 months 12 months 12 months 12 months 12 months 12 months Mar-31-2012E Mar-31-2011E Mar-31-2010E Sep-30-2009A Mar-31-2009A Mar-31-2008A Mar-31-2007A Mar-31-2006A Currency GBP GBP GBP GBP GBP GBP GBP GBP Total Revenue 13,256.3 12,554.5 11,764.2 8,112.6 10,365.3 7,541.7 7,116.7 8,585.6 Growth Over Prior Year 5.6% 6.7% (22.6%) (25.3%) (12.7%) 14.8% 20.1% 16.7% Gross Profit - - - 5,407.8 6,555.0 4,847.7 4,482.3 5,490.5 Margin % - - - 66.7% 63.2% 64.0% 64.3% 63.0% EBITDA 3,201.1 2,957.4 2,636.3 2,082.1 2,881.2 2,065.3 1,846.7 2,285.7 Margin % 24.1% 23.6% 22.4% 25.7% 27.8% 26.6% 27.4% 25.9% EBIT 2,559.2 2,330.0 2,041.0 1,488.7 2,189.6 1,609.1 1,467.3 1,787.9 Margin % 19.3% 18.6% 17.3% 18.4% 21.1% 20.8% 21.3% 20.6% Earnings from Cont. Ops. - - - 894.7 1,310.0 836.8 827.9 1,018.3 Margin % - - - 11.0% 12.6% 11.9% 11.1% 11.6% Net Income - - - 894.7 1,310.0 836.8 827.9 1,018.3 Margin % - - - 11.0% 12.6% 11.9% 11.1% 11.6% Diluted EPS Excl. Extra Items³ 1.243 1.136 0.98 0.584 0.868 0.556 0.6 0.675 Growth Over Prior Year 9.5% 15.9% 19.2% (43.4%) (7.1%) 22.4% 5.1% (12.9%)
  • 15.
    Current Capitalization (Millionsof GBP) Currency GBP Share Price as of Dec-01-2009 17.95 x Shares Out. 1,574.2 = Market Capitalization 28,248.9 - Cash & Short Term Investments 278.8 + Total Debt 6,019.1 + Pref. Equity - + Total Minority Interest 400.2 = Total Enterprise Value (TEV) 34,389.4 Book Value of Common Equity 11,546.7 + Pref. Equity - + Total Minority Interest 400.2 + Total Debt 6,019.1 = Total Capital 17,966.0 Valuation Multiples based on Current Capitalization LTM For the Fiscal Period Ending 12 months 12 months 12 months† 12 months 12 months Mar-31-2012E Mar-31-2011E Mar-31-2010E Sep-30-2009A Mar-31-2009A TEV/Total Revenue - - - 4.4x 3.8x TEV/EBITDA - - - 13.8x 12.2x TEV/EBIT - - - 17.9x 15.6x P/Diluted EPS Before Extra 14.4x 15.8x 18.3x 32.0x 24.0x P/BV - - - 2.4x 3.1x Price/Tang BV - - - 14.3x 16.2x Ratios LTM For the Fiscal Period Ending 12 months 12 months 12 months 12 months 12 months 12 months Sep-30-2009 Mar-31-2009 Mar-31-2008 Mar-31-2007 Mar-31-2006 Mar-31-2005 Profitability Return on Assets % 4.2% 5.8% 6.8% 7.1% 7.5% 9.2% Return on Capital % 5.2% 7.3% 8.9% 9.1% 9.6% 11.9% Return on Equity % 7.9% 11.4% 12.7% 12.0% 13.6% 21.4% Return on Common Equity % 7.9% 11.4% 12.7% 12.0% 13.6% 21.4% Margin Analysis Gross Margin % 66.7% 63.2% 64.0% 64.3% 63.0% 60.8% EBITDA Margin % 25.7% 27.8% 26.6% 27.4% 25.9% 25.3% EBITA Margin % 19.5% 22.2% 21.7% 22.4% 21.5% 20.8% EBIT Margin % 18.4% 21.1% 20.8% 21.3% 20.6% 20.5% Earnings from Cont. Ops Margin % 11.0% 12.6% 11.9% 11.1% 11.6% 14.3% Net Income Margin % 11.0% 12.6% 11.9% 11.1% 11.6% 14.3%