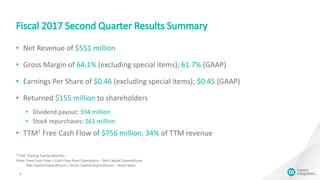
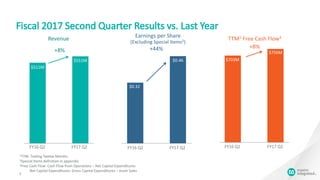
- In the second quarter of fiscal year 2017, the company reported net revenue of $551 million, gross margin of 64.1% excluding special items, and earnings per share of $0.46 excluding special items.
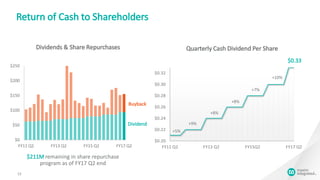
- The company returned $155 million to shareholders in the quarter through $94 million in dividends and $61 million in stock repurchases.
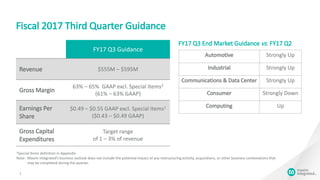
- For the third quarter of fiscal year 2017, the company expects revenue between $555-595 million and earnings per share between $0.49-0.55 excluding special items.