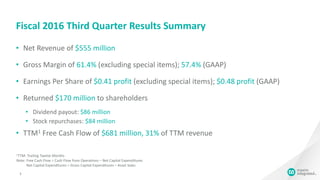
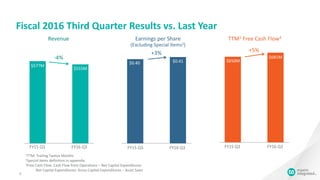
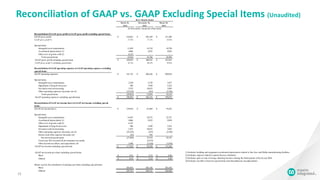
- Net revenue for the third quarter of fiscal year 2016 was $555 million, down 4% from the previous year. Earnings per share were $0.41 excluding special items, up 3% from the previous year.
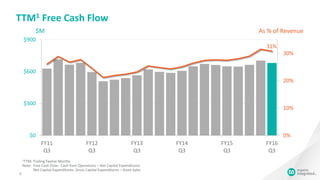
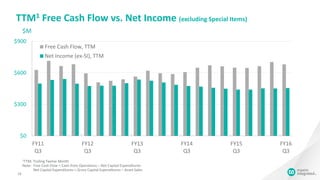
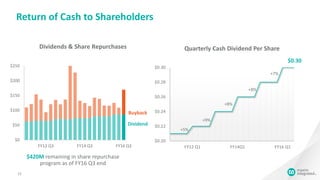
- Free cash flow on a trailing twelve month basis was $681 million, or 31% of revenue. The company returned $170 million to shareholders in the form of dividends and share repurchases.
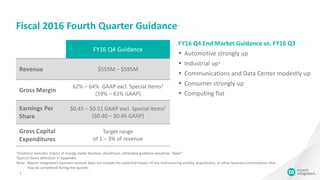
- Guidance for the fourth quarter of fiscal year 2016 forecasts revenue between $555-595 million and earnings per share between $0.45-0.51 excluding special items.