SlideShare a Scribd company logo
1 of 31
Download to read offline
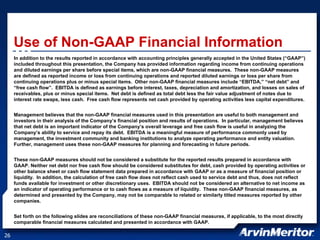
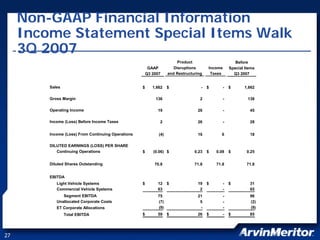
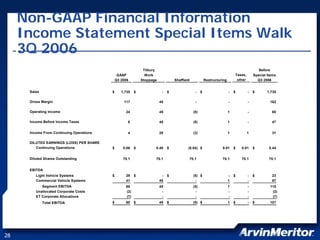
JPMorgan Harbour Auto
    Conference
    August 6, 2007


                                              Jay Craig
                     Senior Vice President and Controller


1
Forward-Looking Statements
      This presentation contains statements relating to future results of the company (including certain projections
     and business trends) that are “forward-looking statements” as defined in the Private Securities Litigation Reform
     Act of 1995. Forward-looking statements are typically identified by words or phrases such as “believe,” “expect,”
     “anticipate,” “estimate,” “should,” “are likely to be,” “will” and similar expressions. Actual results may differ
     materially from those projected as a result of certain risks and uncertainties, including but not limited to global
     economic and market cycles and conditions; the demand for commercial, specialty and light vehicles for which
     the company supplies products; risks inherent in operating abroad (including foreign currency exchange rates
     and potential disruption of production and supply due to terrorist attacks or acts of aggression); availability and
     cost of raw materials, including steel; OEM program delays; demand for and market acceptance of new and
     existing products; successful development of new products; reliance on major OEM customers; labor relations of
     the company, its suppliers and customers, including potential disruptions in supply of parts to our facilities or
     demand for our products due to work stoppages; the financial condition of the company’s suppliers and
     customers, including potential bankruptcies; possible adverse effects of any future suspension of normal trade
     credit terms by our suppliers; potential difficulties competing with companies that have avoided their existing
     contracts in bankruptcy and reorganization proceedings; successful integration of acquired or merged
     businesses; the ability to achieve the expected annual savings and synergies from past and future business
     combinations and the ability to achieve the expected benefits of restructuring actions; success and timing of
     potential divestitures; potential impairment of long-lived assets, including goodwill; competitive product and
     pricing pressures; the amount of the company’s debt; the ability of the company to continue to comply with
     covenants in its financing agreements; the ability of the company to access capital markets; credit ratings of the
     company’s debt; the outcome of existing and any future legal proceedings, including any litigation with respect
     to environmental or asbestos-related matters; rising costs of pension and other post-retirement benefits and
     possible changes in pension and other accounting rules; as well as other risks and uncertainties, including but
     not limited to those detailed herein and from time to time in other filings of the company with the SEC. These
     forward-looking statements are made only as of the date hereof, and the company undertakes no obligation to
     update or revise the forward-looking statements, whether as a result of new information, future events or
     otherwise, except as otherwise required by law.


2
Fiscal Third Quarter Highlights(1)
    • Earned $0.25 per share from continuing operations before special
      items, equal to consensus
    • Light Vehicle Systems year-over-year margin expansion continues
    • Commercial Vehicle Systems profitable in the trough of the 2007
      downturn
    • Completed the sale of Emissions Technologies on May 17
    • Performance Plus teams on track to achieve goals
    • FY 2007 EPS guidance before special items of $0.75 to $0.80
      compared to $0.70 to $0.80 previously
    • Cash flow guidance reduced to a range of $50 million to $100
      million outflow reflecting working capital investments for growth
      outside North America and timing of ET post-closing adjustments
    (1) See Appendix – “Non-GAAP Financial Information”

3
Segment EBITDA Before Special Items(1)
                                                                            Quarter Ended June 30,
    (in millions)
                                                                                            Better/(Worse)
                                                                                                $          %
                                                                 2007          2006
    EBITDA
         Light Vehicle Systems                               $       31)       $         23)   $    8)             35%
         Commercial Vehicle System                                   65)                 87)       (22)        -25%
                Segment EBITDA                                       96)             110)          (14)        -13%
    Unallocated Corporate Costs                                      (2)                 (2)         -             0%
    ET Corporate Allocations                                         (9)                 (7)        (2)        -29%
          Total EBITDA                                       $       85)      $      101)      $   (16)        -16%

    EBITDA Margins
         Light Vehicle Systems (2)                                4.9%              3.8%                 1.1 pts
         Commercial Vehicle System                                6.2%              7.7%             -1.5 pts
    Segment EBITDA Margins                                        5.8%              6.3%             -0.5 pts
            Total EBITDA Margins                                  5.1%              5.8%             -0.7 pts
     •     See Appendix – “Non-GAAP Financial Information”
     •     Adjusted to reflect the impact of reduced volumes in our Brussels operation

4
Q3 Earnings Frequently Asked Questions: (1)
    What happened to free cash flow this quarter?
    (Q3 2007, in millions)
                                                               Free
                                                             Cash Flow
       Discontinued Operations (primarily ET)                $   (114)
       CVS and LVS Receivables
           Volume/Mix Shift from NA to ROW                        (52)
           Performance Net of Factoring and Securitization        (26)
                 Total Receivables                                (78)
       Other Working Capital                                       (4)
       Retiree Benefit Contributions Net of Expense               (14)
       EBITDA, Restructuring, Cash Taxes and Other                 54
            Total Free Cash Flow                             $   (156)
      (1) See Appendix – “Non-GAAP Financial Information”

5
Impact of Sales Mix on Accounts
    Receivable
    (in millions)


                       Typical
                                      Sales in         Sales in
                     Receivables
                    Terms (Days)   Second Quarter   Third Quarter

    North America     60 - 90          51%             47%


    Rest of World    90 - 120          49%             53%


6
Q3 Earnings Frequently Asked Questions:
    Why was the Disc Ops cash outflow so large?

    1. ET business deteriorated, leading directly to outflows
       before closing
    2. Deterioration increased our motivation to complete
       closing, leading us to include other assets
                                     ET EBITDA in Millions (1)
                       $70
                       $60
                       $50
                       $40             5.2
                                     multiple
                       $30                                7.4
                                                        multiple
                       $20
                       $10
                        $0
                                 Fiscal Year 2006    Last 12 Months
                                                      (4/30/2007)
      (1) Including corporate allocations

7
Q3 Earnings Frequently Asked Questions:
    What is the source of the tax benefit in Q4?
     (Q4 2007 in millions)


                                                    Projected Tax
                                                       Benefit

    Resolution of Certain Tax Contingencies           $      7


    Deferred Tax Assets from State Tax Law Change            4


        Total Discrete Items                          $     11


8
Q3 Earnings Frequently Asked Questions:
    How do I know Performance Plus is working?
    • The Performance Plus team reports that ideas implemented to date
      are on the glide path to $75 million savings in 2008 net of
      execution, raw material and pricing risks
    • We will report annual run-rate savings of ideas implemented
      through the fourth quarter at our earnings in mid-November
    • This will allow us to verify savings are reaching the accounted
      actuals
        − Finance team to audit actions-to-results
        − Verify that actions are not double-counted in other variance
          categories
        − Simultaneously verify/revise baseline (annual plan before
          Performance Plus)

9
JPMorgan Harbour Auto
     Conference
     August 6, 2007


                                        Chris Snodgrass
                                           Vice President
                      Manufacturing and Supply Chain, CVS


10
North America Class 8 Volumes
     (Thousands of vehicles)

      FY2007 = 238K vehicles            FY2008 = 250K vehicles    310
      89

                                                     70     70
               71
                                                                           220
                                              60
                                       50
                           42
                                 36


                           28*


                                                                 FY2009   FY2010
               Q2     Q3       Q4       Q1
      Q1                                      Q2     Q3    Q4
                 CY2007 = 198K Vehicles


     * Previous forecast


11
Management of Cycles

     1. ArvinMeritor Production System and lean manufacturing


     2. Investments in core processes


     3. Footprint optimization timing


     4. Other new investments


12
ArvinMeritor Production System
     A version of the Toyota Production                      Wave 1 Lean Fundamentals:
                                                                 – Performance Metrics Board –
     System, tailored to fit ArvinMeritor’s
                                                                    Visual Management
     business model:
                                                                 – Key Process Indicators (KPIs)
        – Customer driven design                                 – 5S
          specifications                                         – Eight Wastes
                                                                 – Value Stream Mapping
        – Higher fluctuation in market
                                                                 – First Time Through (FTT)
          demand
                                                                 – Kaizen and TPM Workshops
        – High product variability and                           – Total Preventative Maintenance
          complexity
        – Diverse manufacturing platforms
        – Traditional manufacturing culture
                                              Productivity


                                                                              Wave 1
                                                                               step
                                                                              change

                                                                     Time


13
Principles of ArvinMeritor Production
     System
                                                           •   Performance and health
     Principles
                                                               management
     • Relentless loss elimination
                                                           •   Organizational design
     • End-to-end design
     • Priority on people– health                          •   Capability building processes
       and safety
                                                           •   Support function processes
                                            Management
                                                           •   Continuous improvement
                                              systems
                                                               infrastructure


                                Operating
                                 systems                   •   Focus – compelling purpose
      •   Material flows                                       and clear direction
      •   Information flows
                                                           •   Execution – people work well
                                             Mindsets,
      •   Quality systems                                      together day-to-day to get
                                            Behaviors &
      •   Maintenance systems                                  things done
                                            Capabilities
      •   Manpower systems                                 •   Skills – people work effectively
                                                               in their roles
                                                           •   Improvement – relentless
                                                               drive to do better

14
Benefits of ArvinMeritor Production
     System


      S        Q            D          C      P
      Safety   Quality      Delivery   Cost   People


                         Sub-Systems

                            Tools


15
Lean Efforts Have Resulted In Significant
     Improvement with Minimal (or no) Investment
        Housing Production
        Units
                                 • Production trend increased
                                   significantly
                                 • Achieved 15% average
                                   improvement to throughput
                                 • Painting throughput has
                                   increased to >900 pieces per
                                   day


        Gear Machining
        Units


                                 • Gear machining production
                                   trend increased
                                 • Achieved 35% average
                                   improvement to throughput


16
Management of Cycles

     1. ArvinMeritor Production System and lean manufacturing


     2. Investments in core processes


     3. Footprint optimization timing


     4. Other new investments


17
Investing in Core Processes
     Layered Capacity Model                                              2006 Industry
                                                                          350K Units
                              Layer 2          Layer 3
                  Layer 2                                      Layer 2
                              Layer 1          Layer 2
                  Layer 1                                      Layer 1
                                               Layer 1
       Class 8
      Industry
     250K-280K                         ArvinMeritor Capacity
                  Process     Process          Process         Process     Assembly
                     A           B                C               D


     Core Process Model
                              Layer 1          Layer 1
       Class 8
      Industry   Non-Core:     Core:                       Non-Core:
                                                 Core:
       300K+     Outsource    Invest                       Outsource
                                                Invest


                  Process     Process          Process         Process     Assembly
                     A           B                C               D


18
Core Process Example: Gear Cutting

     • High value add

     • High leverage to quality and
       capability

     • Invest in the latest technology

     • Invest in capacity
                                              Average Age of
     • $25 million investment              Gear-Cutting Machines

       approved


                                         Before Project   After Project


19
Management of Cycles

     1. ArvinMeritor Production System and lean manufacturing


     2. Investments in core processes


     3. Footprint optimization timing


     4. Other new investments


20
Footprint Optimization Timing

     • Performance Plus restructuring intended to shift capacity
       toward locations with lower total delivered cost

     • Plan includes realignment/consolidation of processes and
       new capacity in low-cost locations

     • Open new plants to support 2009 pre-buy

     • Announcing new axle plant for northern Mexico
        – Expected to open second half of 2008
        – 150K – 250K square feet


21
Management of Cycles

     1. ArvinMeritor Production System and lean manufacturing


     2. Investments in core processes


     3. Footprint optimization timing


     4. Other new investments


22
Expansion of Axles JV in India
                                                                      Automotive Axles, Ltd.
     • Automotive Axles, Ltd. (AAL) is the                                                                Bharat
       largest commercial vehicle axle                                                                    Forge,
                                                                      ARM,
                                                                                                           35%
                                                                      35%
       manufacturer in India
     • Traded on the Indian Stock
       Exchange
     • Sells through 51% ARM-owned JV                                    Publicly
                                                                          Held,

     • Customers include Ashok Leyland,                                   30%


       Mahindra & Mahindra and Tata
     • FY 2007 sales of about $150 million

                                             Sales in Rupees
     • Announcing a significant investment
       to expand AAL’s manufacturing
       capacity to support strong market
       and customer growth in India and
       elsewhere in Asia                                       1998   1999   2000   2001   2002   2003   2004   2005   2006


23
JPMorgan Harbour Auto
     Conference
     August 6, 2007

                                                Jay Craig
                       Senior Vice President and Controller

                                        Chris Snodgrass
                                           Vice President
                      Manufacturing and Supply Chain, CVS


24
Appendix


25
Use of Non-GAAP Financial Information
     In addition to the results reported in accordance with accounting principles generally accepted in the United States (“GAAP”)
     included throughout this presentation, the Company has provided information regarding income from continuing operations
     and diluted earnings per share before special items, which are non-GAAP financial measures. These non-GAAP measures
     are defined as reported income or loss from continuing operations and reported diluted earnings or loss per share from
     continuing operations plus or minus special items. Other non-GAAP financial measures include “EBITDA,” “net debt” and
     “free cash flow”. EBITDA is defined as earnings before interest, taxes, depreciation and amortization, and losses on sales of
     receivables, plus or minus special items. Net debt is defined as total debt less the fair value adjustment of notes due to
     interest rate swaps, less cash. Free cash flow represents net cash provided by operating activities less capital expenditures.


     Management believes that the non-GAAP financial measures used in this presentation are useful to both management and
     investors in their analysis of the Company’s financial position and results of operations. In particular, management believes
     that net debt is an important indicator of the Company’s overall leverage and free cash flow is useful in analyzing the
     Company’s ability to service and repay its debt. EBITDA is a meaningful measure of performance commonly used by
     management, the investment community and banking institutions to analyze operating performance and entity valuation.
     Further, management uses these non-GAAP measures for planning and forecasting in future periods.


     These non-GAAP measures should not be considered a substitute for the reported results prepared in accordance with
     GAAP. Neither net debt nor free cash flow should be considered substitutes for debt, cash provided by operating activities or
     other balance sheet or cash flow statement data prepared in accordance with GAAP or as a measure of financial position or
     liquidity. In addition, the calculation of free cash flow does not reflect cash used to service debt and thus, does not reflect
     funds available for investment or other discretionary uses. EBITDA should not be considered an alternative to net income as
     an indicator of operating performance or to cash flows as a measure of liquidity. These non-GAAP financial measures, as
     determined and presented by the Company, may not be comparable to related or similarly titled measures reported by other
     companies.


     Set forth on the following slides are reconciliations of these non-GAAP financial measures, if applicable, to the most directly
     comparable financial measures calculated and presented in accordance with GAAP.

26
Non-GAAP Financial Information
     Income Statement Special Items Walk
     3Q 2007
                                                                         Product                        Before
                                                                       Disruptions      Income
                                                         GAAP                                        Special Items
                                                                    and Restructuring    Taxes
                                                        Q3 2007                                        Q3 2007


         Sales                                      $      1,662    $               -   $        -   $      1,662

         Gross Margin                                       136                     2            -            138

         Operating Income                                    19                   26             -             45

         Income (Loss) Before Income Taxes                    2                   26             -             28


         Income (Loss) From Continuing Operations             (4)                 16          6                18

         DILUTED EARNINGS (LOSS) PER SHARE
            Continuing Operations                   $      (0.06) $              0.23   $   0.08     $        0.25


         Diluted Shares Outstanding                         70.8                 71.8       71.8              71.8


         EBITDA
            Light Vehicle Systems                   $        12     $             19    $        -   $         31
                                                                                   2             -             65
            Commercial Vehicle Systems                       63
               Segment EBITDA                                75                   21             -             96
            Unallocated Corporate Costs                      (7)                   5             -             (2)
                                                                                   -             -             (9)
                                                             (9)
            ET Corporate Allocations
                                                    $        59     $             26    $        -   $         85
                 Total EBITDA


27
Non-GAAP Financial Information
     Income Statement Special Items Walk
     3Q 2006
                                                              Tilbury                                                                        Before
                                                                                                                             Taxes,
                                               GAAP            Work                                                                       Special Items
                                                                                                                              other
                                              Q3 2006        Stoppage            Sheffield               Restructuring                      Q3 2006


      Sales                               $      1,735   $               -   $                  -    $                   -   $        -   $       1,735

      Gross Margin                                117                   45                      -                        -            -            162

      Operating Income                             24                   45                     (5)                       1            -             65

      Income Before Income Taxes                    6                   45                     (5)                       1            -             47


      Income From Continuing Operations             4                   28                     (3)                       1            1             31

      DILUTED EARNINGS (LOSS) PER SHARE
         Continuing Operations            $       0.06   $          0.40     $           (0.04) $                  0.01      $   0.01     $        0.44


      Diluted Shares Outstanding                  70.1              70.1                     70.1                  70.1          70.1              70.1


      EBITDA
         Light Vehicle Systems            $        28    $               -   $                 (5) $                     -   $        -   $         23
                                                                        45                      -                        1            -             87
         Commercial Vehicle Systems                41
            Segment EBITDA                         69                   45                     (5)                       1            -            110
         Unallocated Corporate Costs               (2)                   -                      -                        -            -             (2)
         ET Corporate Allocations                  (7)                   -                      -                        -            -             (7)
                                          $        60    $              45   $                 (5) $                     1   $        -   $        101
              Total EBITDA


28
Non-GAAP Financial Information
     3Q EBITDA Reconciliation


                                                             Quarter Ended
                                                                   June 30,
                                                          2007                2006
                                                      $           85      $          101
           Total EBITDA - Before Special Items
                                                                 (24)                 (1)
             Restructuring Costs
                                                                  (2)                (45)
             Product Disruptions
             Gain on Divestitures                                  -                   5
             Loss on Sale of Receivables                          (3)                  -
             Depreciation and Amortization                       (32)                (30)
             Interest Expense, Net                               (27)                (28)
             Benefit (Provision) for Income Taxes                 (1)                  2
           Income (Loss) From Continuing Operations   $           (4)    $             4


29
Non-GAAP Financial Information
     Free Cash Flow


                                                                              Three Months Ended June 30,

                                                                                 2007             2006
          Cash provided by (used for operating activities)                $             (127) $          186
                                                                                         (29)            (31)
            Less: Capital Expenditures (1)
                                                                          $             (156) $          155
          Free Cash Flow

          (1) Includes capital expenditures of discontinued operations.


30
31

More Related Content

What's hot

Baird's 2008 Industrial Conference
Baird's 2008 Industrial ConferenceBaird's 2008 Industrial Conference
Baird's 2008 Industrial Conferencefinance46
 
aetna Guidance Summary 2005 4th
aetna Guidance Summary 2005 4th aetna Guidance Summary 2005 4th
aetna Guidance Summary 2005 4th finance9
 
el paso 3Q2005Earnings
el paso  3Q2005Earningsel paso  3Q2005Earnings
el paso 3Q2005Earningsfinance49
 
celanese investor_day_2006_complete_presentation
celanese investor_day_2006_complete_presentationcelanese investor_day_2006_complete_presentation
celanese investor_day_2006_complete_presentationfinance44
 
Pfizer Quarterly Corporate Performance - First Quarter 2008
Pfizer Quarterly Corporate Performance - First Quarter 2008Pfizer Quarterly Corporate Performance - First Quarter 2008
Pfizer Quarterly Corporate Performance - First Quarter 2008finance5
 
Pfizer Quarterly Corporate Performance
Pfizer Quarterly Corporate PerformancePfizer Quarterly Corporate Performance
Pfizer Quarterly Corporate Performancefinance5
 
Third Quarter 2012 Investor Presentation
Third Quarter 2012 Investor PresentationThird Quarter 2012 Investor Presentation
Third Quarter 2012 Investor PresentationCNOServices
 
unum group 4Q 08_Statistical_Supplement
unum group   4Q 08_Statistical_Supplementunum group   4Q 08_Statistical_Supplement
unum group 4Q 08_Statistical_Supplementfinance26
 
celanese 1q06_earnings_slides_-_final
celanese 1q06_earnings_slides_-_finalcelanese 1q06_earnings_slides_-_final
celanese 1q06_earnings_slides_-_finalfinance44
 
Sanjiv Khattri, Executive Vice President and CFO of GMAC Financial Services 2...
Sanjiv Khattri, Executive Vice President and CFO of GMAC Financial Services 2...Sanjiv Khattri, Executive Vice President and CFO of GMAC Financial Services 2...
Sanjiv Khattri, Executive Vice President and CFO of GMAC Financial Services 2...finance8
 
EP1Q2007Earnings_FINAL(Web)
EP1Q2007Earnings_FINAL(Web)EP1Q2007Earnings_FINAL(Web)
EP1Q2007Earnings_FINAL(Web)finance49
 

What's hot (12)

Baird's 2008 Industrial Conference
Baird's 2008 Industrial ConferenceBaird's 2008 Industrial Conference
Baird's 2008 Industrial Conference
 
aetna Guidance Summary 2005 4th
aetna Guidance Summary 2005 4th aetna Guidance Summary 2005 4th
aetna Guidance Summary 2005 4th
 
el paso 3Q2005Earnings
el paso  3Q2005Earningsel paso  3Q2005Earnings
el paso 3Q2005Earnings
 
celanese investor_day_2006_complete_presentation
celanese investor_day_2006_complete_presentationcelanese investor_day_2006_complete_presentation
celanese investor_day_2006_complete_presentation
 
Pfizer Quarterly Corporate Performance - First Quarter 2008
Pfizer Quarterly Corporate Performance - First Quarter 2008Pfizer Quarterly Corporate Performance - First Quarter 2008
Pfizer Quarterly Corporate Performance - First Quarter 2008
 
Pfizer Quarterly Corporate Performance
Pfizer Quarterly Corporate PerformancePfizer Quarterly Corporate Performance
Pfizer Quarterly Corporate Performance
 
Third Quarter 2012 Investor Presentation
Third Quarter 2012 Investor PresentationThird Quarter 2012 Investor Presentation
Third Quarter 2012 Investor Presentation
 
unum group 4Q 08_Statistical_Supplement
unum group   4Q 08_Statistical_Supplementunum group   4Q 08_Statistical_Supplement
unum group 4Q 08_Statistical_Supplement
 
celanese 1q06_earnings_slides_-_final
celanese 1q06_earnings_slides_-_finalcelanese 1q06_earnings_slides_-_final
celanese 1q06_earnings_slides_-_final
 
Ge Q2 2008 Earnings
Ge Q2 2008 EarningsGe Q2 2008 Earnings
Ge Q2 2008 Earnings
 
Sanjiv Khattri, Executive Vice President and CFO of GMAC Financial Services 2...
Sanjiv Khattri, Executive Vice President and CFO of GMAC Financial Services 2...Sanjiv Khattri, Executive Vice President and CFO of GMAC Financial Services 2...
Sanjiv Khattri, Executive Vice President and CFO of GMAC Financial Services 2...
 
EP1Q2007Earnings_FINAL(Web)
EP1Q2007Earnings_FINAL(Web)EP1Q2007Earnings_FINAL(Web)
EP1Q2007Earnings_FINAL(Web)
 

Similar to arvinmeritor ARM_at_JPMorgan_Harbour_2007_FINAL

arvinmeritor 4BB5E682-5686-4507-B498-4C9536248A86_ARM_2009_Barclays_Industria...
arvinmeritor 4BB5E682-5686-4507-B498-4C9536248A86_ARM_2009_Barclays_Industria...arvinmeritor 4BB5E682-5686-4507-B498-4C9536248A86_ARM_2009_Barclays_Industria...
arvinmeritor 4BB5E682-5686-4507-B498-4C9536248A86_ARM_2009_Barclays_Industria...finance27
 
arvinmeritor UBS_Debt_Conference_050907
arvinmeritor UBS_Debt_Conference_050907arvinmeritor UBS_Debt_Conference_050907
arvinmeritor UBS_Debt_Conference_050907finance27
 
arvinmeritor UBS_Debt_Conference_050907
arvinmeritor UBS_Debt_Conference_050907arvinmeritor UBS_Debt_Conference_050907
arvinmeritor UBS_Debt_Conference_050907finance27
 
Ge Q4 2008 Financial Results
Ge Q4 2008 Financial ResultsGe Q4 2008 Financial Results
Ge Q4 2008 Financial Resultsearningsreport
 
el paso 08_072QEarnings
el paso  08_072QEarningsel paso  08_072QEarnings
el paso 08_072QEarningsfinance49
 
arvinmeritor 2007_Q_Earnings_Slides
arvinmeritor 2007_Q_Earnings_Slidesarvinmeritor 2007_Q_Earnings_Slides
arvinmeritor 2007_Q_Earnings_Slidesfinance27
 
arvinmeritor 2007_Q_Earnings_Slides
arvinmeritor 2007_Q_Earnings_Slidesarvinmeritor 2007_Q_Earnings_Slides
arvinmeritor 2007_Q_Earnings_Slidesfinance27
 
Earning Presentation of General Motors: Q3 2007
Earning Presentation of General Motors: Q3 2007Earning Presentation of General Motors: Q3 2007
Earning Presentation of General Motors: Q3 2007investorrelation
 
office depot Q408 earnings pres
office depot Q408 earnings presoffice depot Q408 earnings pres
office depot Q408 earnings presfinance17
 
office depot Q408 earnings pres
office depot Q408 earnings presoffice depot Q408 earnings pres
office depot Q408 earnings presfinance17
 
arvinmeritor 096B2E46-E199-4B72-85A7-A3AA2464D0AA_Shareowners_Presentation_FI...
arvinmeritor 096B2E46-E199-4B72-85A7-A3AA2464D0AA_Shareowners_Presentation_FI...arvinmeritor 096B2E46-E199-4B72-85A7-A3AA2464D0AA_Shareowners_Presentation_FI...
arvinmeritor 096B2E46-E199-4B72-85A7-A3AA2464D0AA_Shareowners_Presentation_FI...finance27
 
northrop grumman Earnings Announcement 2007 4th
northrop grumman Earnings Announcement 2007 4th northrop grumman Earnings Announcement 2007 4th
northrop grumman Earnings Announcement 2007 4th finance8
 
northrop grumman Earnings Announcement 2007 2nd
northrop grumman Earnings Announcement 2007 2ndnorthrop grumman Earnings Announcement 2007 2nd
northrop grumman Earnings Announcement 2007 2ndfinance8
 
RYDERFINAL R2Q05
RYDERFINAL R2Q05RYDERFINAL R2Q05
RYDERFINAL R2Q05finance44
 
RYDERFINAL R2Q05
RYDERFINAL R2Q05RYDERFINAL R2Q05
RYDERFINAL R2Q05finance44
 
progressive mreport-12/05
progressive mreport-12/05progressive mreport-12/05
progressive mreport-12/05finance18
 
progressive mreport-12/05
progressive mreport-12/05progressive mreport-12/05
progressive mreport-12/05finance18
 

Similar to arvinmeritor ARM_at_JPMorgan_Harbour_2007_FINAL (20)

arvinmeritor 4BB5E682-5686-4507-B498-4C9536248A86_ARM_2009_Barclays_Industria...
arvinmeritor 4BB5E682-5686-4507-B498-4C9536248A86_ARM_2009_Barclays_Industria...arvinmeritor 4BB5E682-5686-4507-B498-4C9536248A86_ARM_2009_Barclays_Industria...
arvinmeritor 4BB5E682-5686-4507-B498-4C9536248A86_ARM_2009_Barclays_Industria...
 
arvinmeritor UBS_Debt_Conference_050907
arvinmeritor UBS_Debt_Conference_050907arvinmeritor UBS_Debt_Conference_050907
arvinmeritor UBS_Debt_Conference_050907
 
arvinmeritor UBS_Debt_Conference_050907
arvinmeritor UBS_Debt_Conference_050907arvinmeritor UBS_Debt_Conference_050907
arvinmeritor UBS_Debt_Conference_050907
 
Ge Q4 2008 Financial Results
Ge Q4 2008 Financial ResultsGe Q4 2008 Financial Results
Ge Q4 2008 Financial Results
 
el paso 08_072QEarnings
el paso  08_072QEarningsel paso  08_072QEarnings
el paso 08_072QEarnings
 
arvinmeritor 2007_Q_Earnings_Slides
arvinmeritor 2007_Q_Earnings_Slidesarvinmeritor 2007_Q_Earnings_Slides
arvinmeritor 2007_Q_Earnings_Slides
 
arvinmeritor 2007_Q_Earnings_Slides
arvinmeritor 2007_Q_Earnings_Slidesarvinmeritor 2007_Q_Earnings_Slides
arvinmeritor 2007_Q_Earnings_Slides
 
3Q05FINAL
3Q05FINAL3Q05FINAL
3Q05FINAL
 
3Q05FINAL
3Q05FINAL3Q05FINAL
3Q05FINAL
 
Earning Presentation of General Motors: Q3 2007
Earning Presentation of General Motors: Q3 2007Earning Presentation of General Motors: Q3 2007
Earning Presentation of General Motors: Q3 2007
 
office depot Q408 earnings pres
office depot Q408 earnings presoffice depot Q408 earnings pres
office depot Q408 earnings pres
 
office depot Q408 earnings pres
office depot Q408 earnings presoffice depot Q408 earnings pres
office depot Q408 earnings pres
 
arvinmeritor 096B2E46-E199-4B72-85A7-A3AA2464D0AA_Shareowners_Presentation_FI...
arvinmeritor 096B2E46-E199-4B72-85A7-A3AA2464D0AA_Shareowners_Presentation_FI...arvinmeritor 096B2E46-E199-4B72-85A7-A3AA2464D0AA_Shareowners_Presentation_FI...
arvinmeritor 096B2E46-E199-4B72-85A7-A3AA2464D0AA_Shareowners_Presentation_FI...
 
arvinmeritor 096B2E46-E199-4B72-85A7-A3AA2464D0AA_Shareowners_Presentation_FI...
arvinmeritor 096B2E46-E199-4B72-85A7-A3AA2464D0AA_Shareowners_Presentation_FI...arvinmeritor 096B2E46-E199-4B72-85A7-A3AA2464D0AA_Shareowners_Presentation_FI...
arvinmeritor 096B2E46-E199-4B72-85A7-A3AA2464D0AA_Shareowners_Presentation_FI...
 
northrop grumman Earnings Announcement 2007 4th
northrop grumman Earnings Announcement 2007 4th northrop grumman Earnings Announcement 2007 4th
northrop grumman Earnings Announcement 2007 4th
 
northrop grumman Earnings Announcement 2007 2nd
northrop grumman Earnings Announcement 2007 2ndnorthrop grumman Earnings Announcement 2007 2nd
northrop grumman Earnings Announcement 2007 2nd
 
RYDERFINAL R2Q05
RYDERFINAL R2Q05RYDERFINAL R2Q05
RYDERFINAL R2Q05
 
RYDERFINAL R2Q05
RYDERFINAL R2Q05RYDERFINAL R2Q05
RYDERFINAL R2Q05
 
progressive mreport-12/05
progressive mreport-12/05progressive mreport-12/05
progressive mreport-12/05
 
progressive mreport-12/05
progressive mreport-12/05progressive mreport-12/05
progressive mreport-12/05
 

More from finance27

commercial metals Overview_03/08
commercial metals Overview_03/08commercial metals Overview_03/08
commercial metals Overview_03/08finance27
 
commercial metals 2Q 08_Presentation
commercial metals 2Q 08_Presentationcommercial metals 2Q 08_Presentation
commercial metals 2Q 08_Presentationfinance27
 
commercial metals BofA_05/08
commercial metals BofA_05/08commercial metals BofA_05/08
commercial metals BofA_05/08finance27
 
commercial metals Overview_06/08_2
commercial metals Overview_06/08_2commercial metals Overview_06/08_2
commercial metals Overview_06/08_2finance27
 
commercial metals Q3 08_Presentation
commercial metals Q3 08_Presentationcommercial metals Q3 08_Presentation
commercial metals Q3 08_Presentationfinance27
 
commercial metals Q3 08_Presentation
commercial metals Q3 08_Presentationcommercial metals Q3 08_Presentation
commercial metals Q3 08_Presentationfinance27
 
commercial metals Hodges_09/08
commercial metals Hodges_09/08commercial metals Hodges_09/08
commercial metals Hodges_09/08finance27
 
commercial metals 4thQ 2008
commercial metals 4thQ 2008commercial metals 4thQ 2008
commercial metals 4thQ 2008finance27
 
commercial metals 4thQ 2008
commercial metals  4thQ 2008commercial metals  4thQ 2008
commercial metals 4thQ 2008finance27
 
commercial metals GoldmanSachs_12/04/08
commercial metals GoldmanSachs_12/04/08commercial metals GoldmanSachs_12/04/08
commercial metals GoldmanSachs_12/04/08finance27
 
commercial metals 12/02/05TwinsBroch
commercial metals 12/02/05TwinsBrochcommercial metals 12/02/05TwinsBroch
commercial metals 12/02/05TwinsBrochfinance27
 
commercial metals 12/02/05TwinsBroch
commercial metals 12/02/05TwinsBrochcommercial metals 12/02/05TwinsBroch
commercial metals 12/02/05TwinsBrochfinance27
 
commercial metals 12/02/05TwinsBroch
commercial metals 12/02/05TwinsBrochcommercial metals 12/02/05TwinsBroch
commercial metals 12/02/05TwinsBrochfinance27
 
commercial metals 2005AR
commercial metals 2005ARcommercial metals 2005AR
commercial metals 2005ARfinance27
 
commercial metals 2005AR
commercial metals 2005ARcommercial metals 2005AR
commercial metals 2005ARfinance27
 
commercial metals 2005AR
commercial metals 2005ARcommercial metals 2005AR
commercial metals 2005ARfinance27
 
commercial metals AR_2006
commercial metals AR_2006commercial metals AR_2006
commercial metals AR_2006finance27
 
commercial metals AR_2006
commercial metals AR_2006commercial metals AR_2006
commercial metals AR_2006finance27
 
commercial metals AR_2006
commercial metals AR_2006commercial metals AR_2006
commercial metals AR_2006finance27
 
commercial metals 2007_AR
commercial metals 2007_ARcommercial metals 2007_AR
commercial metals 2007_ARfinance27
 

More from finance27 (20)

commercial metals Overview_03/08
commercial metals Overview_03/08commercial metals Overview_03/08
commercial metals Overview_03/08
 
commercial metals 2Q 08_Presentation
commercial metals 2Q 08_Presentationcommercial metals 2Q 08_Presentation
commercial metals 2Q 08_Presentation
 
commercial metals BofA_05/08
commercial metals BofA_05/08commercial metals BofA_05/08
commercial metals BofA_05/08
 
commercial metals Overview_06/08_2
commercial metals Overview_06/08_2commercial metals Overview_06/08_2
commercial metals Overview_06/08_2
 
commercial metals Q3 08_Presentation
commercial metals Q3 08_Presentationcommercial metals Q3 08_Presentation
commercial metals Q3 08_Presentation
 
commercial metals Q3 08_Presentation
commercial metals Q3 08_Presentationcommercial metals Q3 08_Presentation
commercial metals Q3 08_Presentation
 
commercial metals Hodges_09/08
commercial metals Hodges_09/08commercial metals Hodges_09/08
commercial metals Hodges_09/08
 
commercial metals 4thQ 2008
commercial metals 4thQ 2008commercial metals 4thQ 2008
commercial metals 4thQ 2008
 
commercial metals 4thQ 2008
commercial metals  4thQ 2008commercial metals  4thQ 2008
commercial metals 4thQ 2008
 
commercial metals GoldmanSachs_12/04/08
commercial metals GoldmanSachs_12/04/08commercial metals GoldmanSachs_12/04/08
commercial metals GoldmanSachs_12/04/08
 
commercial metals 12/02/05TwinsBroch
commercial metals 12/02/05TwinsBrochcommercial metals 12/02/05TwinsBroch
commercial metals 12/02/05TwinsBroch
 
commercial metals 12/02/05TwinsBroch
commercial metals 12/02/05TwinsBrochcommercial metals 12/02/05TwinsBroch
commercial metals 12/02/05TwinsBroch
 
commercial metals 12/02/05TwinsBroch
commercial metals 12/02/05TwinsBrochcommercial metals 12/02/05TwinsBroch
commercial metals 12/02/05TwinsBroch
 
commercial metals 2005AR
commercial metals 2005ARcommercial metals 2005AR
commercial metals 2005AR
 
commercial metals 2005AR
commercial metals 2005ARcommercial metals 2005AR
commercial metals 2005AR
 
commercial metals 2005AR
commercial metals 2005ARcommercial metals 2005AR
commercial metals 2005AR
 
commercial metals AR_2006
commercial metals AR_2006commercial metals AR_2006
commercial metals AR_2006
 
commercial metals AR_2006
commercial metals AR_2006commercial metals AR_2006
commercial metals AR_2006
 
commercial metals AR_2006
commercial metals AR_2006commercial metals AR_2006
commercial metals AR_2006
 
commercial metals 2007_AR
commercial metals 2007_ARcommercial metals 2007_AR
commercial metals 2007_AR
 

Recently uploaded

02_Fabio Colombo_Accenture_MeetupDora&Cybersecurity.pptx
02_Fabio Colombo_Accenture_MeetupDora&Cybersecurity.pptx02_Fabio Colombo_Accenture_MeetupDora&Cybersecurity.pptx
02_Fabio Colombo_Accenture_MeetupDora&Cybersecurity.pptxFinTech Belgium
 
Malad Call Girl in Services 9892124323 | ₹,4500 With Room Free Delivery
Malad Call Girl in Services  9892124323 | ₹,4500 With Room Free DeliveryMalad Call Girl in Services  9892124323 | ₹,4500 With Room Free Delivery
Malad Call Girl in Services 9892124323 | ₹,4500 With Room Free DeliveryPooja Nehwal
 
call girls in Nand Nagri (DELHI) 🔝 >༒9953330565🔝 genuine Escort Service 🔝✔️✔️
call girls in  Nand Nagri (DELHI) 🔝 >༒9953330565🔝 genuine Escort Service 🔝✔️✔️call girls in  Nand Nagri (DELHI) 🔝 >༒9953330565🔝 genuine Escort Service 🔝✔️✔️
call girls in Nand Nagri (DELHI) 🔝 >༒9953330565🔝 genuine Escort Service 🔝✔️✔️9953056974 Low Rate Call Girls In Saket, Delhi NCR
 
06_Joeri Van Speybroek_Dell_MeetupDora&Cybersecurity.pdf
06_Joeri Van Speybroek_Dell_MeetupDora&Cybersecurity.pdf06_Joeri Van Speybroek_Dell_MeetupDora&Cybersecurity.pdf
06_Joeri Van Speybroek_Dell_MeetupDora&Cybersecurity.pdfFinTech Belgium
 
Andheri Call Girls In 9825968104 Mumbai Hot Models
Andheri Call Girls In 9825968104 Mumbai Hot ModelsAndheri Call Girls In 9825968104 Mumbai Hot Models
Andheri Call Girls In 9825968104 Mumbai Hot Modelshematsharma006
 
Vip B Aizawl Call Girls #9907093804 Contact Number Escorts Service Aizawl
Vip B Aizawl Call Girls #9907093804 Contact Number Escorts Service AizawlVip B Aizawl Call Girls #9907093804 Contact Number Escorts Service Aizawl
Vip B Aizawl Call Girls #9907093804 Contact Number Escorts Service Aizawlmakika9823
 
High Class Call Girls Nagpur Grishma Call 7001035870 Meet With Nagpur Escorts
High Class Call Girls Nagpur Grishma Call 7001035870 Meet With Nagpur EscortsHigh Class Call Girls Nagpur Grishma Call 7001035870 Meet With Nagpur Escorts
High Class Call Girls Nagpur Grishma Call 7001035870 Meet With Nagpur Escortsranjana rawat
 
The Economic History of the U.S. Lecture 19.pdf
The Economic History of the U.S. Lecture 19.pdfThe Economic History of the U.S. Lecture 19.pdf
The Economic History of the U.S. Lecture 19.pdfGale Pooley
 
VIP Call Girls LB Nagar ( Hyderabad ) Phone 8250192130 | ₹5k To 25k With Room...
VIP Call Girls LB Nagar ( Hyderabad ) Phone 8250192130 | ₹5k To 25k With Room...VIP Call Girls LB Nagar ( Hyderabad ) Phone 8250192130 | ₹5k To 25k With Room...
VIP Call Girls LB Nagar ( Hyderabad ) Phone 8250192130 | ₹5k To 25k With Room...Suhani Kapoor
 
Quarter 4- Module 3 Principles of Marketing
Quarter 4- Module 3 Principles of MarketingQuarter 4- Module 3 Principles of Marketing
Quarter 4- Module 3 Principles of MarketingMaristelaRamos12
 
Stock Market Brief Deck for 4/24/24 .pdf
Stock Market Brief Deck for 4/24/24 .pdfStock Market Brief Deck for 4/24/24 .pdf
Stock Market Brief Deck for 4/24/24 .pdfMichael Silva
 
Interimreport1 January–31 March2024 Elo Mutual Pension Insurance Company
Interimreport1 January–31 March2024 Elo Mutual Pension Insurance CompanyInterimreport1 January–31 March2024 Elo Mutual Pension Insurance Company
Interimreport1 January–31 March2024 Elo Mutual Pension Insurance CompanyTyöeläkeyhtiö Elo
 
Booking open Available Pune Call Girls Shivane 6297143586 Call Hot Indian Gi...
Booking open Available Pune Call Girls Shivane  6297143586 Call Hot Indian Gi...Booking open Available Pune Call Girls Shivane  6297143586 Call Hot Indian Gi...
Booking open Available Pune Call Girls Shivane 6297143586 Call Hot Indian Gi...Call Girls in Nagpur High Profile
 
Best VIP Call Girls Noida Sector 18 Call Me: 8448380779
Best VIP Call Girls Noida Sector 18 Call Me: 8448380779Best VIP Call Girls Noida Sector 18 Call Me: 8448380779
Best VIP Call Girls Noida Sector 18 Call Me: 8448380779Delhi Call girls
 
Call Girls Service Nagpur Maya Call 7001035870 Meet With Nagpur Escorts
Call Girls Service Nagpur Maya Call 7001035870 Meet With Nagpur EscortsCall Girls Service Nagpur Maya Call 7001035870 Meet With Nagpur Escorts
Call Girls Service Nagpur Maya Call 7001035870 Meet With Nagpur Escortsranjana rawat
 
The Economic History of the U.S. Lecture 18.pdf
The Economic History of the U.S. Lecture 18.pdfThe Economic History of the U.S. Lecture 18.pdf
The Economic History of the U.S. Lecture 18.pdfGale Pooley
 
03_Emmanuel Ndiaye_Degroof Petercam.pptx
03_Emmanuel Ndiaye_Degroof Petercam.pptx03_Emmanuel Ndiaye_Degroof Petercam.pptx
03_Emmanuel Ndiaye_Degroof Petercam.pptxFinTech Belgium
 
VIP Call Girls Thane Sia 8617697112 Independent Escort Service Thane
VIP Call Girls Thane Sia 8617697112 Independent Escort Service ThaneVIP Call Girls Thane Sia 8617697112 Independent Escort Service Thane
VIP Call Girls Thane Sia 8617697112 Independent Escort Service ThaneCall girls in Ahmedabad High profile
 
Call US 📞 9892124323 ✅ Kurla Call Girls In Kurla ( Mumbai ) secure service
Call US 📞 9892124323 ✅ Kurla Call Girls In Kurla ( Mumbai ) secure serviceCall US 📞 9892124323 ✅ Kurla Call Girls In Kurla ( Mumbai ) secure service
Call US 📞 9892124323 ✅ Kurla Call Girls In Kurla ( Mumbai ) secure servicePooja Nehwal
 

Recently uploaded (20)

02_Fabio Colombo_Accenture_MeetupDora&Cybersecurity.pptx
02_Fabio Colombo_Accenture_MeetupDora&Cybersecurity.pptx02_Fabio Colombo_Accenture_MeetupDora&Cybersecurity.pptx
02_Fabio Colombo_Accenture_MeetupDora&Cybersecurity.pptx
 
Malad Call Girl in Services 9892124323 | ₹,4500 With Room Free Delivery
Malad Call Girl in Services  9892124323 | ₹,4500 With Room Free DeliveryMalad Call Girl in Services  9892124323 | ₹,4500 With Room Free Delivery
Malad Call Girl in Services 9892124323 | ₹,4500 With Room Free Delivery
 
call girls in Nand Nagri (DELHI) 🔝 >༒9953330565🔝 genuine Escort Service 🔝✔️✔️
call girls in  Nand Nagri (DELHI) 🔝 >༒9953330565🔝 genuine Escort Service 🔝✔️✔️call girls in  Nand Nagri (DELHI) 🔝 >༒9953330565🔝 genuine Escort Service 🔝✔️✔️
call girls in Nand Nagri (DELHI) 🔝 >༒9953330565🔝 genuine Escort Service 🔝✔️✔️
 
06_Joeri Van Speybroek_Dell_MeetupDora&Cybersecurity.pdf
06_Joeri Van Speybroek_Dell_MeetupDora&Cybersecurity.pdf06_Joeri Van Speybroek_Dell_MeetupDora&Cybersecurity.pdf
06_Joeri Van Speybroek_Dell_MeetupDora&Cybersecurity.pdf
 
Andheri Call Girls In 9825968104 Mumbai Hot Models
Andheri Call Girls In 9825968104 Mumbai Hot ModelsAndheri Call Girls In 9825968104 Mumbai Hot Models
Andheri Call Girls In 9825968104 Mumbai Hot Models
 
Vip B Aizawl Call Girls #9907093804 Contact Number Escorts Service Aizawl
Vip B Aizawl Call Girls #9907093804 Contact Number Escorts Service AizawlVip B Aizawl Call Girls #9907093804 Contact Number Escorts Service Aizawl
Vip B Aizawl Call Girls #9907093804 Contact Number Escorts Service Aizawl
 
High Class Call Girls Nagpur Grishma Call 7001035870 Meet With Nagpur Escorts
High Class Call Girls Nagpur Grishma Call 7001035870 Meet With Nagpur EscortsHigh Class Call Girls Nagpur Grishma Call 7001035870 Meet With Nagpur Escorts
High Class Call Girls Nagpur Grishma Call 7001035870 Meet With Nagpur Escorts
 
The Economic History of the U.S. Lecture 19.pdf
The Economic History of the U.S. Lecture 19.pdfThe Economic History of the U.S. Lecture 19.pdf
The Economic History of the U.S. Lecture 19.pdf
 
VIP Call Girls LB Nagar ( Hyderabad ) Phone 8250192130 | ₹5k To 25k With Room...
VIP Call Girls LB Nagar ( Hyderabad ) Phone 8250192130 | ₹5k To 25k With Room...VIP Call Girls LB Nagar ( Hyderabad ) Phone 8250192130 | ₹5k To 25k With Room...
VIP Call Girls LB Nagar ( Hyderabad ) Phone 8250192130 | ₹5k To 25k With Room...
 
Quarter 4- Module 3 Principles of Marketing
Quarter 4- Module 3 Principles of MarketingQuarter 4- Module 3 Principles of Marketing
Quarter 4- Module 3 Principles of Marketing
 
Stock Market Brief Deck for 4/24/24 .pdf
Stock Market Brief Deck for 4/24/24 .pdfStock Market Brief Deck for 4/24/24 .pdf
Stock Market Brief Deck for 4/24/24 .pdf
 
Interimreport1 January–31 March2024 Elo Mutual Pension Insurance Company
Interimreport1 January–31 March2024 Elo Mutual Pension Insurance CompanyInterimreport1 January–31 March2024 Elo Mutual Pension Insurance Company
Interimreport1 January–31 March2024 Elo Mutual Pension Insurance Company
 
Booking open Available Pune Call Girls Shivane 6297143586 Call Hot Indian Gi...
Booking open Available Pune Call Girls Shivane  6297143586 Call Hot Indian Gi...Booking open Available Pune Call Girls Shivane  6297143586 Call Hot Indian Gi...
Booking open Available Pune Call Girls Shivane 6297143586 Call Hot Indian Gi...
 
Best VIP Call Girls Noida Sector 18 Call Me: 8448380779
Best VIP Call Girls Noida Sector 18 Call Me: 8448380779Best VIP Call Girls Noida Sector 18 Call Me: 8448380779
Best VIP Call Girls Noida Sector 18 Call Me: 8448380779
 
Call Girls Service Nagpur Maya Call 7001035870 Meet With Nagpur Escorts
Call Girls Service Nagpur Maya Call 7001035870 Meet With Nagpur EscortsCall Girls Service Nagpur Maya Call 7001035870 Meet With Nagpur Escorts
Call Girls Service Nagpur Maya Call 7001035870 Meet With Nagpur Escorts
 
The Economic History of the U.S. Lecture 18.pdf
The Economic History of the U.S. Lecture 18.pdfThe Economic History of the U.S. Lecture 18.pdf
The Economic History of the U.S. Lecture 18.pdf
 
03_Emmanuel Ndiaye_Degroof Petercam.pptx
03_Emmanuel Ndiaye_Degroof Petercam.pptx03_Emmanuel Ndiaye_Degroof Petercam.pptx
03_Emmanuel Ndiaye_Degroof Petercam.pptx
 
VIP Call Girls Thane Sia 8617697112 Independent Escort Service Thane
VIP Call Girls Thane Sia 8617697112 Independent Escort Service ThaneVIP Call Girls Thane Sia 8617697112 Independent Escort Service Thane
VIP Call Girls Thane Sia 8617697112 Independent Escort Service Thane
 
Veritas Interim Report 1 January–31 March 2024
Veritas Interim Report 1 January–31 March 2024Veritas Interim Report 1 January–31 March 2024
Veritas Interim Report 1 January–31 March 2024
 
Call US 📞 9892124323 ✅ Kurla Call Girls In Kurla ( Mumbai ) secure service
Call US 📞 9892124323 ✅ Kurla Call Girls In Kurla ( Mumbai ) secure serviceCall US 📞 9892124323 ✅ Kurla Call Girls In Kurla ( Mumbai ) secure service
Call US 📞 9892124323 ✅ Kurla Call Girls In Kurla ( Mumbai ) secure service
 

arvinmeritor ARM_at_JPMorgan_Harbour_2007_FINAL

  • 1. JPMorgan Harbour Auto Conference August 6, 2007 Jay Craig Senior Vice President and Controller 1
  • 2. Forward-Looking Statements This presentation contains statements relating to future results of the company (including certain projections and business trends) that are “forward-looking statements” as defined in the Private Securities Litigation Reform Act of 1995. Forward-looking statements are typically identified by words or phrases such as “believe,” “expect,” “anticipate,” “estimate,” “should,” “are likely to be,” “will” and similar expressions. Actual results may differ materially from those projected as a result of certain risks and uncertainties, including but not limited to global economic and market cycles and conditions; the demand for commercial, specialty and light vehicles for which the company supplies products; risks inherent in operating abroad (including foreign currency exchange rates and potential disruption of production and supply due to terrorist attacks or acts of aggression); availability and cost of raw materials, including steel; OEM program delays; demand for and market acceptance of new and existing products; successful development of new products; reliance on major OEM customers; labor relations of the company, its suppliers and customers, including potential disruptions in supply of parts to our facilities or demand for our products due to work stoppages; the financial condition of the company’s suppliers and customers, including potential bankruptcies; possible adverse effects of any future suspension of normal trade credit terms by our suppliers; potential difficulties competing with companies that have avoided their existing contracts in bankruptcy and reorganization proceedings; successful integration of acquired or merged businesses; the ability to achieve the expected annual savings and synergies from past and future business combinations and the ability to achieve the expected benefits of restructuring actions; success and timing of potential divestitures; potential impairment of long-lived assets, including goodwill; competitive product and pricing pressures; the amount of the company’s debt; the ability of the company to continue to comply with covenants in its financing agreements; the ability of the company to access capital markets; credit ratings of the company’s debt; the outcome of existing and any future legal proceedings, including any litigation with respect to environmental or asbestos-related matters; rising costs of pension and other post-retirement benefits and possible changes in pension and other accounting rules; as well as other risks and uncertainties, including but not limited to those detailed herein and from time to time in other filings of the company with the SEC. These forward-looking statements are made only as of the date hereof, and the company undertakes no obligation to update or revise the forward-looking statements, whether as a result of new information, future events or otherwise, except as otherwise required by law. 2
  • 3. Fiscal Third Quarter Highlights(1) • Earned $0.25 per share from continuing operations before special items, equal to consensus • Light Vehicle Systems year-over-year margin expansion continues • Commercial Vehicle Systems profitable in the trough of the 2007 downturn • Completed the sale of Emissions Technologies on May 17 • Performance Plus teams on track to achieve goals • FY 2007 EPS guidance before special items of $0.75 to $0.80 compared to $0.70 to $0.80 previously • Cash flow guidance reduced to a range of $50 million to $100 million outflow reflecting working capital investments for growth outside North America and timing of ET post-closing adjustments (1) See Appendix – “Non-GAAP Financial Information” 3
  • 4. Segment EBITDA Before Special Items(1) Quarter Ended June 30, (in millions) Better/(Worse) $ % 2007 2006 EBITDA Light Vehicle Systems $ 31) $ 23) $ 8) 35% Commercial Vehicle System 65) 87) (22) -25% Segment EBITDA 96) 110) (14) -13% Unallocated Corporate Costs (2) (2) - 0% ET Corporate Allocations (9) (7) (2) -29% Total EBITDA $ 85) $ 101) $ (16) -16% EBITDA Margins Light Vehicle Systems (2) 4.9% 3.8% 1.1 pts Commercial Vehicle System 6.2% 7.7% -1.5 pts Segment EBITDA Margins 5.8% 6.3% -0.5 pts Total EBITDA Margins 5.1% 5.8% -0.7 pts • See Appendix – “Non-GAAP Financial Information” • Adjusted to reflect the impact of reduced volumes in our Brussels operation 4
  • 5. Q3 Earnings Frequently Asked Questions: (1) What happened to free cash flow this quarter? (Q3 2007, in millions) Free Cash Flow Discontinued Operations (primarily ET) $ (114) CVS and LVS Receivables Volume/Mix Shift from NA to ROW (52) Performance Net of Factoring and Securitization (26) Total Receivables (78) Other Working Capital (4) Retiree Benefit Contributions Net of Expense (14) EBITDA, Restructuring, Cash Taxes and Other 54 Total Free Cash Flow $ (156) (1) See Appendix – “Non-GAAP Financial Information” 5
  • 6. Impact of Sales Mix on Accounts Receivable (in millions) Typical Sales in Sales in Receivables Terms (Days) Second Quarter Third Quarter North America 60 - 90 51% 47% Rest of World 90 - 120 49% 53% 6
  • 7. Q3 Earnings Frequently Asked Questions: Why was the Disc Ops cash outflow so large? 1. ET business deteriorated, leading directly to outflows before closing 2. Deterioration increased our motivation to complete closing, leading us to include other assets ET EBITDA in Millions (1) $70 $60 $50 $40 5.2 multiple $30 7.4 multiple $20 $10 $0 Fiscal Year 2006 Last 12 Months (4/30/2007) (1) Including corporate allocations 7
  • 8. Q3 Earnings Frequently Asked Questions: What is the source of the tax benefit in Q4? (Q4 2007 in millions) Projected Tax Benefit Resolution of Certain Tax Contingencies $ 7 Deferred Tax Assets from State Tax Law Change 4 Total Discrete Items $ 11 8
  • 9. Q3 Earnings Frequently Asked Questions: How do I know Performance Plus is working? • The Performance Plus team reports that ideas implemented to date are on the glide path to $75 million savings in 2008 net of execution, raw material and pricing risks • We will report annual run-rate savings of ideas implemented through the fourth quarter at our earnings in mid-November • This will allow us to verify savings are reaching the accounted actuals − Finance team to audit actions-to-results − Verify that actions are not double-counted in other variance categories − Simultaneously verify/revise baseline (annual plan before Performance Plus) 9
  • 10. JPMorgan Harbour Auto Conference August 6, 2007 Chris Snodgrass Vice President Manufacturing and Supply Chain, CVS 10
  • 11. North America Class 8 Volumes (Thousands of vehicles) FY2007 = 238K vehicles FY2008 = 250K vehicles 310 89 70 70 71 220 60 50 42 36 28* FY2009 FY2010 Q2 Q3 Q4 Q1 Q1 Q2 Q3 Q4 CY2007 = 198K Vehicles * Previous forecast 11
  • 12. Management of Cycles 1. ArvinMeritor Production System and lean manufacturing 2. Investments in core processes 3. Footprint optimization timing 4. Other new investments 12
  • 13. ArvinMeritor Production System A version of the Toyota Production Wave 1 Lean Fundamentals: – Performance Metrics Board – System, tailored to fit ArvinMeritor’s Visual Management business model: – Key Process Indicators (KPIs) – Customer driven design – 5S specifications – Eight Wastes – Value Stream Mapping – Higher fluctuation in market – First Time Through (FTT) demand – Kaizen and TPM Workshops – High product variability and – Total Preventative Maintenance complexity – Diverse manufacturing platforms – Traditional manufacturing culture Productivity Wave 1 step change Time 13
  • 14. Principles of ArvinMeritor Production System • Performance and health Principles management • Relentless loss elimination • Organizational design • End-to-end design • Priority on people– health • Capability building processes and safety • Support function processes Management • Continuous improvement systems infrastructure Operating systems • Focus – compelling purpose • Material flows and clear direction • Information flows • Execution – people work well Mindsets, • Quality systems together day-to-day to get Behaviors & • Maintenance systems things done Capabilities • Manpower systems • Skills – people work effectively in their roles • Improvement – relentless drive to do better 14
  • 15. Benefits of ArvinMeritor Production System S Q D C P Safety Quality Delivery Cost People Sub-Systems Tools 15
  • 16. Lean Efforts Have Resulted In Significant Improvement with Minimal (or no) Investment Housing Production Units • Production trend increased significantly • Achieved 15% average improvement to throughput • Painting throughput has increased to >900 pieces per day Gear Machining Units • Gear machining production trend increased • Achieved 35% average improvement to throughput 16
  • 17. Management of Cycles 1. ArvinMeritor Production System and lean manufacturing 2. Investments in core processes 3. Footprint optimization timing 4. Other new investments 17
  • 18. Investing in Core Processes Layered Capacity Model 2006 Industry 350K Units Layer 2 Layer 3 Layer 2 Layer 2 Layer 1 Layer 2 Layer 1 Layer 1 Layer 1 Class 8 Industry 250K-280K ArvinMeritor Capacity Process Process Process Process Assembly A B C D Core Process Model Layer 1 Layer 1 Class 8 Industry Non-Core: Core: Non-Core: Core: 300K+ Outsource Invest Outsource Invest Process Process Process Process Assembly A B C D 18
  • 19. Core Process Example: Gear Cutting • High value add • High leverage to quality and capability • Invest in the latest technology • Invest in capacity Average Age of • $25 million investment Gear-Cutting Machines approved Before Project After Project 19
  • 20. Management of Cycles 1. ArvinMeritor Production System and lean manufacturing 2. Investments in core processes 3. Footprint optimization timing 4. Other new investments 20
  • 21. Footprint Optimization Timing • Performance Plus restructuring intended to shift capacity toward locations with lower total delivered cost • Plan includes realignment/consolidation of processes and new capacity in low-cost locations • Open new plants to support 2009 pre-buy • Announcing new axle plant for northern Mexico – Expected to open second half of 2008 – 150K – 250K square feet 21
  • 22. Management of Cycles 1. ArvinMeritor Production System and lean manufacturing 2. Investments in core processes 3. Footprint optimization timing 4. Other new investments 22
  • 23. Expansion of Axles JV in India Automotive Axles, Ltd. • Automotive Axles, Ltd. (AAL) is the Bharat largest commercial vehicle axle Forge, ARM, 35% 35% manufacturer in India • Traded on the Indian Stock Exchange • Sells through 51% ARM-owned JV Publicly Held, • Customers include Ashok Leyland, 30% Mahindra & Mahindra and Tata • FY 2007 sales of about $150 million Sales in Rupees • Announcing a significant investment to expand AAL’s manufacturing capacity to support strong market and customer growth in India and elsewhere in Asia 1998 1999 2000 2001 2002 2003 2004 2005 2006 23
  • 24. JPMorgan Harbour Auto Conference August 6, 2007 Jay Craig Senior Vice President and Controller Chris Snodgrass Vice President Manufacturing and Supply Chain, CVS 24
  • 26. Use of Non-GAAP Financial Information In addition to the results reported in accordance with accounting principles generally accepted in the United States (“GAAP”) included throughout this presentation, the Company has provided information regarding income from continuing operations and diluted earnings per share before special items, which are non-GAAP financial measures. These non-GAAP measures are defined as reported income or loss from continuing operations and reported diluted earnings or loss per share from continuing operations plus or minus special items. Other non-GAAP financial measures include “EBITDA,” “net debt” and “free cash flow”. EBITDA is defined as earnings before interest, taxes, depreciation and amortization, and losses on sales of receivables, plus or minus special items. Net debt is defined as total debt less the fair value adjustment of notes due to interest rate swaps, less cash. Free cash flow represents net cash provided by operating activities less capital expenditures. Management believes that the non-GAAP financial measures used in this presentation are useful to both management and investors in their analysis of the Company’s financial position and results of operations. In particular, management believes that net debt is an important indicator of the Company’s overall leverage and free cash flow is useful in analyzing the Company’s ability to service and repay its debt. EBITDA is a meaningful measure of performance commonly used by management, the investment community and banking institutions to analyze operating performance and entity valuation. Further, management uses these non-GAAP measures for planning and forecasting in future periods. These non-GAAP measures should not be considered a substitute for the reported results prepared in accordance with GAAP. Neither net debt nor free cash flow should be considered substitutes for debt, cash provided by operating activities or other balance sheet or cash flow statement data prepared in accordance with GAAP or as a measure of financial position or liquidity. In addition, the calculation of free cash flow does not reflect cash used to service debt and thus, does not reflect funds available for investment or other discretionary uses. EBITDA should not be considered an alternative to net income as an indicator of operating performance or to cash flows as a measure of liquidity. These non-GAAP financial measures, as determined and presented by the Company, may not be comparable to related or similarly titled measures reported by other companies. Set forth on the following slides are reconciliations of these non-GAAP financial measures, if applicable, to the most directly comparable financial measures calculated and presented in accordance with GAAP. 26
  • 27. Non-GAAP Financial Information Income Statement Special Items Walk 3Q 2007 Product Before Disruptions Income GAAP Special Items and Restructuring Taxes Q3 2007 Q3 2007 Sales $ 1,662 $ - $ - $ 1,662 Gross Margin 136 2 - 138 Operating Income 19 26 - 45 Income (Loss) Before Income Taxes 2 26 - 28 Income (Loss) From Continuing Operations (4) 16 6 18 DILUTED EARNINGS (LOSS) PER SHARE Continuing Operations $ (0.06) $ 0.23 $ 0.08 $ 0.25 Diluted Shares Outstanding 70.8 71.8 71.8 71.8 EBITDA Light Vehicle Systems $ 12 $ 19 $ - $ 31 2 - 65 Commercial Vehicle Systems 63 Segment EBITDA 75 21 - 96 Unallocated Corporate Costs (7) 5 - (2) - - (9) (9) ET Corporate Allocations $ 59 $ 26 $ - $ 85 Total EBITDA 27
  • 28. Non-GAAP Financial Information Income Statement Special Items Walk 3Q 2006 Tilbury Before Taxes, GAAP Work Special Items other Q3 2006 Stoppage Sheffield Restructuring Q3 2006 Sales $ 1,735 $ - $ - $ - $ - $ 1,735 Gross Margin 117 45 - - - 162 Operating Income 24 45 (5) 1 - 65 Income Before Income Taxes 6 45 (5) 1 - 47 Income From Continuing Operations 4 28 (3) 1 1 31 DILUTED EARNINGS (LOSS) PER SHARE Continuing Operations $ 0.06 $ 0.40 $ (0.04) $ 0.01 $ 0.01 $ 0.44 Diluted Shares Outstanding 70.1 70.1 70.1 70.1 70.1 70.1 EBITDA Light Vehicle Systems $ 28 $ - $ (5) $ - $ - $ 23 45 - 1 - 87 Commercial Vehicle Systems 41 Segment EBITDA 69 45 (5) 1 - 110 Unallocated Corporate Costs (2) - - - - (2) ET Corporate Allocations (7) - - - - (7) $ 60 $ 45 $ (5) $ 1 $ - $ 101 Total EBITDA 28
  • 29. Non-GAAP Financial Information 3Q EBITDA Reconciliation Quarter Ended June 30, 2007 2006 $ 85 $ 101 Total EBITDA - Before Special Items (24) (1) Restructuring Costs (2) (45) Product Disruptions Gain on Divestitures - 5 Loss on Sale of Receivables (3) - Depreciation and Amortization (32) (30) Interest Expense, Net (27) (28) Benefit (Provision) for Income Taxes (1) 2 Income (Loss) From Continuing Operations $ (4) $ 4 29
  • 30. Non-GAAP Financial Information Free Cash Flow Three Months Ended June 30, 2007 2006 Cash provided by (used for operating activities) $ (127) $ 186 (29) (31) Less: Capital Expenditures (1) $ (156) $ 155 Free Cash Flow (1) Includes capital expenditures of discontinued operations. 30
  • 31. 31