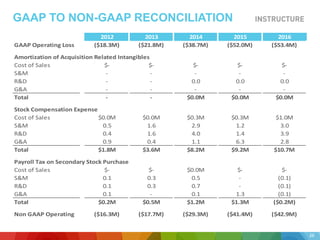
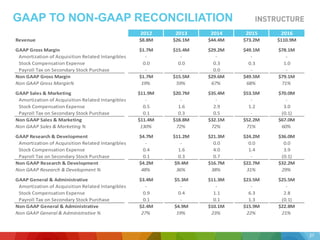
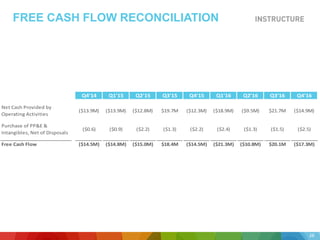
FORWARDING LOOKING STATEMENTS &
NON-GAAP MEASURES
This presentation and the accompanying oral commentary contain “forward-looking” statements, within the meaning of the safe
harbor provisions of the U.S. Private Securities Litigation Reform Act of 1995 that are based on our beliefs and assumptions
and on information currently available to us. Forward-looking statements include information concerning our possible or
assumed future results of operations and financial performance, business strategies, potential growth opportunities and the
effects of competition. Forward-looking statements include all statements that are not historical facts and can be identified by
terms such as “believe,” “will,” “may,” “estimate,” “continue,” “anticipate,” “intend,” “should,” “plan,” “might, ”approximately,”
“expect,” “predict,” “could,” “potentially” or the negative of these terms or other similar expressions.
Forward-looking statements involve known and unknown risks, uncertainties, assumptions and other factors that may cause
our actual results, performance or achievements to be materially different from any future results, performance or
achievements expressed or implied by the forward-looking statements. Important risk factors including, but not limited to, risks
associated with anticipated growth in our addressable market; our potential market opportunity; competitive factors, our ability
to build and expand our sales efforts, risks associated with international operations and general economic and industry
conditions are described more fully in the Annual Report on Form 10-K for the year ended December 31, 2016, which was filed
with the Securities and Exchange Commission (the “SEC”) on February 10, 2017 and other documents filed with the SEC and
could cause actual results to vary from expectations.
Forward-looking statements represent our management’s beliefs and assumptions only as of the date of this presentation.
Except as required by law, we assume no obligation to update these forward-looking statements publicly, or to update the
reasons why actual results could differ materially from those anticipated in the forward-looking statements, even if new
information becomes available in the future.
This presentation includes certain non-GAAP financial measures as defined by the SEC rules. These non-GAAP financial
measures are in addition to, and not as a substitute for or superior to measures of financial performance prepared in
accordance with U.S. GAAP. There are a number of limitations related to the use of these non-GAAP financial measures
versus their nearest GAAP equivalents. For example, other companies may calculate non-GAAP financial measures differently
or may use other measures to evaluate their performance, all of which could reduce the usefulness of our non-GAAP financial
measures as tools for comparison. As required by Regulation G, we have provided a reconciliation of those measures to the
most directly comparable GAAP measures, which is available in the appendix.
2
SOFTWARE
PEOPLE SMARTER
that makes
3
PRODUCT OVERVIEW VIDEO
4
$73M
$113M
$152M
$213M
$19M
$32M
$52M
$76M
$92M
$145M
$204M
$289M
2013 2014 2015 2016
$26.1M
$44.4M
$73.2M
$110.9M
2013 2014 2015 2016
+70%
+65%
+51%
100% native cloud
1As of December 31, 2016
>100% retention revenue
THE INSTRUCTURE STORY
High Growth Subscription Revenue
>2,000 customers in 40 countries1
Recurring (2016 ~88%)
Non-recurring (2016 ~12%)
5
Deferred Revenue
Backlog
Backlog & Deferred Revenue 2017 Total Addressable Market
$6.4 Billion
Headquartered in Salt Lake City
with 900+ employees worldwide
Flagship products Canvas & Bridge
EDU
CORP
92% Customer Support Satisfaction
Offices in London, Sydney, Hong Kong, Brazil
BUILDING SUPERIOR SOFTWARE THAT
MEETS EVOLVING CONSUMER DEMAND
Consumerized Collaborative
Mobile Engaging
6
SUBSTANTIAL MARKET OPPORTUNITY
With Numerous Adjacencies
2016
2018
Learning Management
Performance Management
Workforce Management
Recruiting
Compensation Management
$7.8 Billion1
$6.4 Billion2
$5.1 Billion1
$5.5 Billion2
1 Learning Management System Market. Source: MarketsandMarkets, October 2013. 2 Represents market opportunity for Performance Management, Workforce Management, Recruiting and
Compensation Management. Source: IDC, June 2015. These additional markets may present opportunities for Instructure.
7
WE ARE THE CENTER OF
THE LEARNING ECOSYSTEM
Corporations Schools
Information Systems/AnalyticsContent Applications
LEARNING MANAGEMENT SYSTEMS
Instructors Learners
8
OVER 2,000 CUSTOMERS
ACROSS CATEGORIES
HigherEdK–12InternationalCorporate
City University
of Hong Kong
Used by 7
Ivy League
Schools
Used by K-12
Schools in
49 States
Serving
40+
Countries
Rapid
Adoption
Since 2015
1As of May 4th, 2016.
9
1
10
BRIDGE
CANVAS INTERNATIONAL
CANVAS K-12
CANVAS HIGHER ED
GROWTH STRATEGY OFFERS
CONTINUED REVENUE STREAMS
New Products + New Markets = Expanded TAM
2011 2012 2013 2014 2015 2016 2017
GROWTH STRATEGY OFFERS
CONTINUED REVENUE STREAMS
11
BRIDGE
CANVAS INTERNATIONAL
CANVAS K-12
CANVAS HIGHER ED
NEW
PRODUCTS
New Products + New Markets = Expanded TAM
2011 2012 2013 2014 2015 2016 2017 & Beyond…
INSIDE INSTRUCTURE
POWERFUL MISSION OPEN CULTURE CUTTING EDGE TECH
12
CUSTOMER CONFERENCE
INNOVATIVE MANAGEMENT
Josh Coates
EMC Corp • Mozy.com • Scale Eight
CEO
Steve Kaminsky
Radisphere • TriZetto • Ernst & Young •
McDonald’s Corporation
CFO
SVP People and Places
Jeff Weber
Ancestry • The Russell Group •
Shell Oil Company
FamilySearch • Microsoft
David Burggraaf
SVP Engineering
Vmware • InfoTrax Systems • GE
Mitch Macfarlane
COO
Marc Maloy
HireRight • Certico
EVP Worldwide Sales
Misty Frost
Datamark • Critical Mass •
Sumus Interactive• Dahlin Smith White
SVP Marketing
13
Matt Kaminer
Collective • Epocrates •
MediMedia USA • WebMD
SVP General Counsel and Secretary
FINANCIAL HIGHLIGHTS
14
Attractive
Long Range Model
Strong Unit
Economics
Investing for
Continued Growth
Enhanced Visibility
Through Multi-Year Contracts
Solid Revenue
Growth
$26.1M
$44.4M
$73.2M
$110.9M
2013 2014 2015 2016
+70%
+65%
+51%
Revenue Growth
REVENUE & PROFITABILITY HISTORY
2013 – 2016
1Non-GAAP gross margin is before stock-based compensation and payroll tax expense on secondary stock purchase transactions.
2Operating loss before stock-based compensation, payroll tax expense on secondary stock purchase transactions and amortization of acquisition-related intangibles
59%
67% 68%
71%
2013 2014 2015 2016
Non-GAAP Gross Margin1
(68%)
(66%)
(57%)
(39%)
2013 2014 2015 2016
($18M)
($29M)
($41M)
($43M)
Non-GAAP Operating Loss as a
% of Revenue2
15
Recurring (2016 ~88%)
Non-recurring (2016 ~12%)
$32M
$52M
$76M
Dec-31-2014 Dec-31-2015 Dec-31-2016
ENHANCED VISIBILITY INTO
FUTURE PERIODS
2014 – 2016
Deferred Revenue
$113M
$152M
$213M
Dec-31-2014 Dec-31-2015 Dec-31-2016
Backlog1
1Backlog represents future non-cancellable amounts to be invoiced under our agreements.
16
72% 72% 71%
60%
2013 2014 2015 2016
Non-GAAP Sales and Marketing1
(% of Revenue)
INVESTING FOR GROWTH
1Non-GAAP Sales and Marketing, Research and Development and General and Administration expenses are before stock-based compensation, payroll tax expense on secondary stock
purchase transactions and amortization of acquisition-related intangibles.
36%
38%
31%
29%
2013 2014 2015 2016
Non-GAAP Research and
Development1
(% of Revenue)
19%
23%
22%
21%
2013 2014 2015 2016
Non-GAAP General and
Administration1
(% of Revenue)
17
SEASONALLY STRONG Q3
LEADS TO RAPIDLY EXPANDING FCF
Non-GAAP Gross Margin2 %
1Free cash flow is a Non-GAAP measure and is derived by netting operating cash flow with capital expenditures and proceeds from disposal of property and equipment.
18
1
($14.5M) ($14.8M) ($15.0M)
$18.4M
($14.5M)
($21.3M)
($10.8M)
$20.1M
($17.3M)
Q4-14 Q1-15 Q2-15 Q3-15 Q4-15 Q1-16 Q2-16 Q3-16 Q4-16
HIGH CUSTOMER LIFETIME VALUE
CumulativeContribution
19
Lifetime
Customer
Acquisition
Costs
Breakeven
Customer
Lifetime Value
ACQUIRE RETAIN RENEW
55%
67% 65% 66% 61%
-111%
2011 2012 2013 2014 2015 2016
Customer
Start Date
CM %
STRONG FOUNDATION FOR
BUILDING TOWARD PROFITABILITY
2016 Contribution Margin1 by customer cohort; based on Full Year 2016 revenue and expenses
20
1Defined as gross margin less sales, direct marketing and account management expense. 2Lower primarily due to early adopter pricing.
3Lower primarily due to cost of services completed in 2016 for late 2015 customers. 41st year cost (2016) includes customer acquisition and implementation
2 3 4
LONG-RANGE MODEL
2013 2014 2015 2016
Long-
Term
Target
1Non-GAAP cost of revenue is before stock-based compensation and payroll tax expense on secondary stock purchase transactions
2Non-GAAP operating expenses are before stock-based compensation, payroll tax expense on secondary stock purchase transactions and amortization of acquisition-related intangibles.
21
Revenue 100% 100% 100% 100% 100%
Cost of
Revenue1 41% 33% 32% 29% ~25%
Non-GAAP
Gross Margin
59% 67% 68% 71% ~75%
S&M
2
72% 72% 71% 60% 26-28%
R&D
2
36% 38% 31% 29% 15-17%
G&A2
19% 23% 22% 21% 9-10%
Non-GAAP
Operating
Income/Loss
(68%) (66%) (57%) (39%) 20-25%
INVESTMENT HIGHLIGHTS
Rapid and Widespread
Customer Adoption
Substantial
Market Opportunity
Native,
Cloud-Based Platform
Focused on
User-Experience
and Simplicity
Solid
Revenue
Growth
Enhanced Visibility
Through Multi-Year
Contracts
22
Net Revenue
Retention
Greater than 100%1
1 Net revenue retention rate is calculated by dividing the total revenue obtained from a particular customer in a given month by the total revenue from that customer from the same
month in the immediately preceding year.
APPENDIX
Q4'14 Q1'15 Q2'15 Q3'15 Q4'15 Q1'16 Q2'16 Q3'16 Q4'16
Revenue $13.7M $14.6M $15.9M $20.9M $21.8M $23.3M $25.9M $30.1M $31.5M
YoY% 67% 70% 66% 68% 59% 59% 63% 44% 45%
Cost of Sales $4.8 $4.9 $5.5 $6.8 $6.8 $7.3 $7.6 $8.6 $9.1
Gross Profit $8.9M $9.7M $10.3M $14.1M $15.0M $16.0M $18.3M $21.5M $22.4M
GM% 65% 66% 65% 67% 69% 68% 71% 71% 71%
S&M $13.1 $11.1 $14.1 $13.2 $15.2 $16.2 $18.0 $17.8 $18.0
% of Rev 95% 76% 88% 63% 70% 69% 70% 59% 57%
R&D $9.1 $5.3 $5.6 $6.5 $6.7 $7.8 $8.7 $9.3 $10.1
% of Rev 66% 36% 36% 31% 31% 33% 34% 31% 32%
G&A $4.4 $10.0 $3.9 $4.5 $5.0 $5.7 $6.0 $6.7 $7.1
% of Rev 32% 69% 25% 22% 23% 25% 23% 22% 23%
OPEX $26.5M $26.4M $23.6M $24.2M $26.9M $29.7M $32.8M $33.8M $35.3M
% of Rev 193% 180% 149% 116% 123% 127% 127% 112% 112%
Operating Loss ($17.6M) ($16.7M) ($13.3M) ($10.1M) ($11.9M) ($13.8M) ($14.5M) ($12.3M) ($12.8M)
% of Rev (128%) (114%) (84%) (48%) (55%) (59%) (56%) (41%) (41%)
Warrant liability expense ($0.3) ($0.5) ($0.0) ($0.0) ($0.1) $0.1 $0.0 ($0.0) $0.0
Other Income/Expense ($0.1) ($0.1) ($0.0) ($0.1) ($0.0) ($0.0) ($0.0) ($0.0) ($0.0)
Loss before income taxes ($18.0M) ($17.3M) ($13.3M) ($10.2M) ($12.0M) ($13.7M) ($14.5M) ($12.3M) ($12.9M)
Income taxes ($0.1) $0.0 ($0.0) ($0.0) ($0.1) ($0.0) ($0.1) ($0.0) ($0.1)
Net Loss ($18.0M) ($17.3M) ($13.3M) ($10.2M) ($12.1M) ($13.7M) ($14.6M) ($12.3M) ($12.9M)
% of Rev (131%) (118%) (84%) (49%) (56%) (59%) (56%) (41%) (41%)
GAAP INCOME STATEMENT
24
Q4'14 Q1'15 Q2'15 Q3'15 Q4'15 Q1'16 Q2'16 Q3'16 Q4'16
Revenue $13.7M $14.6M $15.9M $20.9M $21.8M $23.3M $25.9M $30.1M $31.5M
YoY% 67% 70% 66% 68% 59% 59% 63% 44% 45%
Cost of Sales $4.5 $4.9 $5.5 $6.7 $6.7 $7.2 $7.4 $8.4 $8.9
Gross Profit $9.2M $9.8M $10.4M $14.2M $15.1M $16.1M $18.5M $21.8M $22.7M
GM% 67% 67% 66% 68% 69% 69% 72% 72% 72%
S&M $9.9 $10.9 $13.8 $12.8 $14.7 $15.5 $17.3 $17.0 $17.2
% of Rev 72% 75% 87% 61% 67% 67% 67% 56% 54%
R&D $4.8 $5.0 $5.4 $6.2 $6.2 $7.0 $7.9 $8.3 $9.0
% of Rev 35% 34% 34% 30% 28% 30% 30% 27% 29%
G&A $3.6 $3.3 $3.8 $4.3 $4.6 $5.1 $5.4 $5.9 $6.3
% of Rev 26% 22% 24% 20% 21% 22% 21% 20% 20%
OPEX $18.2M $19.2M $22.9M $23.3M $25.5M $27.7M $30.6M $31.2M $32.5M
% of Rev 133% 131% 144% 111% 117% 119% 118% 104% 103%
Operating Loss ($9.0M) ($9.4M) ($12.5M) ($9.1M) ($10.4M) ($11.5M) ($12.1M) ($9.5M) ($9.9M)
% of Rev (66%) (64%) (79%) (43%) (48%) (49%) (47%) (31%) (31%)
Net Loss ($9.2M) ($9.6M) ($12.5M) ($9.2M) ($10.5M) ($11.6M) ($12.1M) ($9.5M) ($10.0M)
% of Rev (67%) (65%) (79%) (44%) (48%) (50%) (47%) (32%) (32%)
NON GAAP INCOME STATEMENT
Non GAAP Net Operating Loss excludes change in fair value warrant liability.
25
2012 2013 2014 2015 2016
GAAP Operating Loss ($18.3M) ($21.8M) ($38.7M) ($52.0M) ($53.4M)
Amortization of Acquisition Related Intangibles
Cost of Sales $- $- $- $- $-
S&M - - - - -
R&D - - 0.0 0.0 0.0
G&A - - - - -
Total - - $0.0M $0.0M $0.0M
Stock Compensation Expense
Cost of Sales $0.0M $0.0M $0.3M $0.3M $1.0M
S&M 0.5 1.6 2.9 1.2 3.0
R&D 0.4 1.6 4.0 1.4 3.9
G&A 0.9 0.4 1.1 6.3 2.8
Total $1.8M $3.6M $8.2M $9.2M $10.7M
Payroll Tax on Secondary Stock Purchase
Cost of Sales $- $- $0.0M $- $-
S&M 0.1 0.3 0.5 - (0.1)
R&D 0.1 0.3 0.7 - (0.1)
G&A 0.1 - 0.1 1.3 (0.1)
Total $0.2M $0.5M $1.2M $1.3M ($0.2M)
Non GAAP Operating ($16.3M) ($17.7M) ($29.3M) ($41.4M) ($42.9M)
GAAP TO NON-GAAP RECONCILIATION
26
2012 2013 2014 2015 2016
Revenue $8.8M $26.1M $44.4M $73.2M $110.9M
GAAP Gross Margin $1.7M $15.4M $29.2M $49.1M $78.1M
Amortization of Acquisition Related Intangibles - - - - -
Stock Compensation Expense 0.0 0.0 0.3 0.3 1.0
Payroll Tax on Secondary Stock Purchase - - 0.0 - -
Non GAAP Gross Margin $1.7M $15.5M $29.6M $49.5M $79.1M
Non GAAP Gross Margin% 19% 59% 67% 68% 71%
GAAP Sales & Marketing $11.9M $20.7M $35.4M $53.5M $70.0M
Amortization of Acquisition Related Intangibles - - - - -
Stock Compensation Expense 0.5 1.6 2.9 1.2 3.0
Payroll Tax on Secondary Stock Purchase 0.1 0.3 0.5 - (0.1)
Non GAAP Sales & Marketing $11.4M $18.8M $32.1M $52.2M $67.0M
Non GAAP Sales & Marketing % 130% 72% 72% 71% 60%
GAAP Research & Development $4.7M $11.2M $21.3M $24.2M $36.0M
Amortization of Acquisition Related Intangibles - - 0.0 0.0 0.0
Stock Compensation Expense 0.4 1.6 4.0 1.4 3.9
Payroll Tax on Secondary Stock Purchase 0.1 0.3 0.7 - (0.1)
Non GAAP Research & Development $4.2M $9.4M $16.7M $22.7M $32.2M
Non GAAP Research & Development % 48% 36% 38% 31% 29%
GAAP General & Administrative $3.4M $5.3M $11.3M $23.5M $25.5M
Amortization of Acquisition Related Intangibles - - - - -
Stock Compensation Expense 0.9 0.4 1.1 6.3 2.8
Payroll Tax on Secondary Stock Purchase 0.1 - 0.1 1.3 (0.1)
Non GAAP General & Administrative $2.4M $4.9M $10.1M $15.9M $22.8M
Non GAAP General & Administrative % 27% 19% 23% 22% 21%
GAAP TO NON-GAAP RECONCILIATION
27
Q4'14 Q1'15 Q2'15 Q3'15 Q4'15 Q1'16 Q2'16 Q3'16 Q4'16
Net Cash Provided by
Operating Activities
($13.9M) ($13.9M) ($12.8M) $19.7M ($12.3M) ($18.9M) ($9.5M) $21.7M ($14.9M)
Purchase of PP&E &
Intangibles, Net of Disposals
($0.6) ($0.9) ($2.2) ($1.3) ($2.2) ($2.4) ($1.3) ($1.5) ($2.5)
Free Cash Flow ($14.5M) ($14.8M) ($15.0M) $18.4M ($14.5M) ($21.3M) ($10.8M) $20.1M ($17.3M)
FREE CASH FLOW RECONCILIATION
28

Inst investor deck 2-13-17 (1)

  • 2.
    FORWARDING LOOKING STATEMENTS& NON-GAAP MEASURES This presentation and the accompanying oral commentary contain “forward-looking” statements, within the meaning of the safe harbor provisions of the U.S. Private Securities Litigation Reform Act of 1995 that are based on our beliefs and assumptions and on information currently available to us. Forward-looking statements include information concerning our possible or assumed future results of operations and financial performance, business strategies, potential growth opportunities and the effects of competition. Forward-looking statements include all statements that are not historical facts and can be identified by terms such as “believe,” “will,” “may,” “estimate,” “continue,” “anticipate,” “intend,” “should,” “plan,” “might, ”approximately,” “expect,” “predict,” “could,” “potentially” or the negative of these terms or other similar expressions. Forward-looking statements involve known and unknown risks, uncertainties, assumptions and other factors that may cause our actual results, performance or achievements to be materially different from any future results, performance or achievements expressed or implied by the forward-looking statements. Important risk factors including, but not limited to, risks associated with anticipated growth in our addressable market; our potential market opportunity; competitive factors, our ability to build and expand our sales efforts, risks associated with international operations and general economic and industry conditions are described more fully in the Annual Report on Form 10-K for the year ended December 31, 2016, which was filed with the Securities and Exchange Commission (the “SEC”) on February 10, 2017 and other documents filed with the SEC and could cause actual results to vary from expectations. Forward-looking statements represent our management’s beliefs and assumptions only as of the date of this presentation. Except as required by law, we assume no obligation to update these forward-looking statements publicly, or to update the reasons why actual results could differ materially from those anticipated in the forward-looking statements, even if new information becomes available in the future. This presentation includes certain non-GAAP financial measures as defined by the SEC rules. These non-GAAP financial measures are in addition to, and not as a substitute for or superior to measures of financial performance prepared in accordance with U.S. GAAP. There are a number of limitations related to the use of these non-GAAP financial measures versus their nearest GAAP equivalents. For example, other companies may calculate non-GAAP financial measures differently or may use other measures to evaluate their performance, all of which could reduce the usefulness of our non-GAAP financial measures as tools for comparison. As required by Regulation G, we have provided a reconciliation of those measures to the most directly comparable GAAP measures, which is available in the appendix. 2
  • 3.
  • 4.
  • 5.
    $73M $113M $152M $213M $19M $32M $52M $76M $92M $145M $204M $289M 2013 2014 20152016 $26.1M $44.4M $73.2M $110.9M 2013 2014 2015 2016 +70% +65% +51% 100% native cloud 1As of December 31, 2016 >100% retention revenue THE INSTRUCTURE STORY High Growth Subscription Revenue >2,000 customers in 40 countries1 Recurring (2016 ~88%) Non-recurring (2016 ~12%) 5 Deferred Revenue Backlog Backlog & Deferred Revenue 2017 Total Addressable Market $6.4 Billion Headquartered in Salt Lake City with 900+ employees worldwide Flagship products Canvas & Bridge EDU CORP 92% Customer Support Satisfaction Offices in London, Sydney, Hong Kong, Brazil
  • 6.
    BUILDING SUPERIOR SOFTWARETHAT MEETS EVOLVING CONSUMER DEMAND Consumerized Collaborative Mobile Engaging 6
  • 7.
    SUBSTANTIAL MARKET OPPORTUNITY WithNumerous Adjacencies 2016 2018 Learning Management Performance Management Workforce Management Recruiting Compensation Management $7.8 Billion1 $6.4 Billion2 $5.1 Billion1 $5.5 Billion2 1 Learning Management System Market. Source: MarketsandMarkets, October 2013. 2 Represents market opportunity for Performance Management, Workforce Management, Recruiting and Compensation Management. Source: IDC, June 2015. These additional markets may present opportunities for Instructure. 7
  • 8.
    WE ARE THECENTER OF THE LEARNING ECOSYSTEM Corporations Schools Information Systems/AnalyticsContent Applications LEARNING MANAGEMENT SYSTEMS Instructors Learners 8
  • 9.
    OVER 2,000 CUSTOMERS ACROSSCATEGORIES HigherEdK–12InternationalCorporate City University of Hong Kong Used by 7 Ivy League Schools Used by K-12 Schools in 49 States Serving 40+ Countries Rapid Adoption Since 2015 1As of May 4th, 2016. 9 1
  • 10.
    10 BRIDGE CANVAS INTERNATIONAL CANVAS K-12 CANVASHIGHER ED GROWTH STRATEGY OFFERS CONTINUED REVENUE STREAMS New Products + New Markets = Expanded TAM 2011 2012 2013 2014 2015 2016 2017
  • 11.
    GROWTH STRATEGY OFFERS CONTINUEDREVENUE STREAMS 11 BRIDGE CANVAS INTERNATIONAL CANVAS K-12 CANVAS HIGHER ED NEW PRODUCTS New Products + New Markets = Expanded TAM 2011 2012 2013 2014 2015 2016 2017 & Beyond…
  • 12.
    INSIDE INSTRUCTURE POWERFUL MISSIONOPEN CULTURE CUTTING EDGE TECH 12 CUSTOMER CONFERENCE
  • 13.
    INNOVATIVE MANAGEMENT Josh Coates EMCCorp • Mozy.com • Scale Eight CEO Steve Kaminsky Radisphere • TriZetto • Ernst & Young • McDonald’s Corporation CFO SVP People and Places Jeff Weber Ancestry • The Russell Group • Shell Oil Company FamilySearch • Microsoft David Burggraaf SVP Engineering Vmware • InfoTrax Systems • GE Mitch Macfarlane COO Marc Maloy HireRight • Certico EVP Worldwide Sales Misty Frost Datamark • Critical Mass • Sumus Interactive• Dahlin Smith White SVP Marketing 13 Matt Kaminer Collective • Epocrates • MediMedia USA • WebMD SVP General Counsel and Secretary
  • 14.
    FINANCIAL HIGHLIGHTS 14 Attractive Long RangeModel Strong Unit Economics Investing for Continued Growth Enhanced Visibility Through Multi-Year Contracts Solid Revenue Growth
  • 15.
    $26.1M $44.4M $73.2M $110.9M 2013 2014 20152016 +70% +65% +51% Revenue Growth REVENUE & PROFITABILITY HISTORY 2013 – 2016 1Non-GAAP gross margin is before stock-based compensation and payroll tax expense on secondary stock purchase transactions. 2Operating loss before stock-based compensation, payroll tax expense on secondary stock purchase transactions and amortization of acquisition-related intangibles 59% 67% 68% 71% 2013 2014 2015 2016 Non-GAAP Gross Margin1 (68%) (66%) (57%) (39%) 2013 2014 2015 2016 ($18M) ($29M) ($41M) ($43M) Non-GAAP Operating Loss as a % of Revenue2 15 Recurring (2016 ~88%) Non-recurring (2016 ~12%)
  • 16.
    $32M $52M $76M Dec-31-2014 Dec-31-2015 Dec-31-2016 ENHANCEDVISIBILITY INTO FUTURE PERIODS 2014 – 2016 Deferred Revenue $113M $152M $213M Dec-31-2014 Dec-31-2015 Dec-31-2016 Backlog1 1Backlog represents future non-cancellable amounts to be invoiced under our agreements. 16
  • 17.
    72% 72% 71% 60% 20132014 2015 2016 Non-GAAP Sales and Marketing1 (% of Revenue) INVESTING FOR GROWTH 1Non-GAAP Sales and Marketing, Research and Development and General and Administration expenses are before stock-based compensation, payroll tax expense on secondary stock purchase transactions and amortization of acquisition-related intangibles. 36% 38% 31% 29% 2013 2014 2015 2016 Non-GAAP Research and Development1 (% of Revenue) 19% 23% 22% 21% 2013 2014 2015 2016 Non-GAAP General and Administration1 (% of Revenue) 17
  • 18.
    SEASONALLY STRONG Q3 LEADSTO RAPIDLY EXPANDING FCF Non-GAAP Gross Margin2 % 1Free cash flow is a Non-GAAP measure and is derived by netting operating cash flow with capital expenditures and proceeds from disposal of property and equipment. 18 1 ($14.5M) ($14.8M) ($15.0M) $18.4M ($14.5M) ($21.3M) ($10.8M) $20.1M ($17.3M) Q4-14 Q1-15 Q2-15 Q3-15 Q4-15 Q1-16 Q2-16 Q3-16 Q4-16
  • 19.
    HIGH CUSTOMER LIFETIMEVALUE CumulativeContribution 19 Lifetime Customer Acquisition Costs Breakeven Customer Lifetime Value ACQUIRE RETAIN RENEW
  • 20.
    55% 67% 65% 66%61% -111% 2011 2012 2013 2014 2015 2016 Customer Start Date CM % STRONG FOUNDATION FOR BUILDING TOWARD PROFITABILITY 2016 Contribution Margin1 by customer cohort; based on Full Year 2016 revenue and expenses 20 1Defined as gross margin less sales, direct marketing and account management expense. 2Lower primarily due to early adopter pricing. 3Lower primarily due to cost of services completed in 2016 for late 2015 customers. 41st year cost (2016) includes customer acquisition and implementation 2 3 4
  • 21.
    LONG-RANGE MODEL 2013 20142015 2016 Long- Term Target 1Non-GAAP cost of revenue is before stock-based compensation and payroll tax expense on secondary stock purchase transactions 2Non-GAAP operating expenses are before stock-based compensation, payroll tax expense on secondary stock purchase transactions and amortization of acquisition-related intangibles. 21 Revenue 100% 100% 100% 100% 100% Cost of Revenue1 41% 33% 32% 29% ~25% Non-GAAP Gross Margin 59% 67% 68% 71% ~75% S&M 2 72% 72% 71% 60% 26-28% R&D 2 36% 38% 31% 29% 15-17% G&A2 19% 23% 22% 21% 9-10% Non-GAAP Operating Income/Loss (68%) (66%) (57%) (39%) 20-25%
  • 22.
    INVESTMENT HIGHLIGHTS Rapid andWidespread Customer Adoption Substantial Market Opportunity Native, Cloud-Based Platform Focused on User-Experience and Simplicity Solid Revenue Growth Enhanced Visibility Through Multi-Year Contracts 22 Net Revenue Retention Greater than 100%1 1 Net revenue retention rate is calculated by dividing the total revenue obtained from a particular customer in a given month by the total revenue from that customer from the same month in the immediately preceding year.
  • 23.
  • 24.
    Q4'14 Q1'15 Q2'15Q3'15 Q4'15 Q1'16 Q2'16 Q3'16 Q4'16 Revenue $13.7M $14.6M $15.9M $20.9M $21.8M $23.3M $25.9M $30.1M $31.5M YoY% 67% 70% 66% 68% 59% 59% 63% 44% 45% Cost of Sales $4.8 $4.9 $5.5 $6.8 $6.8 $7.3 $7.6 $8.6 $9.1 Gross Profit $8.9M $9.7M $10.3M $14.1M $15.0M $16.0M $18.3M $21.5M $22.4M GM% 65% 66% 65% 67% 69% 68% 71% 71% 71% S&M $13.1 $11.1 $14.1 $13.2 $15.2 $16.2 $18.0 $17.8 $18.0 % of Rev 95% 76% 88% 63% 70% 69% 70% 59% 57% R&D $9.1 $5.3 $5.6 $6.5 $6.7 $7.8 $8.7 $9.3 $10.1 % of Rev 66% 36% 36% 31% 31% 33% 34% 31% 32% G&A $4.4 $10.0 $3.9 $4.5 $5.0 $5.7 $6.0 $6.7 $7.1 % of Rev 32% 69% 25% 22% 23% 25% 23% 22% 23% OPEX $26.5M $26.4M $23.6M $24.2M $26.9M $29.7M $32.8M $33.8M $35.3M % of Rev 193% 180% 149% 116% 123% 127% 127% 112% 112% Operating Loss ($17.6M) ($16.7M) ($13.3M) ($10.1M) ($11.9M) ($13.8M) ($14.5M) ($12.3M) ($12.8M) % of Rev (128%) (114%) (84%) (48%) (55%) (59%) (56%) (41%) (41%) Warrant liability expense ($0.3) ($0.5) ($0.0) ($0.0) ($0.1) $0.1 $0.0 ($0.0) $0.0 Other Income/Expense ($0.1) ($0.1) ($0.0) ($0.1) ($0.0) ($0.0) ($0.0) ($0.0) ($0.0) Loss before income taxes ($18.0M) ($17.3M) ($13.3M) ($10.2M) ($12.0M) ($13.7M) ($14.5M) ($12.3M) ($12.9M) Income taxes ($0.1) $0.0 ($0.0) ($0.0) ($0.1) ($0.0) ($0.1) ($0.0) ($0.1) Net Loss ($18.0M) ($17.3M) ($13.3M) ($10.2M) ($12.1M) ($13.7M) ($14.6M) ($12.3M) ($12.9M) % of Rev (131%) (118%) (84%) (49%) (56%) (59%) (56%) (41%) (41%) GAAP INCOME STATEMENT 24
  • 25.
    Q4'14 Q1'15 Q2'15Q3'15 Q4'15 Q1'16 Q2'16 Q3'16 Q4'16 Revenue $13.7M $14.6M $15.9M $20.9M $21.8M $23.3M $25.9M $30.1M $31.5M YoY% 67% 70% 66% 68% 59% 59% 63% 44% 45% Cost of Sales $4.5 $4.9 $5.5 $6.7 $6.7 $7.2 $7.4 $8.4 $8.9 Gross Profit $9.2M $9.8M $10.4M $14.2M $15.1M $16.1M $18.5M $21.8M $22.7M GM% 67% 67% 66% 68% 69% 69% 72% 72% 72% S&M $9.9 $10.9 $13.8 $12.8 $14.7 $15.5 $17.3 $17.0 $17.2 % of Rev 72% 75% 87% 61% 67% 67% 67% 56% 54% R&D $4.8 $5.0 $5.4 $6.2 $6.2 $7.0 $7.9 $8.3 $9.0 % of Rev 35% 34% 34% 30% 28% 30% 30% 27% 29% G&A $3.6 $3.3 $3.8 $4.3 $4.6 $5.1 $5.4 $5.9 $6.3 % of Rev 26% 22% 24% 20% 21% 22% 21% 20% 20% OPEX $18.2M $19.2M $22.9M $23.3M $25.5M $27.7M $30.6M $31.2M $32.5M % of Rev 133% 131% 144% 111% 117% 119% 118% 104% 103% Operating Loss ($9.0M) ($9.4M) ($12.5M) ($9.1M) ($10.4M) ($11.5M) ($12.1M) ($9.5M) ($9.9M) % of Rev (66%) (64%) (79%) (43%) (48%) (49%) (47%) (31%) (31%) Net Loss ($9.2M) ($9.6M) ($12.5M) ($9.2M) ($10.5M) ($11.6M) ($12.1M) ($9.5M) ($10.0M) % of Rev (67%) (65%) (79%) (44%) (48%) (50%) (47%) (32%) (32%) NON GAAP INCOME STATEMENT Non GAAP Net Operating Loss excludes change in fair value warrant liability. 25
  • 26.
    2012 2013 20142015 2016 GAAP Operating Loss ($18.3M) ($21.8M) ($38.7M) ($52.0M) ($53.4M) Amortization of Acquisition Related Intangibles Cost of Sales $- $- $- $- $- S&M - - - - - R&D - - 0.0 0.0 0.0 G&A - - - - - Total - - $0.0M $0.0M $0.0M Stock Compensation Expense Cost of Sales $0.0M $0.0M $0.3M $0.3M $1.0M S&M 0.5 1.6 2.9 1.2 3.0 R&D 0.4 1.6 4.0 1.4 3.9 G&A 0.9 0.4 1.1 6.3 2.8 Total $1.8M $3.6M $8.2M $9.2M $10.7M Payroll Tax on Secondary Stock Purchase Cost of Sales $- $- $0.0M $- $- S&M 0.1 0.3 0.5 - (0.1) R&D 0.1 0.3 0.7 - (0.1) G&A 0.1 - 0.1 1.3 (0.1) Total $0.2M $0.5M $1.2M $1.3M ($0.2M) Non GAAP Operating ($16.3M) ($17.7M) ($29.3M) ($41.4M) ($42.9M) GAAP TO NON-GAAP RECONCILIATION 26
  • 27.
    2012 2013 20142015 2016 Revenue $8.8M $26.1M $44.4M $73.2M $110.9M GAAP Gross Margin $1.7M $15.4M $29.2M $49.1M $78.1M Amortization of Acquisition Related Intangibles - - - - - Stock Compensation Expense 0.0 0.0 0.3 0.3 1.0 Payroll Tax on Secondary Stock Purchase - - 0.0 - - Non GAAP Gross Margin $1.7M $15.5M $29.6M $49.5M $79.1M Non GAAP Gross Margin% 19% 59% 67% 68% 71% GAAP Sales & Marketing $11.9M $20.7M $35.4M $53.5M $70.0M Amortization of Acquisition Related Intangibles - - - - - Stock Compensation Expense 0.5 1.6 2.9 1.2 3.0 Payroll Tax on Secondary Stock Purchase 0.1 0.3 0.5 - (0.1) Non GAAP Sales & Marketing $11.4M $18.8M $32.1M $52.2M $67.0M Non GAAP Sales & Marketing % 130% 72% 72% 71% 60% GAAP Research & Development $4.7M $11.2M $21.3M $24.2M $36.0M Amortization of Acquisition Related Intangibles - - 0.0 0.0 0.0 Stock Compensation Expense 0.4 1.6 4.0 1.4 3.9 Payroll Tax on Secondary Stock Purchase 0.1 0.3 0.7 - (0.1) Non GAAP Research & Development $4.2M $9.4M $16.7M $22.7M $32.2M Non GAAP Research & Development % 48% 36% 38% 31% 29% GAAP General & Administrative $3.4M $5.3M $11.3M $23.5M $25.5M Amortization of Acquisition Related Intangibles - - - - - Stock Compensation Expense 0.9 0.4 1.1 6.3 2.8 Payroll Tax on Secondary Stock Purchase 0.1 - 0.1 1.3 (0.1) Non GAAP General & Administrative $2.4M $4.9M $10.1M $15.9M $22.8M Non GAAP General & Administrative % 27% 19% 23% 22% 21% GAAP TO NON-GAAP RECONCILIATION 27
  • 28.
    Q4'14 Q1'15 Q2'15Q3'15 Q4'15 Q1'16 Q2'16 Q3'16 Q4'16 Net Cash Provided by Operating Activities ($13.9M) ($13.9M) ($12.8M) $19.7M ($12.3M) ($18.9M) ($9.5M) $21.7M ($14.9M) Purchase of PP&E & Intangibles, Net of Disposals ($0.6) ($0.9) ($2.2) ($1.3) ($2.2) ($2.4) ($1.3) ($1.5) ($2.5) Free Cash Flow ($14.5M) ($14.8M) ($15.0M) $18.4M ($14.5M) ($21.3M) ($10.8M) $20.1M ($17.3M) FREE CASH FLOW RECONCILIATION 28