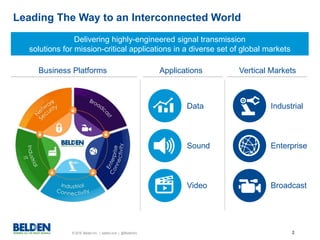
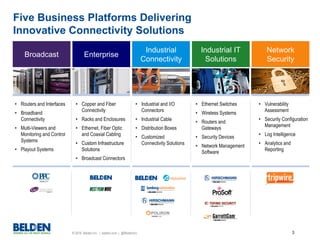
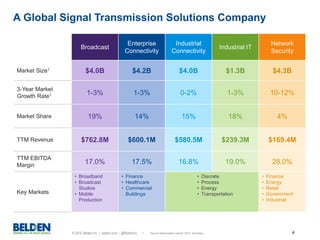
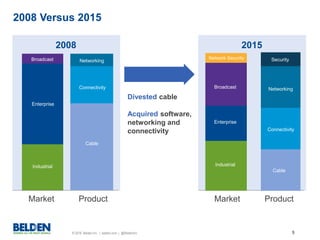
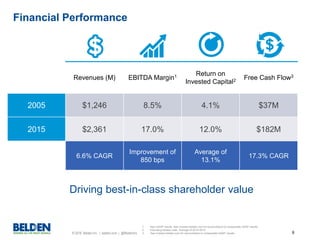
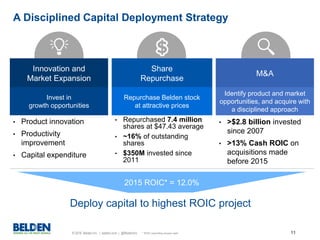
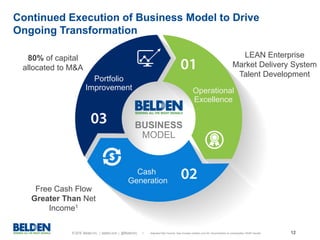
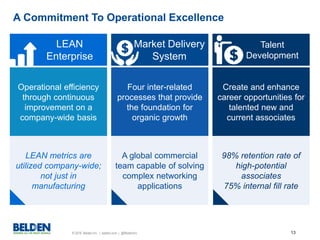
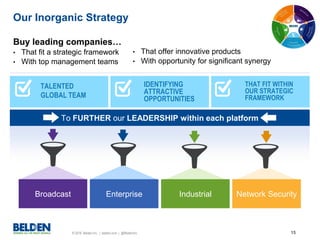
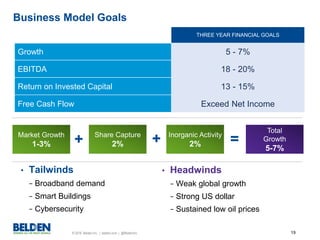
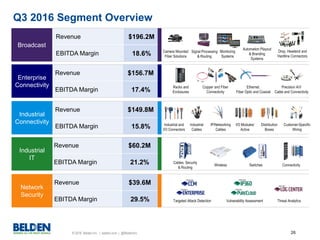
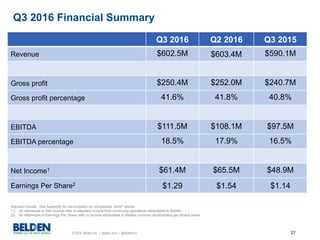
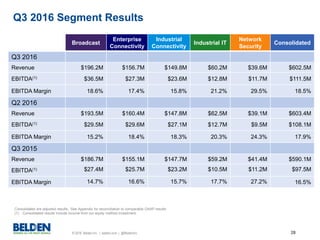
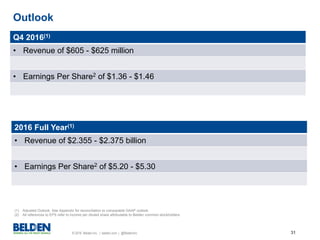
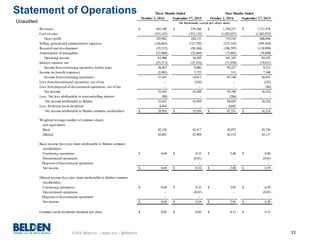
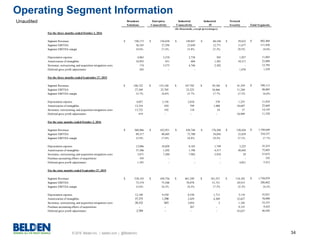
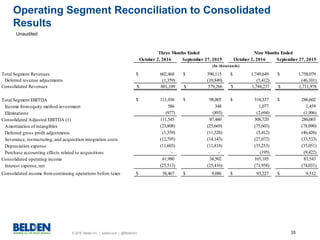
© 2016 Belden Inc. | belden.com | @BeldenInc
November 2016
Belden
Leading the Way to an
Interconnected World
© 2016 Belden Inc. | belden.com | @BeldenInc 2
Leading The Way to an Interconnected World
Delivering highly-engineered signal transmission
solutions for mission-critical applications in a diverse set of global markets
Business Platforms Applications Vertical Markets
Data
Sound
Video
Industrial
Enterprise
Broadcast
© 2016 Belden Inc. | belden.com | @BeldenInc 3
Five Business Platforms Delivering
Innovative Connectivity Solutions
Broadcast Enterprise
Industrial
Connectivity
Industrial IT
Solutions
Network
Security
• Industrial and I/O
Connectors
• Industrial Cable
• Distribution Boxes
• Customized
Connectivity Solutions
• Ethernet Switches
• Wireless Systems
• Routers and
Gateways
• Security Devices
• Network Management
Software
• Copper and Fiber
Connectivity
• Racks and Enclosures
• Ethernet, Fiber Optic
and Coaxial Cabling
• Custom Infrastructure
Solutions
• Broadcast Connectors
• Routers and Interfaces
• Broadband
Connectivity
• Multi-Viewers and
Monitoring and Control
Systems
• Playout Systems
• Vulnerability
Assessment
• Security Configuration
Management
• Log Intelligence
• Analytics and
Reporting
© 2016 Belden Inc. | belden.com | @BeldenInc 4
A Global Signal Transmission Solutions Company
Broadcast
Enterprise
Connectivity
Industrial
Connectivity
Industrial IT
Network
Security
Market Size1
$4.0B $4.2B $4.0B $1.3B $4.3B
3-Year Market
Growth Rate1 1-3% 1-3% 0-2% 1-3% 10-12%
Market Share 19% 14% 15% 18% 4%
TTM Revenue $762.8M $600.1M $580.5M $239.3M $169.4M
TTM EBITDA
Margin
17.0% 17.5% 16.8% 19.0% 28.0%
Key Markets
• Broadband
• Broadcast
Studios
• Mobile
Production
• Finance
• Healthcare
• Commercial
Buildings
• Discrete
• Process
• Energy
• Transportation
• Finance
• Energy
• Retail
• Government
• Industrial
1. Served addressable market, 2015 estimates
© 2016 Belden Inc. | belden.com | @BeldenInc 5
2008 Versus 2015
Market
Broadcast
Enterprise
Industrial
Product
Networking
Connectivity
Cable
2008
Market Product
2015
Divested cable
Acquired software,
networking and
connectivity
Network Security Security
Broadcast
Enterprise
Industrial
Networking
Connectivity
Cable
© 2016 Belden Inc. | belden.com | @BeldenInc 6
Financial Performance
Revenues (M) EBITDA Margin1 Return on
Invested Capital2 Free Cash Flow3
2005 $1,246 8.5% 4.1% $37M
2015 $2,361 17.0% 12.0% $182M
Variance 6.6% CAGR
Improvement of
850 bps
Average of
13.1%
17.3% CAGR
Driving best-in-class shareholder value
1. Non-GAAP results. See investor.belden.com for reconciliation to comparable GAAP results .
2. Excluding excess cash, Average of 2012-2015.
3. See investor.belden.com for reconciliation to comparable GAAP results
© 2016 Belden Inc. | belden.com | @BeldenInc 7
Connectivity Peers
Cable Peers
10.0%
20.0%
30.0%
40.0%
50.0%
2005 2006 2007 2008 2009 2010 2011 2012 2013 2014 2015
A Common Misperception About Belden
“Belden is a Wire and Cable company.”
Improvement of
1,930 bps
Belden’s Gross Profit Margin Exceeds Connectivity Peers
1. Adjusted results. See investor.belden.com for reconciliation to comparable GAAP results
© 2016 Belden Inc. | belden.com | @BeldenInc 8
10 Year EPS Growth
0%
5%
10%
15%
20%
25%
Peer A S&P 500 Peer B Peer C Peer D Belden
Since 2005, Belden has generated
upper quartile EPS growth of 22%*
*2005 - 2015
© 2016 Belden Inc. | belden.com | @BeldenInc 9
A Quality Balance Sheet with Long Term Maturities
Fixed long term debt with no significant maturities until 2022
Euro-denominated debt based on conversion rate at 10/2/16
$5
$700
$568
$200
$222
$-
$200
$400
$600
$800
2016 2017 2018 2019 2020 2021 2022 2023 2024 2025 2026
© 2016 Belden Inc. | belden.com | @BeldenInc 10
4.2x
4.9x 4.9x
4.7x 4.6x
4.2x
4.5x
0.0x
1.0x
2.0x
3.0x
4.0x
5.0x
6.0x
2010 2011 2012 2013 2014 2015 2016
Net Interest Coverage Ratio Has Been Consistent
Incurrence
Covenant
Belden generates more than 2x the required EBITDA
Net Interest Coverage Ratio
© 2016 Belden Inc. | belden.com | @BeldenInc 11
A Disciplined Capital Deployment Strategy
Innovation and
Market Expansion
Share
Repurchase
M&A
Invest in
growth opportunities
Repurchase Belden stock
at attractive prices
Identify product and market
opportunities, and acquire with
a disciplined approach
• Product innovation
• Productivity
improvement
• Capital expenditure
• Repurchased 7.4 million
shares at $47.43 average
• ~16% of outstanding
shares
• $350M invested since
2011
• >$2.8 billion invested
since 2007
• >13% Cash ROIC on
acquisitions made
before 2015
2015 ROIC* = 12.0%
Deploy capital to highest ROIC project
* ROIC excluding excess cash
© 2016 Belden Inc. | belden.com | @BeldenInc 12
Operational
Excellence
BUSINESS
MODEL
Free Cash Flow
Greater Than Net
Income1
LEAN Enterprise
Market Delivery System
Talent Development
80% of capital
allocated to M&A
Continued Execution of Business Model to Drive
Ongoing Transformation
Cash
Generation
Portfolio
Improvement
1. Adjusted Net Income. See investor.belden.com for reconciliation to comparable GAAP results
© 2016 Belden Inc. | belden.com | @BeldenInc 13
A Commitment To Operational Excellence
LEAN
Enterprise
Market Delivery
System
Talent
Development
Operational efficiency
through continuous
improvement on a
company-wide basis
Four inter-related
processes that provide
the foundation for
organic growth
Create and enhance
career opportunities for
talented new and
current associates
LEAN metrics are
utilized company-wide;
not just in
manufacturing
A global commercial
team capable of solving
complex networking
applications
98% retention rate of
high-potential
associates
75% internal fill rate
© 2016 Belden Inc. | belden.com | @BeldenInc 14
High Quality Earnings: Free Cash Flow Generation
Delivering 21.3% CAGR in free cash flow per share
0
1
2
3
4
5
6
2005 2006 2007 2008 2009 2010 2011 2012 2013 2014 2015
FCF per Share1
1. Non-GAAP results. See investor.belden.com for reconciliation to comparable GAAP results
2. Adjusted amount. Excludes the $25.4M of Broadcast restructuring program that began in Q3 2015.
$2.41
$3.07
$3.38
$2.47
$0.71
$1.80
$4.882
$3.03 $3.16
$4.28
$4.46
21.3% CAGR
© 2016 Belden Inc. | belden.com | @BeldenInc 15
Buy leading companies…
• That fit a strategic framework
• With top management teams
Our Inorganic Strategy
• That offer innovative products
• With opportunity for significant synergy
TALENTED
GLOBAL TEAM
IDENTIFYING
ATTRACTIVE
OPPORTUNITIES
THAT FIT WITHIN
OUR STRATEGIC
FRAMEWORK
To FURTHER our LEADERSHIP within each platform
Broadcast Enterprise Industrial Network Security
© 2016 Belden Inc. | belden.com | @BeldenInc 16
10%
12%
14%
16%
18%
20%
2010 2011 2012 2013 2014 2015
Consistent Margin Progression
We have shown the ability to consistently
improve margins in a low-growth environment
EBITDA
Margin
Goal:
18 - 20%
11.9% 11.7%
13.0%
15.7% 15.5%
EBITDA Margin (%)1
17.0%Peer Average
1. Non-GAAP results. See investor.belden.com for reconciliation to comparable GAAP results
© 2016 Belden Inc. | belden.com | @BeldenInc 17
Transformation To Drive Continued Margin Expansion
14%
16%
18%
20%
2015 Leverage Mix Productivity Inorganic 2018
140 bps
20 bps
120 bps
20 bps 20.0%
17.0%
© 2016 Belden Inc. | belden.com | @BeldenInc 18
Opportunity Exists to Drive Increased Shareholder Value
4x
8x
12x
16x
EV/EBITDAMultiple
10% 15% 20% 25% 30%5%
EBITDA-Capex Margin
A
B
C
Increased free cash flow margin drives multiple expansion
Legacy Peers
E
C
D
A
B
Best In Class
Peers
F
2008
Today
© 2016 Belden Inc. | belden.com | @BeldenInc 19
Business Model Goals
THREE YEAR FINANCIAL GOALS
Growth 5 - 7%
EBITDA 18 - 20%
Return on Invested Capital 13 - 15%
Free Cash Flow Exceed Net Income
• Headwinds
− Weak global growth
− Strong US dollar
− Sustained low oil prices
• Tailwinds
− Broadband demand
− Smart Buildings
− Cybersecurity
Market Growth
1-3%
Share Capture
2%
Inorganic Activity
2%
Total
Growth
5-7%
=+ +
© 2016 Belden Inc. | belden.com | @BeldenInc 20
Accelerating Shareholder Value with
Strong Financial Performance
Balanced
Profitable
Well
Capitalized
Value
Creating
Consistent growth and balance across regions
and platforms drives predictable results
Business transformation delivering an
improved business model
Excellent cash flow generation, low cost of
capital creates significant strategic advantage
Disciplined approach to deploying capital
creates value
© 2016 Belden Inc. | belden.com | @BeldenInc 21
Q4 and Full Year 2016 Guidance
*
Fiscal Year 2016
Revenues
of between
$605 and $625
million
*Non-GAAP results. See following slide for reconciliation to comparable GAAP results
Q4 2016
EPS
of between
$1.36 and
$1.46 per
diluted share
Revenues
of between
$2.355 and
$2.375 billion
EPS
of between
$5.20 and
$5.30 per
diluted share
© 2016 Belden Inc. | belden.com | @BeldenInc 22
GAAP to Non-GAAP Reconciliation
Year Ended Three Months Ended
December 31, 2016 October 2, 2016
Adjusted revenues $2.355 - $2.385 billion $595 - $615 million
Deferred revenue adjustments ($7 million) ($2 million)
GAAP revenues $2.348 - $2.378 billion $593 - $613 million
Adjusted income per diluted share attributable to Belden stockholders $5.15 - $5.35 $1.20 - $1.30
Amortization of intangible assets ($1.61) ($0.41)
Severance, restructuring, and acquisition integration costs ($0.55) ($0.26)
Deferred gross profit adjustments ($0.11) ($0.02)
GAAP income per diluted share attributable to Belden stockholders $2.88 - $3.08 $0.51 - $0.61
Our guidance for revenues and income per diluted share attributable to Belden stockholders is based upon information currently
available regarding events and conditions that will impact our future operating results. In particular, our results are subject to the
factors listed under "Forward-Looking statements" in this release. In addition, our actual results are likely to be impacted by other
additional events for which information is not available, such as asset impairments, purchase accounting effects related to acquisitions,
severance, restructuring, and acquisition integration costs, gains (losses) recognized on the disposal of tangible assets, gains (losses) on
debt extinguishment, discontinued operations, and other gains (losses) related to events or conditions that are not yet known.
© 2016 Belden Inc. | belden.com | @BeldenInc 23
Q3 2016 Earnings Release
Conference Call Presentation
© 2016 Belden Inc. | belden.com | @BeldenInc 24
Our commentary and responses to your questions may contain forward-looking
statements, including our outlook for the 2016 fourth quarter and full year. Forward-
looking statements also include projections of sales, earnings, general economic
conditions, market conditions, working capital, market shares, free cash flow, pricing
levels, and effective tax rates. Belden undertakes no obligation to update any such
statements to reflect later developments, except as required by law. Information on
factors that could cause actual results to vary materially from those discussed today is
available in the press release announcing 2016 third quarter results, our most recent
Annual Report on Form 10-K as filed with the SEC on February 25, 2016 (including
those discussed under “Risk Factors” in Part I, Item 1A and in “Management’s
Discussion and Analysis of Financial Condition and Results of Operations” in Part II,
Item 7), and our subsequent filings with the Securities and Exchange Commission.
Safe Harbor Statement
Non-GAAP Measures
On this call we will discuss some non-GAAP measures (denoted by footnote) in
discussing Belden’s performance, and the reconciliation of those measures to the most
comparable GAAP measures is contained within this presentation or available at our
investor relations website, investor.belden.com.
© 2016 Belden Inc. | belden.com | @BeldenInc 25
• Achieved revenues of $602.5 million, an increase of 2.6%
organically from the prior-year period;
• Generated EBITDA margins of 18.5%, an increase of 200 basis
points from the year-ago period and within our long-term target
range of 18-20%;
• Achieved EPS of $1.29, up 13% over last year’s $1.14;
• Generated an additional $58.0 million in free cash flow year-to-
date compared to the year-ago period;
• Reduced net-debt to EBITDA leverage to 2.2x from 4.0x in the
prior year.
Q3 2016 Highlights
Adjusted results. See Appendix for reconciliation to comparable GAAP results.
All references to EPS refer to income attributable to Belden common stockholders per diluted share.
© 2016 Belden Inc. | belden.com | @BeldenInc 26
Precision A/V
Cable and Connectivity
Q3 2016 Segment Overview
Revenue $39.6M
EBITDA Margin 29.5%
Revenue $60.2M
EBITDA Margin 21.2%
Revenue $156.7M
EBITDA Margin 17.4%
Revenue $149.8M
EBITDA Margin 15.8%
Revenue $196.2M
EBITDA Margin 18.6%
Broadcast
Enterprise
Connectivity
Industrial
Connectivity
Industrial
IT
Network
Security
Camera Mounted
Fiber Solutions
Signal Processing
& Routing
Monitoring
Systems
Automation Playout
& Branding
Systems
Industrial and
I/O Connectors
Industrial
Cables
IP/Networking
Cables
I/O Modules/
Active
Distribution
Boxes
Customer-Specific
Wiring
Copper and Fiber
Connectivity
Racks and
Enclosures
Ethernet,
Fiber Optic and Coaxial
Cables, Security
& Routing
Wireless Switches Connectivity
Vulnerability AssessmentTargeted Attack Detection Threat Analytics
Drop, Headend and
Hardline Connectors
© 2016 Belden Inc. | belden.com | @BeldenInc 27
Q3 2016 Financial Summary
Q3 2016 Q2 2016 Q3 2015
Revenue $602.5M $603.4M $590.1M
Gross profit $250.4M $252.0M $240.7M
Gross profit percentage 41.6% 41.8% 40.8%
EBITDA $111.5M $108.1M $97.5M
EBITDA percentage 18.5% 17.9% 16.5%
Net Income1 $61.4M $65.5M $48.9M
Earnings Per Share2
$1.29 $1.54 $1.14
Adjusted results. See Appendix for reconciliation to comparable GAAP results.
(1) All references to Net Income refer to adjusted income from continuing operations attributable to Belden
(2) All references to Earnings Per Share refer to income attributable to Belden common stockholders per diluted share.
© 2016 Belden Inc. | belden.com | @BeldenInc 28
Q3 2016 Segment Results
Consolidated are adjusted results. See Appendix for reconciliation to comparable GAAP results.
(1) Consolidated results include income from our equity method investment.
Broadcast
Enterprise
Connectivity
Industrial
Connectivity
Industrial IT
Network
Security
Consolidated
Q3 2016
Revenue $196.2M $156.7M $149.8M $60.2M $39.6M $602.5M
EBITDA(1) $36.5M $27.3M $23.6M $12.8M $11.7M $111.5M
EBITDA Margin 18.6% 17.4% 15.8% 21.2% 29.5% 18.5%
Q2 2016
Revenue $193.5M $160.4M $147.8M $62.5M $39.1M $603.4M
EBITDA(1) $29.5M $29.6M $27.1M $12.7M $9.5M $108.1M
EBITDA Margin 15.2% 18.4% 18.3% 20.3% 24.3% 17.9%
Q3 2015
Revenue $186.7M $155.1M $147.7M $59.2M $41.4M $590.1M
EBITDA(1) $27.4M $25.7M $23.2M $10.5M $11.2M $97.5M
EBITDA Margin 14.7% 16.6% 15.7% 17.7% 27.2% 16.5%
© 2016 Belden Inc. | belden.com | @BeldenInc 29
Q3 2016 Balance Sheet Highlights
Q3 2016 Q2 2016 Q3 2015
Cash and cash equivalents $748M $176M $242M
Inventory turns 7.3x 7.1x 6.7x
Days sales outstanding 61 days 60 days 63 days
PP&E turns 7.4x 7.6x 7.4x
Total debt principal amount $1.71B $1.71B $1.91B
Net Leverage1 2.2x 3.6x 4.0x
(1) Net leverage calculated as (A) total debt less cash and cash equivalents divided by (B) trailing twelve months Adjusted EBITDA plus trailing twelve months stock based compensation
expense plus trailing twelve months long-term incentive plan expense for certain acquired companies.
© 2016 Belden Inc. | belden.com | @BeldenInc 30
Q3 2016 Cash Flow Highlights
(1) Capital expenditures, net of proceeds from the disposal of tangible assets. See Appendix for reconciliation.
(2) Free cash flow is not a term defined by generally accepted accounting principles (GAAP) and our definition may or may not be used consistently with other companies that define this term.
See Appendix for reconciliation to comparable GAAP results.
(3) Net of cash acquired.
Q3 2016 Q3 2015 YTD 2016 YTD 2015
Cash flows from operating activities $ 86.4M $ 86.9M $146.8M $ 92.0M
Less: Net capital expenditures(1) $ 10.7M $ 11.8M $ 35.8M $ 39.0M
Free cash flow (2) $ 75.7M $ 75.1M $ 111.0M $ 53.0M
Cash used to acquire businesses(3) $ 0.0M $ 0.0M $ 17.8M $ 695.3M
Cash dividends paid on common stock $ 2.1M $ 2.2M $ 6.3M $ 6.3M
© 2016 Belden Inc. | belden.com | @BeldenInc 31
Q4 2016(1)
• Revenue of $605 - $625 million
• Earnings Per Share2 of $1.36 - $1.46
Outlook
2016 Full Year(1)
• Revenue of $2.355 - $2.375 billion
• Earnings Per Share2 of $5.20 - $5.30
(1) Adjusted Outlook. See Appendix for reconciliation to comparable GAAP outlook.
(2) All references to EPS refer to income per diluted share attributable to Belden common stockholders.
© 2016 Belden Inc. | belden.com | @BeldenInc 32
Appendix
© 2016 Belden Inc. | belden.com | @BeldenInc 33
October 2, 2016 September 27, 2015 October 2, 2016 September 27, 2015
Revenues $ 601,109 $ 579,266 $ 1,744,237 $ 1,711,978
Cost of sales (355,147) (353,135) (1,025,027) (1,043,922)
Gross profit 245,962 226,131 719,210 668,056
Selling, general and administrative expenses (126,662) (127,792) (372,125) (395,424)
Research and development (33,512) (38,168) (106,297) (110,999)
Amortization of intangibles (23,808) (25,669) (75,603) (78,090)
Operating income 61,980 34,502 165,185 83,543
Interest expense, net (23,513) (25,416) (71,958) (74,031)
Income fromcontinuing operations before taxes 38,467 9,086 93,227 9,512
Income taxbenefit (expense) (2,902) 5,725 513 7,340
Income fromcontinuing operations 35,565 14,811 93,740 16,852
Loss fromdiscontinued operations, net of tax - (242) - (242)
Loss fromdisposal of discontinued operations, net of tax - - - (86)
Net income 35,565 14,569 93,740 16,524
Less: Net loss attributable to noncontrolling interest (88) - (286) -
Net income attributable to Belden 35,653 14,569 94,026 16,524
Less: Preferred stock dividends 6,695 - 6,695 -
Net income attributable to Belden common stockholders $ 28,958 $ 14,569 $ 87,331 $ 16,524
Weighted average number of common shares
and equivalents:
Basic 42,126 42,417 42,073 42,536
Diluted 42,601 42,908 42,532 43,117
Basic income (loss) per share attributable to Belden common
stockholders:
Continuing operations $ 0.69 $ 0.35 $ 2.08 $ 0.40
Discontinued operations - (0.01) - (0.01)
Disposal of discontinued operations - - - -
Net income $ 0.69 $ 0.34 $ 2.08 $ 0.39
Diluted income (loss) per share attributable to Belden common
stockholders:
Continuing operations $ 0.68 $ 0.35 $ 2.05 $ 0.39
Discontinued operations - (0.01) - (0.01)
Disposal of discontinued operations - - - -
Net income $ 0.68 $ 0.34 $ 2.05 $ 0.38
Common stock dividends declared per share $ 0.05 $ 0.05 $ 0.15 $ 0.15
Three Months Ended Nine Months Ended
(In thousands, except per share data)
Statement of Operations
Unaudited
© 2016 Belden Inc. | belden.com | @BeldenInc 34
Broadcast
Solutions
Enterprise
Connectivity
Industrial
Connectivity
Industrial
IT
Network
Security Total Segments
For the three months ended October 2, 2016
Segment Revenues $ 196,173 $ 156,658 $ 149,847 $ 60,168 $ 39,622 602,468$
Segment EBITDA 36,545 27,294 23,649 12,771 11,677 111,936
Segment EBITDA margin 18.6% 17.4% 15.8% 21.2% 29.5% 18.6%
Depreciation expense 4,063 3,210 2,738 565 1,027 11,603
Amortization of intangibles 10,955 431 604 1,501 10,317 23,808
Severance, restructuring, and acquisition integration costs 174 5,573 4,746 2,302 - 12,795
Deferred gross profit adjustments 283 - - - 1,076 1,359
For the three months ended September 27, 2015
Segment Revenues 186,722$ 155,148$ 147,702$ 59,184$ 41,359$ 590,115$
Segment EBITDA 27,369 25,705 23,225 10,466 11,240 98,005
Segment EBITDA margin 14.7% 16.6% 15.7% 17.7% 27.2% 16.6%
Depreciation expense 4,027 3,156 2,810 570 1,255 11,818
Amortization of intangibles 12,354 429 799 1,480 10,607 25,669
Severance, restructuring, and acquisition integration costs 13,722 192 118 54 57 14,143
Deferred gross profit adjustments 419 - - - 10,909 11,328
For the nine months ended October 2, 2016
Segment Revenues $ 560,966 $ 452,951 $ 438,746 $ 176,560 $ 120,426 1,749,649$
Segment EBITDA 89,317 80,605 73,700 34,056 32,659 310,337
Segment EBITDA margin 15.9% 17.8% 16.8% 19.3% 27.1% 17.7%
Depreciation expense 12,086 10,028 8,165 1,749 3,225 35,253
Amortization of intangibles 37,306 1,292 1,796 4,517 30,692 75,603
Severance, restructuring, and acquisition integration costs 5,871 7,280 7,982 5,910 29 27,072
Purchase accounting effects of acquisitions 195 - - - - 195
Deferred gross profit adjustments 1,391 - - - 4,021 5,412
For the nine months ended September 27, 2015
Segment Revenues $ 538,145 $ 458,756 461,549$ 181,527$ 118,102$ 1,758,079$
Segment EBITDA 73,374 75,506 76,078 31,731 29,913 286,602
Segment EBITDA margin 13.6% 16.5% 16.5% 17.5% 25.3% 16.3%
Depreciation expense 12,140 9,550 8,530 1,713 3,118 35,051
Amortization of intangibles 37,375 1,290 2,429 4,369 32,627 78,090
Severance, restructuring, and acquisition integration costs 28,532 843 3,054 2 1,102 33,533
Purchase accounting effects of acquisitions - - 267 - 9,155 9,422
Deferred gross profit adjustments 2,789 - - - 43,637 46,426
(In thousands, except percentages)
Operating Segment Information
Unaudited
© 2016 Belden Inc. | belden.com | @BeldenInc 35
Operating Segment Reconciliation to Consolidated
Results
Unaudited
October 2, 2016 September 27, 2015 October 2, 2016 September 27, 2015
Total Segment Revenues $ 602,468 $ 590,115 $ 1,749,649 $ 1,758,079
Deferred revenue adjustments (1,359) (10,849) (5,412) (46,101)
Consolidated Revenues $ 601,109 $ 579,266 $ 1,744,237 $ 1,711,978
Total Segment EBITDA $ 111,936 $ 98,005 $ 310,337 $ 286,602
Income fromequity method investment 586 348 1,077 1,459
Eliminations (977) (893) (2,694) (1,996)
Consolidated Adjusted EBITDA (1) 111,545 97,460 308,720 286,065
Amortization of intangibles (23,808) (25,669) (75,603) (78,090)
Deferred gross profit adjustments (1,359) (11,328) (5,412) (46,426)
Severance, restructuring, and acquisition integration costs (12,795) (14,143) (27,072) (33,533)
Depreciation expense (11,603) (11,818) (35,253) (35,051)
Purchase accounting effects related to acquisitions - - (195) (9,422)
Consolidated operating income 61,980 34,502 165,185 83,543
Interest expense, net (23,513) (25,416) (71,958) (74,031)
Consolidated income fromcontinuing operations before taxes $ 38,467 $ 9,086 $ 93,227 $ 9,512
Three Months Ended Nine Months Ended
(In thousands)
© 2016 Belden Inc. | belden.com | @BeldenInc 36
October 2, 2016 December 31, 2015
(Unaudited)
Current assets:
Cash and cash equivalents 748,305$ 216,751$
Receivables, net 400,528 387,386
Inventories, net 193,500 195,942
Other current assets 55,345 37,079
Total current assets 1,397,678 837,158
Property, plant and equipment, less accumulated depreciation 323,110 310,629
Goodwill 1,399,847 1,385,115
Intangible assets, less accumulated amortization 590,785 655,871
Deferred income taxes 30,596 34,295
Other long-lived assets 69,947 67,534
3,811,963$ 3,290,602$
Current liabilities:
Accounts payable 220,827$ 223,514$
Accrued liabilities 294,209 323,249
Current maturities of long-termdebt 2,500 2,500
Total current liabilities 517,536 549,263
Long-termdebt 1,690,932 1,725,282
Postretirement benefits 106,779 105,230
Deferred income taxes 45,381 46,034
Other long-termliabilities 38,283 39,270
Stockholders’ equity:
Preferred stock 1 -
Common stock 503 503
Additional paid-in capital 1,114,348 605,660
Retained earnings 760,688 679,716
Accumulated other comprehensive loss (62,876) (58,987)
Treasury stock (400,718) (402,793)
Total Belden stockholders’ equity 1,411,946 824,099
Noncontrolling interest 1,106 1,424
Total stockholders' equity 1,413,052 825,523
3,811,963$ 3,290,602$
(In thousands)
ASSETS
LIABILITIES AND STOCKHOLDERS’ EQUITY
Balance Sheet
© 2016 Belden Inc. | belden.com | @BeldenInc 37
Cash Flow Statement
Unaudited October 2, 2016 September 27, 2015
Cash flows fromoperating activities:
Net income $ 93,740 $ 16,524
Adjustments to reconcile net income to net cash provided by operating activities:
Depreciation and amortization 110,857 113,141
Share-based compensation 13,943 13,814
Taxbenefit related to share-based compensation (623) (5,064)
Changes in operating assets and liabilities, net of the effects of currency exchange
rate changes and acquired businesses:
Receivables (9,843) (6,532)
Inventories 5,626 7,979
Accounts payable (3,889) (55,973)
Accrued liabilities (43,594) 29,354
Accrued taxes (16,752) (23,884)
Other assets 2,798 1,935
Other liabilities (5,457) 687
Net cash provided by operating activities 146,806 91,981
Cash flows frominvesting activities:
Capital expenditures (36,057) (39,106)
Cash used to acquire businesses, net of cash acquired (17,848) (695,345)
Proceeds fromdisposal of tangible assets 282 145
Proceeds fromdisposal of business - 3,527
Other (971) -
Net cash used for investing activities (54,594) (730,779)
Cash flows fromfinancing activities:
Proceeds fromissuance of preferred stock, net 501,498 -
Taxbenefit related to share-based compensation 623 5,064
Borrowings under credit arrangements - 200,000
Payments under borrowing arrangements (51,875) (1,250)
Dividends paid on common stock (6,307) (6,386)
Withholding taxpayments for share-based payment awards, net of proceeds fromthe exercise of stock options (5,302) (11,517)
Debt issuance costs paid - (643)
Payments under share repurchase program - (39,053)
Net cash provided by financing activities 438,637 146,215
Effect of foreign currency exchange rate changes on cash and cash equivalents 705 (6,682)
Increase (decrease) in cash and cash equivalents 531,554 (499,265)
Cash and cash equivalents, beginning of period 216,751 741,162
Cash and cash equivalents, end of period $ 748,305 $ 241,897
Nine Months Ended
(In thousands)
© 2016 Belden Inc. | belden.com | @BeldenInc 38
GAAP to Non-GAAP Reconciliation
Unaudited
October 2, 2016 September 27, 2015 October 2, 2016 September 27, 2015
GAAP revenues 601,109$ 579,266$ 1,744,237$ 1,711,978$
Deferred revenue adjustments 1,359 10,849 5,412 46,101
Adjusted revenues 602,468$ 590,115$ 1,749,649$ 1,758,079$
GAAP gross profit 245,962$ 226,131$ 719,210$ 668,056$
Severance, restructuring, and integration costs 2,897 3,166 6,815 6,340
Deferred gross profit adjustments 1,359 11,328 5,412 46,426
Accelerated depreciation 206 75 618 175
Purchase accounting effects related to acquisitions - - 195 267
Adjusted gross profit 250,424$ 240,700$ 732,250$ 721,264$
GAAP gross profit margin 40.9% 39.0% 41.2% 39.0%
Adjusted gross profit margin 41.6% 40.8% 41.9% 41.0%
GAAP net income attributable to Belden 35,653$ 14,569$ 94,026$ 16,524$
Interest expense, net 23,513 25,416 71,958 74,031
Income tax expense (benefit) 2,902 (5,725) (513) (7,340)
Loss from discontinued operations - 242 - 242
Loss from disposal of discontinued operations - - - 86
Noncontrolling interest (88) - (286) -
Total non-operating adjustments 26,327 19,933 71,159 67,019
Amortization of intangible assets 23,808 25,669 75,603 78,090
Severance, restructuring, and integration costs 12,795 14,143 27,072 33,533
Deferred gross profit adjustments 1,359 11,328 5,412 46,426
Accelerated depreciation 222 125 634 307
Purchase accounting effects related to acquisitions - - 195 9,422
Total operating income adjustments 38,184 51,265 108,916 167,778
Depreciation expense 11,381 11,693 34,619 34,744
Adjusted EBITDA 111,545$ 97,460$ 308,720$ 286,065$
GAAP net income margin 5.9% 2.5% 5.4% 1.0%
Adjusted EBITDA margin 18.5% 16.5% 17.6% 16.3%
GAAP income from continuing operations 35,565$ 14,811$ 93,740$ 16,852$
Operating income adjustments from above 38,184 51,265 108,916 167,778
Tax effect of adjustments (12,313) (17,142) (33,227) (40,219)
Adjusted income from continuing operations 61,436$ 48,934$ 169,429$ 144,411$
GAAP income from continuing operations 35,565$ 14,811$ 93,740$ 16,852$
Less: Net loss attributable to noncontrolling interest (88) - (286) -
Less: Preferred stock dividends 6,695 - 6,695 -
GAAP income from continuing operations attributable to Belden common stockholders 28,958$ 14,811$ 87,331$ 16,852$
Adjusted income from continuing operations 61,436$ 48,934$ 169,429$ 144,411$
Less: Net loss attributable to noncontrolling interest (88) - (286) -
Less: Amortization expense attributable to noncontrolling interest, net of tax 16 - 48 -
Less: Preferred stock dividends 6,695 - 6,695 -
Adjusted income from continuing operations attributable to Belden common stockholders 54,813$ 48,934$ 162,972$ 144,411$
GAAP income from continuing operations per diluted share attributable to Belden common stockholders 0.68$ 0.35$ 2.05$ 0.39$
Adjusted income from continuing operations per diluted share attributable to Belden common stockholders 1.29$ 1.14$ 3.83$ 3.35$
GAAP and Adjusted diluted weighted average shares 42,601 42,908 42,532 43,117
business performance. As an additional example, we exclude the costs of restructuring programs, which can occur from time to time for our current businesses and/or recently acquired businesses.
We exclude the costs in calculating adjusted results to allow us and investors to evaluate the performance of the business based upon its expected ongoing operating structure. We believe the
adjusted measures, accompanied by the disclosure of the costs of these programs, provides valuable insight.
Adjusted results should be considered only in conjunction with results reported according to accounting principles generally accepted in the United States.
Three Months Ended Nine Months Ended
(In tho us ands , except percentages and per s hare amo unts )
© 2016 Belden Inc. | belden.com | @BeldenInc 39
Free Cash Flow GAAP To Non-GAAP Reconciliation
Unaudited
October 2, 2016 September 27, 2015 October 2, 2016 September 27, 2015
GAAP net cash provided by operating activities 86,352$ 86,935$ 146,806$ 91,981$
Capital expenditures, net of proceeds from
the disposal of tangible assets (10,692) (11,817) (35,775) (38,961)
Non-GAAP free cash flow 75,660$ 75,118$ 111,031$ 53,020$
We define free cash flow, which is a non-GAAP financial measure, as net cash from operating activities adjusted for capital expenditures net of
the proceeds from the disposal of tangible assets. We believe free cash flow provides useful information to investors regarding our ability to
generate cash from business operations that is available for acquisitions and other investments, service of debt principal, dividends and share
repurchases. We use free cash flow, as defined, as one financial measure to monitor and evaluate performance and liquidity. Non-GAAP
financial measures should be considered only in conjunction with financial measures reported according to accounting principles generally
accepted in the United States. Our definition of free cash flow may differ fromdefinitions used by other companies.
Three Months Ended Nine Months Ended
(In tho us a nds )
© 2016 Belden Inc. | belden.com | @BeldenInc 40
Reconciliation of Non-GAAP Measures
2016 Revenue and Earnings Guidance
Year Ended Three Months Ended
December 31, 2016 December 31, 2016
Adjusted revenues $2.355 - $2.375 billion $605 - $625 million
Deferred revenue adjustments ($7 million) ($1 million)
GAAP revenues $2.348 - $2.368 billion $604 - $624 million
Adjusted income per diluted share attributable to Belden common stockholders $5.20 - $5.30 $1.36 - $1.46
Amortization of intangible assets ($1.56) ($0.30)
Severance, restructuring, and acquisition integration costs ($0.54) ($0.08)
Deferred gross profit adjustments ($0.11) ($0.02)
Loss on debt extinguishment ($0.03) ($0.03)
Purchase accounting effects ($0.02) ($0.02)
GAAP income per diluted share attributable to Belden common stockholders $2.94 - $3.04 $0.91 - $1.01
Our guidance for revenues and income per diluted share attributable to Belden common stockholders is based upon information
currently available regarding events and conditions that will impact our future operating results. In particular, our results are subject to
the factors listed under "Forward-Looking Statements" in this release. In addition, our actual results are likely to be impacted by
other additional events for which information is not available, such as asset impairments, purchase accounting effects related to
acquisitions, severance, restructuring, and acquisition integration costs, gains (losses) recognized on the disposal of tangible assets,
gains (losses) on debt extinguishment, discontinued operations, and other gains (losses) related to events or conditions that are not yet
known.

2016 investor deck november v1

  • 1.
    © 2016 BeldenInc. | belden.com | @BeldenInc November 2016 Belden Leading the Way to an Interconnected World
  • 2.
    © 2016 BeldenInc. | belden.com | @BeldenInc 2 Leading The Way to an Interconnected World Delivering highly-engineered signal transmission solutions for mission-critical applications in a diverse set of global markets Business Platforms Applications Vertical Markets Data Sound Video Industrial Enterprise Broadcast
  • 3.
    © 2016 BeldenInc. | belden.com | @BeldenInc 3 Five Business Platforms Delivering Innovative Connectivity Solutions Broadcast Enterprise Industrial Connectivity Industrial IT Solutions Network Security • Industrial and I/O Connectors • Industrial Cable • Distribution Boxes • Customized Connectivity Solutions • Ethernet Switches • Wireless Systems • Routers and Gateways • Security Devices • Network Management Software • Copper and Fiber Connectivity • Racks and Enclosures • Ethernet, Fiber Optic and Coaxial Cabling • Custom Infrastructure Solutions • Broadcast Connectors • Routers and Interfaces • Broadband Connectivity • Multi-Viewers and Monitoring and Control Systems • Playout Systems • Vulnerability Assessment • Security Configuration Management • Log Intelligence • Analytics and Reporting
  • 4.
    © 2016 BeldenInc. | belden.com | @BeldenInc 4 A Global Signal Transmission Solutions Company Broadcast Enterprise Connectivity Industrial Connectivity Industrial IT Network Security Market Size1 $4.0B $4.2B $4.0B $1.3B $4.3B 3-Year Market Growth Rate1 1-3% 1-3% 0-2% 1-3% 10-12% Market Share 19% 14% 15% 18% 4% TTM Revenue $762.8M $600.1M $580.5M $239.3M $169.4M TTM EBITDA Margin 17.0% 17.5% 16.8% 19.0% 28.0% Key Markets • Broadband • Broadcast Studios • Mobile Production • Finance • Healthcare • Commercial Buildings • Discrete • Process • Energy • Transportation • Finance • Energy • Retail • Government • Industrial 1. Served addressable market, 2015 estimates
  • 5.
    © 2016 BeldenInc. | belden.com | @BeldenInc 5 2008 Versus 2015 Market Broadcast Enterprise Industrial Product Networking Connectivity Cable 2008 Market Product 2015 Divested cable Acquired software, networking and connectivity Network Security Security Broadcast Enterprise Industrial Networking Connectivity Cable
  • 6.
    © 2016 BeldenInc. | belden.com | @BeldenInc 6 Financial Performance Revenues (M) EBITDA Margin1 Return on Invested Capital2 Free Cash Flow3 2005 $1,246 8.5% 4.1% $37M 2015 $2,361 17.0% 12.0% $182M Variance 6.6% CAGR Improvement of 850 bps Average of 13.1% 17.3% CAGR Driving best-in-class shareholder value 1. Non-GAAP results. See investor.belden.com for reconciliation to comparable GAAP results . 2. Excluding excess cash, Average of 2012-2015. 3. See investor.belden.com for reconciliation to comparable GAAP results
  • 7.
    © 2016 BeldenInc. | belden.com | @BeldenInc 7 Connectivity Peers Cable Peers 10.0% 20.0% 30.0% 40.0% 50.0% 2005 2006 2007 2008 2009 2010 2011 2012 2013 2014 2015 A Common Misperception About Belden “Belden is a Wire and Cable company.” Improvement of 1,930 bps Belden’s Gross Profit Margin Exceeds Connectivity Peers 1. Adjusted results. See investor.belden.com for reconciliation to comparable GAAP results
  • 8.
    © 2016 BeldenInc. | belden.com | @BeldenInc 8 10 Year EPS Growth 0% 5% 10% 15% 20% 25% Peer A S&P 500 Peer B Peer C Peer D Belden Since 2005, Belden has generated upper quartile EPS growth of 22%* *2005 - 2015
  • 9.
    © 2016 BeldenInc. | belden.com | @BeldenInc 9 A Quality Balance Sheet with Long Term Maturities Fixed long term debt with no significant maturities until 2022 Euro-denominated debt based on conversion rate at 10/2/16 $5 $700 $568 $200 $222 $- $200 $400 $600 $800 2016 2017 2018 2019 2020 2021 2022 2023 2024 2025 2026
  • 10.
    © 2016 BeldenInc. | belden.com | @BeldenInc 10 4.2x 4.9x 4.9x 4.7x 4.6x 4.2x 4.5x 0.0x 1.0x 2.0x 3.0x 4.0x 5.0x 6.0x 2010 2011 2012 2013 2014 2015 2016 Net Interest Coverage Ratio Has Been Consistent Incurrence Covenant Belden generates more than 2x the required EBITDA Net Interest Coverage Ratio
  • 11.
    © 2016 BeldenInc. | belden.com | @BeldenInc 11 A Disciplined Capital Deployment Strategy Innovation and Market Expansion Share Repurchase M&A Invest in growth opportunities Repurchase Belden stock at attractive prices Identify product and market opportunities, and acquire with a disciplined approach • Product innovation • Productivity improvement • Capital expenditure • Repurchased 7.4 million shares at $47.43 average • ~16% of outstanding shares • $350M invested since 2011 • >$2.8 billion invested since 2007 • >13% Cash ROIC on acquisitions made before 2015 2015 ROIC* = 12.0% Deploy capital to highest ROIC project * ROIC excluding excess cash
  • 12.
    © 2016 BeldenInc. | belden.com | @BeldenInc 12 Operational Excellence BUSINESS MODEL Free Cash Flow Greater Than Net Income1 LEAN Enterprise Market Delivery System Talent Development 80% of capital allocated to M&A Continued Execution of Business Model to Drive Ongoing Transformation Cash Generation Portfolio Improvement 1. Adjusted Net Income. See investor.belden.com for reconciliation to comparable GAAP results
  • 13.
    © 2016 BeldenInc. | belden.com | @BeldenInc 13 A Commitment To Operational Excellence LEAN Enterprise Market Delivery System Talent Development Operational efficiency through continuous improvement on a company-wide basis Four inter-related processes that provide the foundation for organic growth Create and enhance career opportunities for talented new and current associates LEAN metrics are utilized company-wide; not just in manufacturing A global commercial team capable of solving complex networking applications 98% retention rate of high-potential associates 75% internal fill rate
  • 14.
    © 2016 BeldenInc. | belden.com | @BeldenInc 14 High Quality Earnings: Free Cash Flow Generation Delivering 21.3% CAGR in free cash flow per share 0 1 2 3 4 5 6 2005 2006 2007 2008 2009 2010 2011 2012 2013 2014 2015 FCF per Share1 1. Non-GAAP results. See investor.belden.com for reconciliation to comparable GAAP results 2. Adjusted amount. Excludes the $25.4M of Broadcast restructuring program that began in Q3 2015. $2.41 $3.07 $3.38 $2.47 $0.71 $1.80 $4.882 $3.03 $3.16 $4.28 $4.46 21.3% CAGR
  • 15.
    © 2016 BeldenInc. | belden.com | @BeldenInc 15 Buy leading companies… • That fit a strategic framework • With top management teams Our Inorganic Strategy • That offer innovative products • With opportunity for significant synergy TALENTED GLOBAL TEAM IDENTIFYING ATTRACTIVE OPPORTUNITIES THAT FIT WITHIN OUR STRATEGIC FRAMEWORK To FURTHER our LEADERSHIP within each platform Broadcast Enterprise Industrial Network Security
  • 16.
    © 2016 BeldenInc. | belden.com | @BeldenInc 16 10% 12% 14% 16% 18% 20% 2010 2011 2012 2013 2014 2015 Consistent Margin Progression We have shown the ability to consistently improve margins in a low-growth environment EBITDA Margin Goal: 18 - 20% 11.9% 11.7% 13.0% 15.7% 15.5% EBITDA Margin (%)1 17.0%Peer Average 1. Non-GAAP results. See investor.belden.com for reconciliation to comparable GAAP results
  • 17.
    © 2016 BeldenInc. | belden.com | @BeldenInc 17 Transformation To Drive Continued Margin Expansion 14% 16% 18% 20% 2015 Leverage Mix Productivity Inorganic 2018 140 bps 20 bps 120 bps 20 bps 20.0% 17.0%
  • 18.
    © 2016 BeldenInc. | belden.com | @BeldenInc 18 Opportunity Exists to Drive Increased Shareholder Value 4x 8x 12x 16x EV/EBITDAMultiple 10% 15% 20% 25% 30%5% EBITDA-Capex Margin A B C Increased free cash flow margin drives multiple expansion Legacy Peers E C D A B Best In Class Peers F 2008 Today
  • 19.
    © 2016 BeldenInc. | belden.com | @BeldenInc 19 Business Model Goals THREE YEAR FINANCIAL GOALS Growth 5 - 7% EBITDA 18 - 20% Return on Invested Capital 13 - 15% Free Cash Flow Exceed Net Income • Headwinds − Weak global growth − Strong US dollar − Sustained low oil prices • Tailwinds − Broadband demand − Smart Buildings − Cybersecurity Market Growth 1-3% Share Capture 2% Inorganic Activity 2% Total Growth 5-7% =+ +
  • 20.
    © 2016 BeldenInc. | belden.com | @BeldenInc 20 Accelerating Shareholder Value with Strong Financial Performance Balanced Profitable Well Capitalized Value Creating Consistent growth and balance across regions and platforms drives predictable results Business transformation delivering an improved business model Excellent cash flow generation, low cost of capital creates significant strategic advantage Disciplined approach to deploying capital creates value
  • 21.
    © 2016 BeldenInc. | belden.com | @BeldenInc 21 Q4 and Full Year 2016 Guidance * Fiscal Year 2016 Revenues of between $605 and $625 million *Non-GAAP results. See following slide for reconciliation to comparable GAAP results Q4 2016 EPS of between $1.36 and $1.46 per diluted share Revenues of between $2.355 and $2.375 billion EPS of between $5.20 and $5.30 per diluted share
  • 22.
    © 2016 BeldenInc. | belden.com | @BeldenInc 22 GAAP to Non-GAAP Reconciliation Year Ended Three Months Ended December 31, 2016 October 2, 2016 Adjusted revenues $2.355 - $2.385 billion $595 - $615 million Deferred revenue adjustments ($7 million) ($2 million) GAAP revenues $2.348 - $2.378 billion $593 - $613 million Adjusted income per diluted share attributable to Belden stockholders $5.15 - $5.35 $1.20 - $1.30 Amortization of intangible assets ($1.61) ($0.41) Severance, restructuring, and acquisition integration costs ($0.55) ($0.26) Deferred gross profit adjustments ($0.11) ($0.02) GAAP income per diluted share attributable to Belden stockholders $2.88 - $3.08 $0.51 - $0.61 Our guidance for revenues and income per diluted share attributable to Belden stockholders is based upon information currently available regarding events and conditions that will impact our future operating results. In particular, our results are subject to the factors listed under "Forward-Looking statements" in this release. In addition, our actual results are likely to be impacted by other additional events for which information is not available, such as asset impairments, purchase accounting effects related to acquisitions, severance, restructuring, and acquisition integration costs, gains (losses) recognized on the disposal of tangible assets, gains (losses) on debt extinguishment, discontinued operations, and other gains (losses) related to events or conditions that are not yet known.
  • 23.
    © 2016 BeldenInc. | belden.com | @BeldenInc 23 Q3 2016 Earnings Release Conference Call Presentation
  • 24.
    © 2016 BeldenInc. | belden.com | @BeldenInc 24 Our commentary and responses to your questions may contain forward-looking statements, including our outlook for the 2016 fourth quarter and full year. Forward- looking statements also include projections of sales, earnings, general economic conditions, market conditions, working capital, market shares, free cash flow, pricing levels, and effective tax rates. Belden undertakes no obligation to update any such statements to reflect later developments, except as required by law. Information on factors that could cause actual results to vary materially from those discussed today is available in the press release announcing 2016 third quarter results, our most recent Annual Report on Form 10-K as filed with the SEC on February 25, 2016 (including those discussed under “Risk Factors” in Part I, Item 1A and in “Management’s Discussion and Analysis of Financial Condition and Results of Operations” in Part II, Item 7), and our subsequent filings with the Securities and Exchange Commission. Safe Harbor Statement Non-GAAP Measures On this call we will discuss some non-GAAP measures (denoted by footnote) in discussing Belden’s performance, and the reconciliation of those measures to the most comparable GAAP measures is contained within this presentation or available at our investor relations website, investor.belden.com.
  • 25.
    © 2016 BeldenInc. | belden.com | @BeldenInc 25 • Achieved revenues of $602.5 million, an increase of 2.6% organically from the prior-year period; • Generated EBITDA margins of 18.5%, an increase of 200 basis points from the year-ago period and within our long-term target range of 18-20%; • Achieved EPS of $1.29, up 13% over last year’s $1.14; • Generated an additional $58.0 million in free cash flow year-to- date compared to the year-ago period; • Reduced net-debt to EBITDA leverage to 2.2x from 4.0x in the prior year. Q3 2016 Highlights Adjusted results. See Appendix for reconciliation to comparable GAAP results. All references to EPS refer to income attributable to Belden common stockholders per diluted share.
  • 26.
    © 2016 BeldenInc. | belden.com | @BeldenInc 26 Precision A/V Cable and Connectivity Q3 2016 Segment Overview Revenue $39.6M EBITDA Margin 29.5% Revenue $60.2M EBITDA Margin 21.2% Revenue $156.7M EBITDA Margin 17.4% Revenue $149.8M EBITDA Margin 15.8% Revenue $196.2M EBITDA Margin 18.6% Broadcast Enterprise Connectivity Industrial Connectivity Industrial IT Network Security Camera Mounted Fiber Solutions Signal Processing & Routing Monitoring Systems Automation Playout & Branding Systems Industrial and I/O Connectors Industrial Cables IP/Networking Cables I/O Modules/ Active Distribution Boxes Customer-Specific Wiring Copper and Fiber Connectivity Racks and Enclosures Ethernet, Fiber Optic and Coaxial Cables, Security & Routing Wireless Switches Connectivity Vulnerability AssessmentTargeted Attack Detection Threat Analytics Drop, Headend and Hardline Connectors
  • 27.
    © 2016 BeldenInc. | belden.com | @BeldenInc 27 Q3 2016 Financial Summary Q3 2016 Q2 2016 Q3 2015 Revenue $602.5M $603.4M $590.1M Gross profit $250.4M $252.0M $240.7M Gross profit percentage 41.6% 41.8% 40.8% EBITDA $111.5M $108.1M $97.5M EBITDA percentage 18.5% 17.9% 16.5% Net Income1 $61.4M $65.5M $48.9M Earnings Per Share2 $1.29 $1.54 $1.14 Adjusted results. See Appendix for reconciliation to comparable GAAP results. (1) All references to Net Income refer to adjusted income from continuing operations attributable to Belden (2) All references to Earnings Per Share refer to income attributable to Belden common stockholders per diluted share.
  • 28.
    © 2016 BeldenInc. | belden.com | @BeldenInc 28 Q3 2016 Segment Results Consolidated are adjusted results. See Appendix for reconciliation to comparable GAAP results. (1) Consolidated results include income from our equity method investment. Broadcast Enterprise Connectivity Industrial Connectivity Industrial IT Network Security Consolidated Q3 2016 Revenue $196.2M $156.7M $149.8M $60.2M $39.6M $602.5M EBITDA(1) $36.5M $27.3M $23.6M $12.8M $11.7M $111.5M EBITDA Margin 18.6% 17.4% 15.8% 21.2% 29.5% 18.5% Q2 2016 Revenue $193.5M $160.4M $147.8M $62.5M $39.1M $603.4M EBITDA(1) $29.5M $29.6M $27.1M $12.7M $9.5M $108.1M EBITDA Margin 15.2% 18.4% 18.3% 20.3% 24.3% 17.9% Q3 2015 Revenue $186.7M $155.1M $147.7M $59.2M $41.4M $590.1M EBITDA(1) $27.4M $25.7M $23.2M $10.5M $11.2M $97.5M EBITDA Margin 14.7% 16.6% 15.7% 17.7% 27.2% 16.5%
  • 29.
    © 2016 BeldenInc. | belden.com | @BeldenInc 29 Q3 2016 Balance Sheet Highlights Q3 2016 Q2 2016 Q3 2015 Cash and cash equivalents $748M $176M $242M Inventory turns 7.3x 7.1x 6.7x Days sales outstanding 61 days 60 days 63 days PP&E turns 7.4x 7.6x 7.4x Total debt principal amount $1.71B $1.71B $1.91B Net Leverage1 2.2x 3.6x 4.0x (1) Net leverage calculated as (A) total debt less cash and cash equivalents divided by (B) trailing twelve months Adjusted EBITDA plus trailing twelve months stock based compensation expense plus trailing twelve months long-term incentive plan expense for certain acquired companies.
  • 30.
    © 2016 BeldenInc. | belden.com | @BeldenInc 30 Q3 2016 Cash Flow Highlights (1) Capital expenditures, net of proceeds from the disposal of tangible assets. See Appendix for reconciliation. (2) Free cash flow is not a term defined by generally accepted accounting principles (GAAP) and our definition may or may not be used consistently with other companies that define this term. See Appendix for reconciliation to comparable GAAP results. (3) Net of cash acquired. Q3 2016 Q3 2015 YTD 2016 YTD 2015 Cash flows from operating activities $ 86.4M $ 86.9M $146.8M $ 92.0M Less: Net capital expenditures(1) $ 10.7M $ 11.8M $ 35.8M $ 39.0M Free cash flow (2) $ 75.7M $ 75.1M $ 111.0M $ 53.0M Cash used to acquire businesses(3) $ 0.0M $ 0.0M $ 17.8M $ 695.3M Cash dividends paid on common stock $ 2.1M $ 2.2M $ 6.3M $ 6.3M
  • 31.
    © 2016 BeldenInc. | belden.com | @BeldenInc 31 Q4 2016(1) • Revenue of $605 - $625 million • Earnings Per Share2 of $1.36 - $1.46 Outlook 2016 Full Year(1) • Revenue of $2.355 - $2.375 billion • Earnings Per Share2 of $5.20 - $5.30 (1) Adjusted Outlook. See Appendix for reconciliation to comparable GAAP outlook. (2) All references to EPS refer to income per diluted share attributable to Belden common stockholders.
  • 32.
    © 2016 BeldenInc. | belden.com | @BeldenInc 32 Appendix
  • 33.
    © 2016 BeldenInc. | belden.com | @BeldenInc 33 October 2, 2016 September 27, 2015 October 2, 2016 September 27, 2015 Revenues $ 601,109 $ 579,266 $ 1,744,237 $ 1,711,978 Cost of sales (355,147) (353,135) (1,025,027) (1,043,922) Gross profit 245,962 226,131 719,210 668,056 Selling, general and administrative expenses (126,662) (127,792) (372,125) (395,424) Research and development (33,512) (38,168) (106,297) (110,999) Amortization of intangibles (23,808) (25,669) (75,603) (78,090) Operating income 61,980 34,502 165,185 83,543 Interest expense, net (23,513) (25,416) (71,958) (74,031) Income fromcontinuing operations before taxes 38,467 9,086 93,227 9,512 Income taxbenefit (expense) (2,902) 5,725 513 7,340 Income fromcontinuing operations 35,565 14,811 93,740 16,852 Loss fromdiscontinued operations, net of tax - (242) - (242) Loss fromdisposal of discontinued operations, net of tax - - - (86) Net income 35,565 14,569 93,740 16,524 Less: Net loss attributable to noncontrolling interest (88) - (286) - Net income attributable to Belden 35,653 14,569 94,026 16,524 Less: Preferred stock dividends 6,695 - 6,695 - Net income attributable to Belden common stockholders $ 28,958 $ 14,569 $ 87,331 $ 16,524 Weighted average number of common shares and equivalents: Basic 42,126 42,417 42,073 42,536 Diluted 42,601 42,908 42,532 43,117 Basic income (loss) per share attributable to Belden common stockholders: Continuing operations $ 0.69 $ 0.35 $ 2.08 $ 0.40 Discontinued operations - (0.01) - (0.01) Disposal of discontinued operations - - - - Net income $ 0.69 $ 0.34 $ 2.08 $ 0.39 Diluted income (loss) per share attributable to Belden common stockholders: Continuing operations $ 0.68 $ 0.35 $ 2.05 $ 0.39 Discontinued operations - (0.01) - (0.01) Disposal of discontinued operations - - - - Net income $ 0.68 $ 0.34 $ 2.05 $ 0.38 Common stock dividends declared per share $ 0.05 $ 0.05 $ 0.15 $ 0.15 Three Months Ended Nine Months Ended (In thousands, except per share data) Statement of Operations Unaudited
  • 34.
    © 2016 BeldenInc. | belden.com | @BeldenInc 34 Broadcast Solutions Enterprise Connectivity Industrial Connectivity Industrial IT Network Security Total Segments For the three months ended October 2, 2016 Segment Revenues $ 196,173 $ 156,658 $ 149,847 $ 60,168 $ 39,622 602,468$ Segment EBITDA 36,545 27,294 23,649 12,771 11,677 111,936 Segment EBITDA margin 18.6% 17.4% 15.8% 21.2% 29.5% 18.6% Depreciation expense 4,063 3,210 2,738 565 1,027 11,603 Amortization of intangibles 10,955 431 604 1,501 10,317 23,808 Severance, restructuring, and acquisition integration costs 174 5,573 4,746 2,302 - 12,795 Deferred gross profit adjustments 283 - - - 1,076 1,359 For the three months ended September 27, 2015 Segment Revenues 186,722$ 155,148$ 147,702$ 59,184$ 41,359$ 590,115$ Segment EBITDA 27,369 25,705 23,225 10,466 11,240 98,005 Segment EBITDA margin 14.7% 16.6% 15.7% 17.7% 27.2% 16.6% Depreciation expense 4,027 3,156 2,810 570 1,255 11,818 Amortization of intangibles 12,354 429 799 1,480 10,607 25,669 Severance, restructuring, and acquisition integration costs 13,722 192 118 54 57 14,143 Deferred gross profit adjustments 419 - - - 10,909 11,328 For the nine months ended October 2, 2016 Segment Revenues $ 560,966 $ 452,951 $ 438,746 $ 176,560 $ 120,426 1,749,649$ Segment EBITDA 89,317 80,605 73,700 34,056 32,659 310,337 Segment EBITDA margin 15.9% 17.8% 16.8% 19.3% 27.1% 17.7% Depreciation expense 12,086 10,028 8,165 1,749 3,225 35,253 Amortization of intangibles 37,306 1,292 1,796 4,517 30,692 75,603 Severance, restructuring, and acquisition integration costs 5,871 7,280 7,982 5,910 29 27,072 Purchase accounting effects of acquisitions 195 - - - - 195 Deferred gross profit adjustments 1,391 - - - 4,021 5,412 For the nine months ended September 27, 2015 Segment Revenues $ 538,145 $ 458,756 461,549$ 181,527$ 118,102$ 1,758,079$ Segment EBITDA 73,374 75,506 76,078 31,731 29,913 286,602 Segment EBITDA margin 13.6% 16.5% 16.5% 17.5% 25.3% 16.3% Depreciation expense 12,140 9,550 8,530 1,713 3,118 35,051 Amortization of intangibles 37,375 1,290 2,429 4,369 32,627 78,090 Severance, restructuring, and acquisition integration costs 28,532 843 3,054 2 1,102 33,533 Purchase accounting effects of acquisitions - - 267 - 9,155 9,422 Deferred gross profit adjustments 2,789 - - - 43,637 46,426 (In thousands, except percentages) Operating Segment Information Unaudited
  • 35.
    © 2016 BeldenInc. | belden.com | @BeldenInc 35 Operating Segment Reconciliation to Consolidated Results Unaudited October 2, 2016 September 27, 2015 October 2, 2016 September 27, 2015 Total Segment Revenues $ 602,468 $ 590,115 $ 1,749,649 $ 1,758,079 Deferred revenue adjustments (1,359) (10,849) (5,412) (46,101) Consolidated Revenues $ 601,109 $ 579,266 $ 1,744,237 $ 1,711,978 Total Segment EBITDA $ 111,936 $ 98,005 $ 310,337 $ 286,602 Income fromequity method investment 586 348 1,077 1,459 Eliminations (977) (893) (2,694) (1,996) Consolidated Adjusted EBITDA (1) 111,545 97,460 308,720 286,065 Amortization of intangibles (23,808) (25,669) (75,603) (78,090) Deferred gross profit adjustments (1,359) (11,328) (5,412) (46,426) Severance, restructuring, and acquisition integration costs (12,795) (14,143) (27,072) (33,533) Depreciation expense (11,603) (11,818) (35,253) (35,051) Purchase accounting effects related to acquisitions - - (195) (9,422) Consolidated operating income 61,980 34,502 165,185 83,543 Interest expense, net (23,513) (25,416) (71,958) (74,031) Consolidated income fromcontinuing operations before taxes $ 38,467 $ 9,086 $ 93,227 $ 9,512 Three Months Ended Nine Months Ended (In thousands)
  • 36.
    © 2016 BeldenInc. | belden.com | @BeldenInc 36 October 2, 2016 December 31, 2015 (Unaudited) Current assets: Cash and cash equivalents 748,305$ 216,751$ Receivables, net 400,528 387,386 Inventories, net 193,500 195,942 Other current assets 55,345 37,079 Total current assets 1,397,678 837,158 Property, plant and equipment, less accumulated depreciation 323,110 310,629 Goodwill 1,399,847 1,385,115 Intangible assets, less accumulated amortization 590,785 655,871 Deferred income taxes 30,596 34,295 Other long-lived assets 69,947 67,534 3,811,963$ 3,290,602$ Current liabilities: Accounts payable 220,827$ 223,514$ Accrued liabilities 294,209 323,249 Current maturities of long-termdebt 2,500 2,500 Total current liabilities 517,536 549,263 Long-termdebt 1,690,932 1,725,282 Postretirement benefits 106,779 105,230 Deferred income taxes 45,381 46,034 Other long-termliabilities 38,283 39,270 Stockholders’ equity: Preferred stock 1 - Common stock 503 503 Additional paid-in capital 1,114,348 605,660 Retained earnings 760,688 679,716 Accumulated other comprehensive loss (62,876) (58,987) Treasury stock (400,718) (402,793) Total Belden stockholders’ equity 1,411,946 824,099 Noncontrolling interest 1,106 1,424 Total stockholders' equity 1,413,052 825,523 3,811,963$ 3,290,602$ (In thousands) ASSETS LIABILITIES AND STOCKHOLDERS’ EQUITY Balance Sheet
  • 37.
    © 2016 BeldenInc. | belden.com | @BeldenInc 37 Cash Flow Statement Unaudited October 2, 2016 September 27, 2015 Cash flows fromoperating activities: Net income $ 93,740 $ 16,524 Adjustments to reconcile net income to net cash provided by operating activities: Depreciation and amortization 110,857 113,141 Share-based compensation 13,943 13,814 Taxbenefit related to share-based compensation (623) (5,064) Changes in operating assets and liabilities, net of the effects of currency exchange rate changes and acquired businesses: Receivables (9,843) (6,532) Inventories 5,626 7,979 Accounts payable (3,889) (55,973) Accrued liabilities (43,594) 29,354 Accrued taxes (16,752) (23,884) Other assets 2,798 1,935 Other liabilities (5,457) 687 Net cash provided by operating activities 146,806 91,981 Cash flows frominvesting activities: Capital expenditures (36,057) (39,106) Cash used to acquire businesses, net of cash acquired (17,848) (695,345) Proceeds fromdisposal of tangible assets 282 145 Proceeds fromdisposal of business - 3,527 Other (971) - Net cash used for investing activities (54,594) (730,779) Cash flows fromfinancing activities: Proceeds fromissuance of preferred stock, net 501,498 - Taxbenefit related to share-based compensation 623 5,064 Borrowings under credit arrangements - 200,000 Payments under borrowing arrangements (51,875) (1,250) Dividends paid on common stock (6,307) (6,386) Withholding taxpayments for share-based payment awards, net of proceeds fromthe exercise of stock options (5,302) (11,517) Debt issuance costs paid - (643) Payments under share repurchase program - (39,053) Net cash provided by financing activities 438,637 146,215 Effect of foreign currency exchange rate changes on cash and cash equivalents 705 (6,682) Increase (decrease) in cash and cash equivalents 531,554 (499,265) Cash and cash equivalents, beginning of period 216,751 741,162 Cash and cash equivalents, end of period $ 748,305 $ 241,897 Nine Months Ended (In thousands)
  • 38.
    © 2016 BeldenInc. | belden.com | @BeldenInc 38 GAAP to Non-GAAP Reconciliation Unaudited October 2, 2016 September 27, 2015 October 2, 2016 September 27, 2015 GAAP revenues 601,109$ 579,266$ 1,744,237$ 1,711,978$ Deferred revenue adjustments 1,359 10,849 5,412 46,101 Adjusted revenues 602,468$ 590,115$ 1,749,649$ 1,758,079$ GAAP gross profit 245,962$ 226,131$ 719,210$ 668,056$ Severance, restructuring, and integration costs 2,897 3,166 6,815 6,340 Deferred gross profit adjustments 1,359 11,328 5,412 46,426 Accelerated depreciation 206 75 618 175 Purchase accounting effects related to acquisitions - - 195 267 Adjusted gross profit 250,424$ 240,700$ 732,250$ 721,264$ GAAP gross profit margin 40.9% 39.0% 41.2% 39.0% Adjusted gross profit margin 41.6% 40.8% 41.9% 41.0% GAAP net income attributable to Belden 35,653$ 14,569$ 94,026$ 16,524$ Interest expense, net 23,513 25,416 71,958 74,031 Income tax expense (benefit) 2,902 (5,725) (513) (7,340) Loss from discontinued operations - 242 - 242 Loss from disposal of discontinued operations - - - 86 Noncontrolling interest (88) - (286) - Total non-operating adjustments 26,327 19,933 71,159 67,019 Amortization of intangible assets 23,808 25,669 75,603 78,090 Severance, restructuring, and integration costs 12,795 14,143 27,072 33,533 Deferred gross profit adjustments 1,359 11,328 5,412 46,426 Accelerated depreciation 222 125 634 307 Purchase accounting effects related to acquisitions - - 195 9,422 Total operating income adjustments 38,184 51,265 108,916 167,778 Depreciation expense 11,381 11,693 34,619 34,744 Adjusted EBITDA 111,545$ 97,460$ 308,720$ 286,065$ GAAP net income margin 5.9% 2.5% 5.4% 1.0% Adjusted EBITDA margin 18.5% 16.5% 17.6% 16.3% GAAP income from continuing operations 35,565$ 14,811$ 93,740$ 16,852$ Operating income adjustments from above 38,184 51,265 108,916 167,778 Tax effect of adjustments (12,313) (17,142) (33,227) (40,219) Adjusted income from continuing operations 61,436$ 48,934$ 169,429$ 144,411$ GAAP income from continuing operations 35,565$ 14,811$ 93,740$ 16,852$ Less: Net loss attributable to noncontrolling interest (88) - (286) - Less: Preferred stock dividends 6,695 - 6,695 - GAAP income from continuing operations attributable to Belden common stockholders 28,958$ 14,811$ 87,331$ 16,852$ Adjusted income from continuing operations 61,436$ 48,934$ 169,429$ 144,411$ Less: Net loss attributable to noncontrolling interest (88) - (286) - Less: Amortization expense attributable to noncontrolling interest, net of tax 16 - 48 - Less: Preferred stock dividends 6,695 - 6,695 - Adjusted income from continuing operations attributable to Belden common stockholders 54,813$ 48,934$ 162,972$ 144,411$ GAAP income from continuing operations per diluted share attributable to Belden common stockholders 0.68$ 0.35$ 2.05$ 0.39$ Adjusted income from continuing operations per diluted share attributable to Belden common stockholders 1.29$ 1.14$ 3.83$ 3.35$ GAAP and Adjusted diluted weighted average shares 42,601 42,908 42,532 43,117 business performance. As an additional example, we exclude the costs of restructuring programs, which can occur from time to time for our current businesses and/or recently acquired businesses. We exclude the costs in calculating adjusted results to allow us and investors to evaluate the performance of the business based upon its expected ongoing operating structure. We believe the adjusted measures, accompanied by the disclosure of the costs of these programs, provides valuable insight. Adjusted results should be considered only in conjunction with results reported according to accounting principles generally accepted in the United States. Three Months Ended Nine Months Ended (In tho us ands , except percentages and per s hare amo unts )
  • 39.
    © 2016 BeldenInc. | belden.com | @BeldenInc 39 Free Cash Flow GAAP To Non-GAAP Reconciliation Unaudited October 2, 2016 September 27, 2015 October 2, 2016 September 27, 2015 GAAP net cash provided by operating activities 86,352$ 86,935$ 146,806$ 91,981$ Capital expenditures, net of proceeds from the disposal of tangible assets (10,692) (11,817) (35,775) (38,961) Non-GAAP free cash flow 75,660$ 75,118$ 111,031$ 53,020$ We define free cash flow, which is a non-GAAP financial measure, as net cash from operating activities adjusted for capital expenditures net of the proceeds from the disposal of tangible assets. We believe free cash flow provides useful information to investors regarding our ability to generate cash from business operations that is available for acquisitions and other investments, service of debt principal, dividends and share repurchases. We use free cash flow, as defined, as one financial measure to monitor and evaluate performance and liquidity. Non-GAAP financial measures should be considered only in conjunction with financial measures reported according to accounting principles generally accepted in the United States. Our definition of free cash flow may differ fromdefinitions used by other companies. Three Months Ended Nine Months Ended (In tho us a nds )
  • 40.
    © 2016 BeldenInc. | belden.com | @BeldenInc 40 Reconciliation of Non-GAAP Measures 2016 Revenue and Earnings Guidance Year Ended Three Months Ended December 31, 2016 December 31, 2016 Adjusted revenues $2.355 - $2.375 billion $605 - $625 million Deferred revenue adjustments ($7 million) ($1 million) GAAP revenues $2.348 - $2.368 billion $604 - $624 million Adjusted income per diluted share attributable to Belden common stockholders $5.20 - $5.30 $1.36 - $1.46 Amortization of intangible assets ($1.56) ($0.30) Severance, restructuring, and acquisition integration costs ($0.54) ($0.08) Deferred gross profit adjustments ($0.11) ($0.02) Loss on debt extinguishment ($0.03) ($0.03) Purchase accounting effects ($0.02) ($0.02) GAAP income per diluted share attributable to Belden common stockholders $2.94 - $3.04 $0.91 - $1.01 Our guidance for revenues and income per diluted share attributable to Belden common stockholders is based upon information currently available regarding events and conditions that will impact our future operating results. In particular, our results are subject to the factors listed under "Forward-Looking Statements" in this release. In addition, our actual results are likely to be impacted by other additional events for which information is not available, such as asset impairments, purchase accounting effects related to acquisitions, severance, restructuring, and acquisition integration costs, gains (losses) recognized on the disposal of tangible assets, gains (losses) on debt extinguishment, discontinued operations, and other gains (losses) related to events or conditions that are not yet known.