Cisco held a Q3 Fiscal Year 2015 conference call to discuss financial results and business trends. Key highlights included:
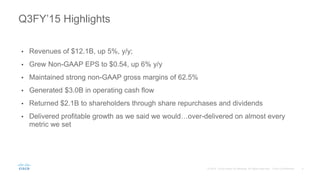
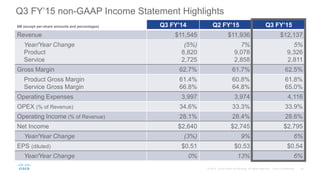
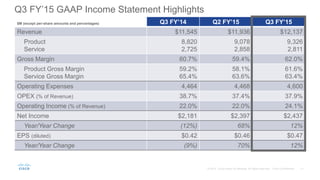
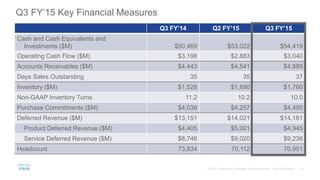
- Revenues increased 5% year-over-year to $12.1 billion, and non-GAAP EPS grew 6% to $0.54.
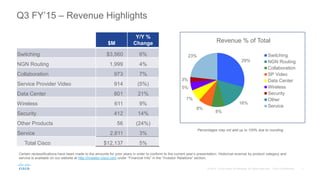
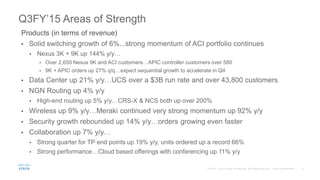
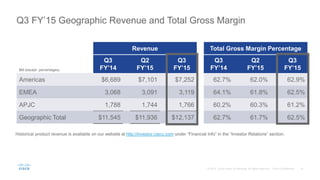
- Switching revenue grew 6% driven by strong demand for the Application Centric Infrastructure portfolio. Data center revenue increased 21%.
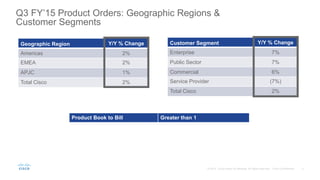
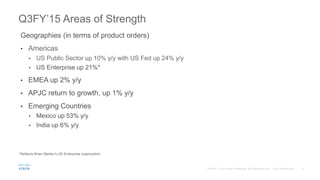
- Geographically, Americas and EMEA product orders increased 2% each while APJC returned to 1% growth. Enterprise orders grew 7% and public sector orders grew 7%.
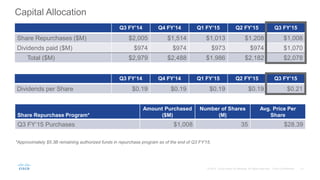
- For Q3, Cisco generated $3 billion in operating cash flow and returned $2.1