Aon plc reported first quarter 2016 results with the following highlights:
- Organic revenue growth of 3% in both Risk Solutions and HR Solutions segments.
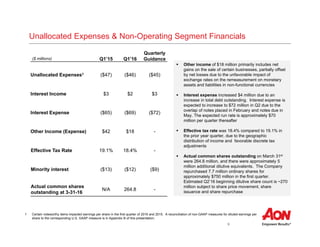
- Risk Solutions operating margin increased 100 basis points to 24.2% due to organic revenue growth and investments in data and analytics.
- HR Solutions operating margin decreased 140 basis points to 11.8% due to $20 million in transaction and portfolio repositioning costs.
- EPS of $1.35 was down 1% year-over-year due to unfavorable foreign exchange rates.
This document provides an overview of Aon plc for investors. It summarizes that Aon is an industry-leading global professional services firm focused on risk, retirement, and health operating in growing markets. It operates two industry-leading segments, Aon Hewitt and Aon Risk Solutions, which serve clients in over 120 countries. The markets of risk, retirement, and health that Aon operates in are growing in both size and complexity long-term.
Aon reported its second quarter 2016 results, with the following highlights:
- Organic revenue grew 3% in Risk Solutions and 1% in HR Solutions. Retail Brokerage delivered strong 4% organic revenue growth, with 6% growth internationally.
- Risk Solutions operating margin increased 70 basis points due to organic revenue growth, favorable foreign exchange, and investments in data/analytics. HR Solutions margin declined 40 basis points due to expenses for future growth and divestitures.
- Earnings per share improved 6%, reflecting operational improvements and capital management.
- Year-to-date free cash flow increased 51% to $660 million, driven by higher operating cash flow and lower capital expenditures.
This document summarizes Principal Financial Group's first quarter 2016 earnings call. Some key points:
- Outstanding investment performance with over 90% of investment options in the top two Morningstar quartiles.
- Record assets under management of $548 billion with $3.3 billion in net cash flows for the quarter.
- Deployed $196 million in capital through share repurchases and dividends. Announced an increase in the second quarter dividend.
- Underlying fundamentals remain strong despite macroeconomic headwinds.
Aon plc provided an investor relations overview document that contained the following information:
1) Aon operates two industry-leading segments, Risk Solutions and HR Solutions, that focus on risk, retirement, and health. It has a global presence across over 120 countries.
2) The markets that Aon operates in, including risk insurance and retirement, are growing in both size and complexity long-term. Factors like GDP growth and emerging markets are driving increased demand for insurance.
3) Aon has positioned itself for growth by focusing its portfolio, making strategic acquisitions, and investing in global capabilities like data and analytics. It has made progress towards long-term operational targets and delivered strong financial results
- Discover Financial reported a 31% increase in diluted EPS of $1.14 for the fourth quarter of 2015 compared to the prior year. Revenue increased 8% to $2.2 billion, though was down slightly excluding a one-time charge from 2014. The provision for loan losses rose 6% due to a larger reserve build. Expenses were flat as higher professional fees in 2015 offset one-time charges in 2014.
- For the full year 2015, revenue increased 3% while EPS grew 5% compared to 2014. Loan growth and strong credit performance contributed to results, though expenses grew due to investments in compliance. The company will focus on loan growth, expense management, and capital deployment in 2016 to continue delivering
- Discover Financial reported first quarter 2017 financial results, with diluted EPS of $1.43, up 6% year-over-year. Revenue grew 5% to $2.3 billion due to an 8% increase in net interest income, partially offset by higher rewards expense. Credit performance remained stable compared to historical levels.
- Discover Financial reported a 5% increase in diluted EPS to $1.35 for Q1 2016. Revenue net of interest expense grew 2% to $2.2 billion, as loan growth offset the lack of mortgage income. Provision for loan losses increased 9% due to a higher reserve build. Expenses grew 1% as increases in compliance costs offset reductions from exiting mortgage origination. Credit quality improved with net charge-offs up 3% and delinquency rates mostly stable.
Aon plc reported strong financial results for the fourth quarter and full year of 2016. Some key highlights include:
- Organic revenue growth of 3% in both segments for the fourth quarter driven by growth across regions and businesses.
- Record operating margins of 26.2% for Risk Solutions and 20.8% for HR Solutions in the fourth quarter due to organic revenue growth and expense discipline.
- Double digit earnings growth of 13% for the fourth quarter and 7% for the full year 2016 driven by strong operating performance and capital management initiatives.
- Record free cash flow of $2.1 billion for 2016, a 22% increase over 2015, demonstrating effective cash generation.
- Discover Financial reported diluted EPS of $1.47 for 2Q16, up 11% YOY, including a one-time $0.11 tax benefit. Revenue was $2.2 billion, up 2% YOY, as higher net interest income was offset by higher rewards expenses and lack of mortgage income. Provision for loan losses increased 35% to $412 million due to loan growth and a $28 million reserve build.
- Discover Financial Services reported financial results for 3Q16 with diluted EPS up 13% year-over-year to $1.56 per share.
- Revenue was $2.3 billion, up 5% year-over-year, driven by higher net interest income partially offset by higher rewards expenses.
- Operating expenses increased 1% to $895 million due to investments in marketing and regulatory compliance staff, while credit quality remained stable.
- The company repurchased $582 million in stock and remains well capitalized with a Common Equity Tier 1 Capital Ratio of 13.8% under fully phased-in Basel III rules.
Discover reported financial results for full year 2016 and 4Q16. Key highlights include:
- 2016 diluted EPS grew 12% to $5.77 driven by loan growth and lower expenses.
- 4Q16 diluted EPS increased 23% to $1.40 due to higher net interest income and lower expenses.
- Loan balances and credit card sales volumes increased year-over-year for both periods. However, provision for loan losses grew due to higher net charge-offs from loan growth and seasoning.
Aon reported strong results for the first quarter of 2017. Organic revenue grew 4%, operating margin expanded 220 basis points to 22.3%, earnings per share increased 20% to $1.45, and free cash flow grew 38% to $148 million. Aon is a leading global professional services firm that provides risk, retirement, and health solutions using proprietary data and analytics to help clients reduce volatility and improve performance.
The document provides an overview of TDS Telecom's fourth quarter 2016 results and strategic priorities for 2017. Key points include:
- 2016 results showed revenue impacts from competition but improvements in churn. Adjusted EBITDA was up 4% excluding discrete items.
- 2017 priorities are protecting the customer base, driving high margin revenue streams, and continuing cost improvements. Investments will focus on network quality and preparing for VoLTE deployment.
- Guidance for 2017 estimates total operating revenues of $3.8-4 billion and adjusted EBITDA of $650-800 million.
The document is an investor presentation for Canadian Tire Corporation that provides an overview of the company and its various business segments. It discusses the company's strengths, growth plans, and financial highlights for its retail banners (Canadian Tire, FGL Sports, and Mark's), CT REIT, and Canadian Tire Bank. The presentation outlines strategies to strengthen its core retail businesses, engage younger customers, expand digital capabilities, and pursue growth opportunities across its brands and real estate portfolio.
Synacor is a digital technology company that enables cable and telecom providers to better engage with consumers through portal experiences, email/collaboration, video platforms, and advertising solutions. The document outlines Synacor's growth strategy focused on recurring and fee-based revenue streams, and targets $300 million in revenue and $30 million in EBITDA by 2019 through winning new customers, expanding existing customer relationships, and growing advertising and open source support offerings. Financial guidance projects 2017 revenue of $160-170 million and adjusted EBITDA of $6-10 million.
This document summarizes CNO Financial Group's financial and operating results for the second quarter of 2017. Some key highlights include:
- Total collected premiums were up 7% compared to the prior year period. First-year collected premiums were up 16%.
- Net operating income per share increased 29% to $0.45 compared to the second quarter of 2016. Excluding significant items, net operating income per share was up 24% to $0.42.
- Segment results were positive across most insurance product lines, with favorable margins in long-term care, supplemental health, and Medicare supplement.
- Investment income increased due to higher call and prepayment income from bonds in the portfolio.
- Aon plc reported third quarter 2016 results with solid organic revenue growth and free cash flow.
- Risk Solutions organic revenue grew 3% and HR Solutions grew 4%, with 5% growth in both Americas Retail Brokerage and Outsourcing.
- Operating margin for Risk Solutions increased slightly due to revenue growth and foreign exchange impact, while HR Solutions margin declined due to legacy contract costs and portfolio repositioning.
- Earnings per share improved 4% through effective capital management and operational improvements. Year-to-date free cash flow increased 24% on strong cash flow from operations and lower capital expenditures.
Mike Salop introduces the presentation and notes that it contains forward-looking statements. The document then provides a summary of Western Union's Q4 2016 financial performance, including that GAAP revenues declined 1% while constant currency revenues increased 4%. It also notes that consumer money transfer performance was driven by strong results from westernunion.com and the U.S. business, and that settlements were reached to resolve U.S. government investigations. The presentation concludes by outlining Western Union's 2017 outlook and plans to continue strategic focus on mobile/online services and customer experience through a transformation program.
Aon plc provides an investor relations overview document that discusses its industry-leading franchise focused on risk, retirement, and health. It operates in growing markets and has positioned itself to create further shareholder value. Aon has focused its portfolio, invested in global capabilities, delivered strong financial results and free cash flow, and consistently outperformed peers in total shareholder returns. It sees opportunities to significantly increase free cash flow generation through operational improvements and has financial flexibility to effectively allocate capital.
Visa inc. q1 2016 financial results conference call presentationvisainc
Visa reported financial results for its fiscal first quarter of 2016, with the following key highlights:
- Net operating revenues increased 5% year-over-year to $3.6 billion.
- Net income was $1.9 billion, with adjusted net income of $1.7 billion.
- Payments volume grew 4% nominally to $1.3 trillion.
- The company repurchased $2 billion of stock and expects full year revenue growth in the high single to low double digits range.
- Net revenue for the third quarter of fiscal year 2016 was $555 million, down 4% from the previous year. Earnings per share were $0.41 excluding special items, up 3% from the previous year.
- Free cash flow on a trailing twelve month basis was $681 million, or 31% of revenue. The company returned $170 million to shareholders in the form of dividends and share repurchases.
- Guidance for the fourth quarter of fiscal year 2016 forecasts revenue between $555-595 million and earnings per share between $0.45-0.51 excluding special items.
BGC Partners reported financial results for the second quarter of 2016. Revenues declined slightly year-over-year but pre-tax and post-tax distributable earnings increased due to improved margins. The financial services segment saw higher pre-tax profits and margins despite the sale of the Trayport business, driven by growth in fully electronic trading. BGC completed its acquisition of Sunrise Brokers Group and CRE Group to expand its offerings.
Aon plc reported first quarter 2015 results with the following highlights:
- Organic revenue growth of 3% in Risk Solutions and 4% in HR Solutions.
- Operating margins decreased in both segments due to foreign exchange impacts, though underlying operational improvements were achieved.
- EPS grew 7% to $1.37 despite a $0.15 unfavorable foreign exchange impact.
- Free cash flow improved significantly to $74 million compared to negative $66 million in Q1 2014.
Visa inc. q2 2017 financial results conference call presentationvisainc
- Visa reported strong fiscal second quarter 2017 financial results, with adjusted net income of $2.1 billion excluding special items related to the Visa Europe reorganization.
- Net operating revenue increased 23% to $4.5 billion, driven by the inclusion of Europe and continued growth in payments volume, cross-border volume, and processed transactions.
- The company returned approximately $2.1 billion to shareholders in the form of share repurchases and dividends in the fiscal second quarter.
This document provides an overview of Belden, a global signal transmission solutions company. It discusses Belden's five business platforms that deliver innovative connectivity solutions for broadcast, enterprise, industrial, and network security applications. It highlights Belden's financial performance over time, including improvements in EBITDA margin, return on invested capital, and free cash flow. The document also outlines Belden's strategy for capital deployment, including investing in innovation, acquisitions, and share repurchases. Finally, it provides guidance for Q2 and full year 2016 revenues and earnings per share.
Evine earnings investor presentation f16 q1 finalevine2015
- Net sales increased 5% in Q1 2016 compared to Q1 2015. Gross profit increased 7% over the same period.
- Adjusted EBITDA was $3.4 million in Q1 2016, down from $9.2 million in FY 2015.
- Net loss was $4.9 million in Q1 2016, compared to a net loss of $12.3 million in FY 2015.
This document contains charts showing trends in global IP traffic, mobile data traffic, global IP video traffic, and global data center traffic from 2014 to 2019. It also includes a description of a partnership between AT&T and Digital Realty to provide colocation services and connectivity. Finally, it presents a reconciliation of Telx core EBITDA and non-GAAP financial measures for the third quarter of 2016. In summary, global digital traffic is growing significantly year over year across several metrics, and the partnership combines AT&T's network capabilities with Digital Realty's colocation facilities.
May 4th 2016 investor relations presentationXOGroup
This document provides an overview of XO Group Inc., including its strategic transformation, leadership team, financial performance, and outlook. Key points include: XO Group is transforming its business under new leadership to focus on its #1 online wedding brand and growing baby brand, with the goal of achieving double digit revenue growth and 20% adjusted EBITDA margins. In Q1 2016, revenue grew 9% year-over-year and transactions revenue increased 83%, driven by strong registry and commerce results.
Aon plc reported third quarter 2015 results with the following highlights:
- Solid organic revenue growth of 1% in Risk Solutions and 5% in HR Solutions despite macroeconomic challenges.
- Operating margin increased 50 basis points in Risk Solutions and 90 basis points in HR Solutions.
- EPS grew 9% excluding impacts of foreign exchange and a one-time gain in prior year, driven by operational improvements.
- Year-to-date free cash flow grew 22% from improved working capital and lower pension/restructuring payments, partly offset by higher capital expenditures.
- Aon reported 2% organic revenue growth in Q2 2015 for both its Risk Solutions and HR Solutions segments.
- Risk Solutions saw 4% organic growth in the Americas and solid growth in Asia, while HR Solutions saw 3% growth in both Consulting and Outsourcing.
- Operating margins increased 150 bps for Risk Solutions due to organic revenue growth and investments in data/analytics, while HR Solutions margins were flat as growth offset continued investments.
- EPS grew 11% excluding currency impacts, driven by operational improvements and share repurchases totaling $300 million.
Aon plc reported strong fourth quarter and full year 2015 results across key metrics such as organic revenue growth, operating margin, earnings per share (EPS), and free cash flow. Organic revenue grew 5% in Risk Solutions and 4% in HR Solutions. Operating margin increased in both segments driven by organic revenue growth and investments in data and analytics. EPS grew 20% through strong operating performance and capital management. Free cash flow reached a record high of $1.7 billion due to improved cash flow from operations and working capital.
Aon reported its second quarter 2018 results, with continued momentum across key metrics. Organic revenue grew 5% overall in Q2, driven by strong growth in Commercial Risk, Reinsurance, and Health solutions. Operating margin expanded 130 basis points in Q2, and earnings per share grew 31% year-over-year. Adjusted free cash flow grew 17% year-to-date, excluding impacts from restructuring initiatives. Aon is investing in innovation and a single operating model to drive further long-term growth and unlock significant shareholder value through increasing free cash flow and reducing shares outstanding.
Aon plc reported third quarter 2018 results that showed continued positive performance across key metrics. Organic revenue growth was 6% in Q3 and 4% year-to-date, an acceleration from the prior year. Operating margin expanded 190 basis points to 18.5% in Q3 and 210 basis points year-to-date. Earnings per share grew 34% in Q3 and 29% year-to-date. The company is well positioned for long-term value creation through mid-single digit organic revenue growth, continued operating margin expansion, and double-digit free cash flow growth.
- Aon plc reported third quarter 2014 results with key metrics showing continued progress including 3% organic revenue growth, stable 17.6% operating margin year-over-year, and 14% earnings per share growth to $1.29.
- Risk Solutions grew 1% organically while HR Solutions grew 7% organically, driven by strong 14% growth in HR Consulting.
- Operating margins were impacted by $27 million of unfavorable items in Risk Solutions but increased 110 bps in HR Solutions.
- Double-digit earnings growth was achieved through underlying performance despite currency headwinds.
- Aon plc reported its second quarter 2017 results on August 4, 2017, with Greg Case, CEO, and Christa Davies, CFO, presenting.
- Key metrics showed strong operational performance, with 3% organic revenue growth, a 110 basis point increase in operating margin to 22.4%, and 13% growth in earnings per share to $1.45.
- Aon is accelerating its strategy of providing risk, retirement, and health solutions using proprietary data and analytics to empower clients, having divested outsourcing businesses to focus on advice and solutions.
- Aon reported its first quarter 2018 results on May 4, 2018.
- Organic revenue growth was 4% in both 2017 and 2016, up from 3% in 2015 and 2014, showing accelerating growth.
- The divestiture of outsourcing businesses provided $3 billion in capital to invest in high-growth, high-margin areas and further aligns the portfolio around clients' priorities.
Aon plc reported its fourth quarter and full year 2017 results on February 2, 2018. Key metrics included organic revenue growth of 6% in Q4 2017 and 4% for the full year, driven by investment in high-growth areas. Operating margin in Q4 2017 was 27.5%, up 200 basis points year-over-year. Aon accelerated its strategy of focusing on risk, retirement, and health solutions by divesting outsourcing businesses to further align its portfolio around clients' priorities and provide $3 billion for strategic investments.
Aon reported strong fourth quarter and full year 2017 results, with organic revenue growth of 6% and 4% respectively. Earnings per share grew 18% in the quarter and 17% for the full year, driven by organic revenue growth, operational improvements, and capital management. Aon is strategically investing proceeds from divestitures of $3 billion in high-growth areas like data and analytics, cyber, and healthcare to drive future growth. The company is also investing in a new operating model to improve scalability, connectivity, and efficiency, and expects $450 million in savings by 2019.
Aon reported strong fourth quarter and full year 2017 results, with organic revenue growth of 6% and 4% respectively. Earnings per share grew 18% in the quarter and 17% for the full year, driven by organic revenue growth, operational improvements, and capital management. Aon is strategically investing proceeds from divestitures of $3 billion in high-growth areas like data and analytics, cyber, and healthcare to drive future growth. The company has incurred 48% of the estimated restructuring charges for its operating model transformation and expects to realize only 63% of the total estimated savings to date, positioning Aon for continued margin expansion.
Aon plc reported its third quarter 2017 results on October 27, 2017. Key metrics included 2% organic revenue growth, a 170 basis point increase in operating margin to 20.3%, and 18% growth in earnings per share to $1.29. Aon is accelerating its strategy of investing in high-growth, high-margin areas through the divestiture of outsourcing businesses and reinvesting the $3 billion in proceeds.
This document provides an overview of Aon plc for investors. It discusses Aon's industry-leading risk, retirement, and health solutions franchise operating in growing global markets. It highlights how Aon has focused its portfolio, invested in global capabilities, and made progress towards long-term operational targets while delivering strong financial results and total shareholder returns that have outperformed peers and market indices. The document also outlines the substantial opportunity for further value creation through significantly increasing free cash flow generation given Aon's strong financial flexibility and ability to effectively allocate capital to maximize returns.
This document provides an overview of Aon plc for investors. It discusses Aon's industry-leading risk, retirement, and health solutions franchise operating in growing global markets. It highlights how Aon has focused its portfolio, invested in global capabilities, and made progress towards long-term operational targets while delivering strong financial results and total shareholder returns that have outperformed peers and market indices. The document also outlines the substantial opportunity for further value creation through significantly increasing free cash flow generation, having strong financial flexibility to effectively allocate growing free cash flows to maximize total shareholder return.
This document provides an overview of Aon plc for investors. It discusses Aon's industry-leading franchise focused on risk, retirement, and health solutions. It operates in growing global markets in both the size and complexity of risk. The document outlines Aon's progress in positioning the firm against its strategic plan, including focusing its portfolio and investing in global capabilities. It made continued progress toward long-term operational targets and substantial opportunity remains for further value creation.
The document provides an overview of Aon plc, a global professional services firm focused on risk, retirement, and health solutions. It summarizes Aon's industry-leading position, global network of over 500 offices in 120 countries, and operations in growing insurance and HR consulting markets. The document also outlines steps Aon has taken to focus its portfolio, invest in capabilities, and deliver strong financial results including 3-4% annual organic revenue growth, 19-22% operating margins, and over $1 billion in annual free cash flow. Finally, it discusses opportunities for further value creation such as united growth efforts, continued margin expansion, effective capital allocation, and long-term shareholder returns.
Aon plc is a global professional services firm focused on risk, retirement, and health solutions. It has achieved several goals in recent years, including focusing its portfolio, significantly investing in global capabilities, and delivering strong financial results. Going forward, Aon aims to unite its operations to drive sustainable long-term growth, continue meeting long-term operating margin targets, effectively allocate capital through strong free cash flow generation, and pursue strategies to further increase shareholder value over the long run.
This document provides an overview of Aon plc, a global professional services firm. It begins with contact information for key executives and a safe harbor statement regarding forward-looking statements. It then outlines Aon's industry-leading positions in risk solutions and human resources solutions. Aon has the largest global network of resources and capabilities, operating in over 120 countries. The markets Aon operates in are growing in both size and complexity long-term. The document discusses how over the past several years Aon has focused its portfolio, significantly invested in global capabilities, and delivered on key financial metrics. It concludes by stating what Aon will do over the next several years.
This document provides an overview of Aon plc for investors. It begins with introductory information including leadership and a safe harbor statement. It then discusses Aon's industry-leading position in risk solutions and HR solutions. It highlights the company's global network and presence. The document reviews what Aon has achieved in recent years including focusing its portfolio, investing in capabilities, and delivering strong financial results. Finally, it outlines Aon's plans and targets for the next several years, which include continuing growth, margin expansion, strong free cash flow generation, and long-term value creation for shareholders.
Aon reported its second quarter 2022 results. Total revenue grew 3% year-over-year to $2.8 billion. Operating margin was 23.5% and earnings per share were $2.33. Cash flows from operations were $1.1 billion. The presentation focused on Aon's quarterly performance and its strategy to deliver long-term growth and shareholder value through consistent free cash flow generation.
Methanex is the world's largest producer and supplier of methanol. We create value through our leadership in the global production, marketing and delivery of methanol to customers. View our latest Investor Presentation for more details.
World economy charts case study presented by a Big 4
World economy charts case
World economy charts case study presented by a Big 4
World economy charts case study presented by a Big 4World economy charts case study presented by a Big 4
World economy charts case study presented by a Big 4
World economy charts case study presented by a Big 4World economy charts case study presented by a Big 4World economy charts case study presented by a Big 4World economy charts case study presented by a Big 4World economy charts case study presented by a Big 4World economy charts case study presented by a Big 4World economy charts case study presented by a Big 4World economy charts case study presented by a Big 4World economy charts case study presented by a Big 4World economy charts case study presented by a Big 4World economy charts case study presented by a Big 4World economy charts case study presented by a Big 4World economy charts case study presented by a Big 4World economy charts case study presented by a Big 4study presented by a Big 4
UnityNet World Environment Day Abraham Project 2024 Press ReleaseLHelferty
June 12, 2024 UnityNet International (#UNI) World Environment Day Abraham Project 2024 Press Release from Markham / Mississauga, Ontario in the, Greater Tkaronto Bioregion, Canada in the North American Great Lakes Watersheds of North America (Turtle Island).
ZKsync airdrop of 3.6 billion ZK tokens is scheduled by ZKsync for next week.pdfSOFTTECHHUB
The world of blockchain and decentralized technologies is about to witness a groundbreaking event. ZKsync, the pioneering Ethereum Layer 2 network, has announced the highly anticipated airdrop of its native token, ZK. This move marks a significant milestone in the protocol's journey, empowering the community to take the reins and shape the future of this revolutionary ecosystem.
Cleades Robinson, a respected leader in Philadelphia's police force, is known for his diplomatic and tactful approach, fostering a strong community rapport.
3. 2
Safe Harbor Statement
This communication contains certain statements related to future results, or states our intentions, beliefs and expectations or predictions for the future which are forward-looking
statements as that term is defined in the Private Securities Litigation Reform Act of 1995. These forward-looking statements are subject to certain risks and uncertainties that could
cause actual results to differ materially from either historical or anticipated results depending on a variety of factors. These forward-looking statements include information about
possible or assumed future results of our operations. All statements, other than statements of historical facts that address activities, events or developments that we expect or
anticipate may occur in the future, including such things as our outlook, future capital expenditures, growth in commissions and fees, changes to the composition or level of our
revenues, cash flow and liquidity, expected tax rates, business strategies, competitive strengths, goals, the benefits of new initiatives, growth of our business and operations, plans
and references to future successes, are forward-looking statements. Also, when we use the words such as “anticipate”, “believe”, “estimate”, “expect”, “intend”, “plan”, “probably”,
“potential”, “looking forward”, or similar expressions, we are making forward-looking statements.
The following factors, among others, could cause actual results to differ from those set forth in the forward looking statements: general economic and political conditions in different
countries in which Aon does business around the world; changes in the competitive environment; fluctuations in exchange and interest rates, including negative yields in some
jurisdictions, that could influence revenue and expense; changes in global equity and fixed income markets that could affect the return on invested assets; changes in the funding
status of Aon's various defined benefit pension plans and the impact of any increased pension funding resulting from those changes; the level of Aon’s debt limiting financial flexibility;
rating agency actions that could affect Aon's ability to borrow funds; the effect of the change in global headquarters and jurisdiction of incorporation, including differences in the
anticipated benefits; changes in estimates or assumptions on our financial statements; limits on Aon’s subsidiaries to make dividend and other payments to Aon; the impact of
lawsuits and other contingent liabilities and loss contingencies arising from errors and omissions and other claims against Aon; the impact of, and potential challenges in complying
with, legislation and regulation in the jurisdictions in which Aon operates, particularly given the global scope of Aon’s businesses and the possibility of conflicting regulatory
requirements across jurisdictions in which Aon does business; the impact of any investigations brought by regulatory authorities in the U.S., U.K. and other countries; the impact of
any inquiries relating to compliance with the U.S. Foreign Corrupt Practices Act and non-U.S. anti-corruption laws and with U.S. and non-U.S. trade sanctions regimes; failure to
protect intellectual property rights or allegations that we infringe on the intellectual property rights of others; the effects of English law on our operating flexibility and the enforcement
of judgments against Aon; the failure to retain and attract qualified personnel; international risks associated with Aon’s global operations; the effect or natural or man-made disasters;
the potential of a system or network breach or disruption resulting in operational interruption or improper disclosure of personal data; Aon’s ability to develop and implement new
technology; damage to our reputation among clients, markets or third parties; the actions taken by third parties that preform aspects of our business operations and client
services; the extent to which Aon manages certain risks created in connection with the various services, including fiduciary and investments and other advisory services and
business process outsourcing services, among others, that Aon currently provides, or will provide in the future, to clients; Aon’s ability to grow, develop and integrate companies that it
acquires or new lines of business; changes in commercial property and casualty markets, commercial premium rates or methods of compensation; changes in the health care system
or our relationships with insurance carriers; and Aon’s ability to implement initiatives intended to yield cost savings, and the ability to achieve those cost savings.
Any or all of Aon’s forward-looking statements may turn out to be inaccurate, and there are no guarantees about Aon’s performance. The factors identified above are not
exhaustive. Aon and its subsidiaries operate in a dynamic business environment in which new risks may emerge frequently. Further information concerning Aon and its businesses,
including factors that potentially could materially affect Aon's financial results, is contained in Aon's filings with the SEC. See Aon’s Annual Report on Form 10-K and its Quarterly
Reports on Form 10-Q for a further discussion of these and other risks and uncertainties applicable to Aon’s businesses. These factors may be revised or supplemented in
subsequent reports. Aon is under no obligation, and expressly disclaims any obligation, to update or alter any forward-looking statement that it may make from time to time, whether
as a result of new information, future events or otherwise.
Explanation of Non-GAAP Measures
This communication includes supplemental information related to organic revenue, free cash flow, adjusted operating margin, and adjusted earnings per share that exclude the
effects of restructuring charges, intangible asset amortization, capital expenditures, transaction and integration costs and certain other noteworthy items that affected results for the
comparable periods. Organic revenue excludes from reported revenues the impact of foreign exchange, acquisitions, divestitures, transfers between business units, reimbursable
expenses and unusual items. The impact of foreign exchange is determined by translating last year's revenue, expense or net income at this year's foreign exchange
rates. Reconciliations are provided in the attached schedules. Supplemental organic revenue information and additional measures that exclude the effects of the restructuring
charges and certain other items do not affect net income or any other GAAP reported amounts. Free cash flow is cash flow from operating activity less capital expenditures.
Management believes that these measures are important to make meaningful period-to-period comparisons and that this supplemental information is helpful to investors. They
should be viewed in addition to, not in lieu of, the Company’s Consolidated Financial Statements. Industry peers provide similar supplemental information regarding
their performance, although they may not make identical adjustments.
4. 3
Key Metrics1 – Delivered Progress in Q1 for a Solid Start to 2016
Q1 Organic Revenue
Organic revenue growth of +3% in Risk Solutions and +2% in HR
Solutions
Solid organic revenue growth across all major businesses, including
4% growth in both Americas and International retail brokerage
Q1 Operating Margin
Risk Solutions increased +100 bps driven primarily by solid organic
revenue growth and return on investments in data and analytics
HR Solutions decreased -140 bps driven by a $20 million, or -220 bps,
unfavorable impact from transaction and portfolio repositioning costs,
partially offset by organic revenue growth and expense discipline
Q1 EPS
Includes a $0.10 unfavorable impact from changes in foreign currency
exchange rates
Strong underlying earnings growth reflecting operational
improvements and effective capital management
Repurchased approximately $750 million of ordinary shares
YTD Free Cash Flow
Seasonally weakest cash flow quarter
Decline in free cash flow primarily reflects unfavorable timing of
certain tax related items impacting the first three months that we
expect will favorably impact the first six months of 2016, partially
offset by working capital improvements, a decline in cash paid for
pension contributions and restructuring and a $10 million decrease in
capital expenditures
1 The results presented above are non-GAAP measures that are reconciled in the appendix of this presentation.
2 Organic revenue excludes the impact of foreign exchange, acquisitions, divestitures, transfers, reimbursable expenses and other unusual items. Change
in organic revenue, a non-GAAP measure, is reconciled to the corresponding U.S. GAAP change in revenue in Appendix A of this presentation.
3 Certain noteworthy items impacted operating margin and earnings per share in the first quarter of 2016 and 2015. A reconciliation of non-GAAP
measures for operating margin and diluted earnings per share to the corresponding U.S. GAAP measure is in Appendix B of this presentation.
4 Free cash flow is defined as cash flow from operations less capital expenditures. This non-GAAP measure does not imply or represent a precise
calculation of residual cash flow available for discretionary expenditures. A reconciliation of free cash flow to the corresponding
U.S. GAAP measure can be found in Appendix A of this presentation.
Q1’15 Q1’16
1. Organic Revenue2 +3% +3%
Prior Year
2. Operating Margin3 18.3% 18.5%
Y-o-Y change +20 bps
3. Earnings per Share3 $1.37 $1.35
Y-o-Y change -1%
4. Free Cash Flow4 $236M $221M
Y-o-Y change -6%
5. 4
Organic Revenue1 – Growth Across Every Major Business
Q1 Risk Solutions
Americas: Record new business generation in US
Retail, solid growth in Affinity, and strong management
of the renewal book portfolio in Latin America
International: Continued growth across Asia and in New
Zealand, as well as solid growth in continental Europe
driven by both new business generation and
management of the renewal book portfolio
Reinsurance: Growth from facultative placements,
cedent demand in treaty placements, and new business
generation, partially offset by an unfavorable market
impact globally
Q1’15 Q1’16
Risk Solutions
Americas 4% 4%
International 3% 4%
Retail 4% 4%
Reinsurance -1% 1%
Total Risk Solutions +3% +3%
HR Solutions
Consulting 2% 3%
Outsourcing 4% 1%
Total HR Solutions +4% +2%
Total Aon +3% +3%
Q1 HR Solutions
Consulting: Continued growth in investment consulting,
as well as growth in core pension solutions and
communications consulting
Outsourcing: Solid growth in HR BPO for cloud-based
solutions. Prior year quarter benefitted from timing of
certain follow-on enrollments on the retiree exchange
1 Organic revenue excludes the impact of foreign exchange, acquisitions, divestitures, transfers, reimbursable expenses and other unusual items. Change
in organic revenue, a non-GAAP measure, is reconciled to the corresponding U.S. GAAP change in revenue in Appendix A of this presentation
6. 5
Investing in the Business to Position the Firm for Long-Term Growth
“Aon has a truly impressive track record of developing innovative solutions to help solve problems and create differentiated value
in response to specific client needs. Solid long-term operating performance, combined with expense discipline and strong cash
flow, continues to enable substantial investments that position the firm for long-term growth.”
Risk Solutions HR Solutions
Aon InPoint, which is the world’s leading global
repository of risk and insurance placement
information providing insight into $160 billion of
global premium flow
Aon Broking initiative to better match client needs
with insurer appetite for risk and to identify structured
portfolio or treaty solutions, such as Aon Client
Treaty
Further development of data and analytics capability
at Aon Benfield to strengthen our already industry-
leading value proposition and client serving
capability, such as ReView
Roll-out of the Revenue Engine internationally and
Aon Client Promise firm-wide to drive greater
retention and rollover rates
Expansion of content and global footprint through
tuck-in acquisitions that increase scale in emerging
markets or expand capability to better serve clients
Focusing on innovative solutions to de-risk pension
plans and support increasing needs for delegated
investment and defined-contribution solutions to
fulfill clients’ needs for effective execution of their
investment and retirement benefit strategies
Strengthening our industry-leading portfolio of
health solutions; including our suite of private health
care exchanges for active employees and retirees
enabling clients to transition their participants to a
market-based, defined contribution model for
healthcare, while addressing unsustainable
healthcare cost increases
Further development of our industry-leading
benefits and HR operations solutions and consumer
technology platforms, including extensive mobile
solutions and cloud-based outsourcing solutions
Expansion of our international footprint to support a
global workforce, with investments in key talent and
capabilities across emerging markets
7. 6
$392
$370
Net Income
EPS1 – Strong Underlying Performance Despite Continued Headwinds
($ millions) Q1’15 Q1’16
Net Income2 $392 $370
Y-o-Y change -6%
Earnings Per Share2 $1.37 $1.35
Y-o-Y change -1%
1 The results presented are non-GAAP measures that are reconciled in the appendix of this presentation.
2 Certain noteworthy items impacted net income and earnings per share in the first quarter of 2016 and 2015. A reconciliation of non-GAAP measures for
net income and diluted earnings per share to the corresponding U.S. GAAP measure is in Appendix B of this presentation.
$1.37 $1.35
EPS
Q1’15 Q1’16
“Our first quarter results reflect a solid start to the year as retail brokerage organic revenue increased
four percent, adjusted operating margin expanded 100 basis points in Risk Solutions, return on
invested capital improved through the disposition of a business in HR Solutions and we effectively
allocated capital highlighted by the repurchase of $750 million of Class A Ordinary shares.”
2 2
8. 7
Operating Margins1 – Strong Margin Improvement in Risk Solutions
Q1 Risk Solutions
Positive Impact
Organic revenue growth of 3%
Return on investments in data and
analytics across the portfolio
Favorable impact of +30 bps from changes
in foreign currency exchange rates
Negative Impact
Unfavorable FX impact of -$13 million
Q1’15 Q1’16
Risk Solutions
Operating Income2 $440 $453
Y-o-Y change +3%
Operating Margin2 23.2% 24.2%
Y-o-Y change +100 bps
HR Solutions
Operating Income2 $128 $110
Y-o-Y change -14%
Operating Margin2 13.2% 11.8%
Y-o-Y change -140 bps
Q1 HR Solutions
Positive Impact
Organic revenue growth of +2%
Expense discipline
Negative Impact
-$20 million, or -220 basis points, of
transaction and portfolio repositioning costs
Unfavorable FX impact of -$3 million
($ millions)
1 The results presented are non-GAAP measures that are reconciled in the appendix of this presentation.
2 Certain noteworthy items impacted operating income and operating margin in the first quarter of 2016 and 2015. A reconciliation of non-GAAP measures for
operating income and operating margin to the corresponding U.S. GAAP measure is in Appendix B of this presentation.
9. 8
Long-Term Operating Margin Targets & Primary Drivers
Risk Solutions Operating Margin1
HR Solutions Operating Margin1
16.6%
18.2%
18.7%
21.6%
22.4%
21.6% 21.7%
22.5% 22.9%
23.6%
26.0%
2006 2007 2008 2009 2010 2011 2012 2013 2014 2015 Target
Drivers Within Our Control:
1. Return on investments in data and analytics,
including Aon Broking and Aon InPoint initiatives
2. Continued rollout of Revenue Engine internationally
3. Expense discipline and optimization of global cost
structure, including IT and Real Estate costs
Upside Opportunity:
1. Increases in short-term interest rates
2. Improvements in global GDP or insurance pricing
5.8%
11.7%
14.9% 15.2% 15.3%
17.6% 16.6% 16.7% 17.1%
18.1%
22.0%
2006 2007 2008 2009 2010 2011 2012 2013 2014 2015 Target
Drivers Within Our Control:
1. Growth in the core business and return on
incremental investments, including health care
exchanges and investment consulting
2. Improvement in HR Business Process Outsourcing
3. Expense discipline and optimization of global cost
structure, including IT and Real Estate costs
1 The results presented represent non-GAAP measures. See Appendix C for a reconciliation of non-GAAP measures for operating margin to the corresponding
U.S. GAAP measure.
10. 9
Unallocated Expenses & Non-Operating Segment Financials
Q1’15 Q1’16
Quarterly
Guidance
Unallocated Expenses1 ($47) ($46) ($45)
Interest Income $3 $2 $3
Interest Expense ($65) ($69) ($72)
Other Income (Expense) $42 $18 -
Effective Tax Rate 19.1% 18.4% -
Minority interest ($13) ($12) ($9)
Actual common shares
outstanding at 3-31-16
N/A 264.8 -
Other income of $18 million primarily includes net
gains on the sale of certain businesses, partially offset
by net losses due to the unfavorable impact of
exchange rates on the remeasurement on monetary
assets and liabilities in non-functional currencies
Interest expense increased $4 million due to an
increase in total debt outstanding. Interest expense is
expected to increase to $72 million in Q2 due to the
overlap of notes placed in February and notes due in
May. The expected run rate is approximately $70
million per quarter thereafter
Effective tax rate was 18.4% compared to 19.1% in
the prior year quarter, due to the geographic
distribution of income and favorable discrete tax
adjustments
Actual common shares outstanding on March 31st
were 264.8 million, and there were approximately 5
million additional dilutive equivalents. The Company
repurchased 7.7 million ordinary shares for
approximately $750 million in the first quarter.
Estimated Q2’16 beginning dilutive share count is ~270
million subject to share price movement, share
issuance and share repurchase
($ millions)
1 Certain noteworthy items impacted earnings per share in the first quarter of 2016 and 2015. A reconciliation of non-GAAP measures for diluted earnings per
share to the corresponding U.S. GAAP measure is in Appendix B of this presentation.
11. 10
Q1 2015 Q1 2016
$298 $273
Solid Balance Sheet and Strong Free Cash Flow Generation
Dec 31,
2015
Mar 31,
2016
Cash $384 $465
Short-term
Investments
$356 $587
Total Debt $5,700 $6,597
Total Aon
Shareholders’
Equity
$6,106 $5,281
Debt to EBITDA 2.3x 2.7x
Balance Sheet
($ mil)
1 Free cash flow is defined as cash flow from operations less capital expenditures. This non-GAAP measure does not imply or represent a precise
calculation of residual cash flow available for discretionary expenditures. A reconciliation of free cash flow to the corresponding U.S. GAAP
measure can be found in Appendix A of this presentation.
Cash Flow from Operations
($ mil)
Free Cash Flow 1
($ mil)
Cash Flow Commentary:
Decline in cash flow from operations primarily reflects unfavorable timing of
certain tax related items impacting the first three months that we expect will
favorably impact the first six months of 2016, partially offset by working
capital improvements and a decline in cash paid for pension contributions
and restructuring
Free cash flow reflects a decline in cash flow from operations, partially offset
by a $10 million decrease in capital expenditures
Q1 reflects the seasonally weakest cash flow quarter due to annual incentive
compensation payouts. We are firmly on track to deliver double-digit free
cash flow growth for the full year 2016
Q1 2015 Q1 2016
$236
$221
12. 11
$290 $254 $244
$194
$150 $163
$28
$19 $12
2015 2016e 2017e
Capital Expenditures Pension Contributions Restructuring - Cash
Significantly Increasing Free Cash Flow1 Generation
Estimated Declining Required Uses of Cash ($ millions)
$512
$423 $419
1 Free cash flow is defined as cash flow from operations less capital expenditures. This non-GAAP measure does not imply or represent a precise calculation of residual
cash flow available for discretionary expenditures. A reconciliation of free cash flow to the corresponding U.S. GAAP measure can be found in Appendix A of this
presentation.
2 Estimate based on current actuarial assumptions and certain management estimates as of December 31, 2015 measurement date.
Free Cash Flow ($ millions)
$442
$696
$871
$1,265
$1,524 $1,556
$1,719
$2,400
2009 2010 2011 2012 2013 2014 2015 2017
Target
Key Drivers:
1. Operational improvement as the firm continues to
deliver growth and make progress towards its long-
term operating margin targets
2. Working capital improvements as the firm focuses
on closing the gap between receivables and
payables
3. Declining required uses of cash for pensions and
restructuring
4. Lower cash tax payments reflecting the lower
effective tax rate
Anticipated increase of more than $90
million annually to FCF from 2015 to 2017
2
13. 12
Summary – Continued Long-Term Value Creation
Positioned for sustainable long-term growth in both Risk Solutions and HR Solutions
Significant leverage to an improving global economy, interest rates and insurance pricing
Investing in colleagues and capabilities around the globe to better serve clients
Opportunity for long-term operating margin improvement with increased operating leverage in the business
Strong balance sheet with opportunity for additional leverage while maintaining current credit ratings
Positioned to significantly increase free cash flow generation going forward
Increased financial flexibility and effective capital allocation is expected to drive significant shareholder value