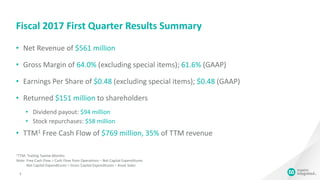
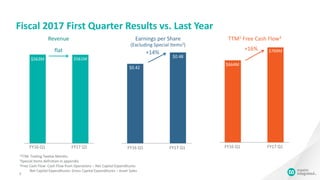
- In the first quarter of fiscal year 2017, the company reported net revenue of $561 million, gross margin of 64.0% excluding special items, and earnings per share of $0.48 excluding special items.
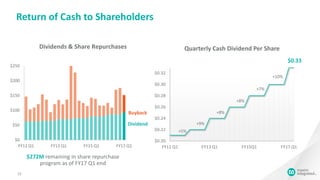
- The company returned $151 million to shareholders in the quarter through $94 million in dividends and $58 million in stock repurchases.
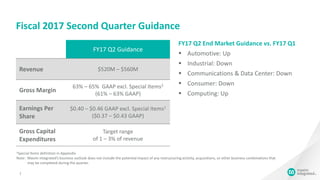
- For the second quarter of fiscal year 2017, the company expects revenue between $520-560 million and earnings per share between $0.40-0.46 excluding special items.
2. Safe Harbor
2
This presentation contains forward-looking statements within the meaning of Section 27A of the
Securities Act of 1933, as amended, and Section 21E of the Securities Exchange Act of 1934, as amended.
These forward-looking statements include, without limitation, the Company’s projections and statements
regarding revenue, gross margin, earnings per share, capital expenditures and other financial and business
metrics. These statements involve risks and uncertainties that could cause actual results to differ
materially from expectations. Please refer to the Company’s Annual Report on Form 10-K for the fiscal
year ended June 25, 2016 for a description of some of the risk factors that could cause actual results to
differ materially from such forward-looking statements.
All forward-looking statements included in this presentation are made as of the date hereof and based on
the information available to the Company as of the date hereof. The Company assumes no obligation to
update any forward-looking statement.
3. Fiscal 2017 First Quarter Results Summary
• Net Revenue of $561 million
• Gross Margin of 64.0% (excluding special items); 61.6% (GAAP)
• Earnings Per Share of $0.48 (excluding special items); $0.48 (GAAP)
• Returned $151 million to shareholders
• Dividend payout: $94 million
• Stock repurchases: $58 million
• TTM1 Free Cash Flow of $769 million, 35% of TTM revenue
3
1TTM: Trailing Twelve Months
Note: Free Cash Flow = Cash Flow from Operations – Net Capital Expenditures
Net Capital Expenditures = Gross Capital Expenditures – Asset Sales
5. $664M
$769M
Fiscal 2017 First Quarter Results vs. Last Year
5
$563M $561M
flat
FY16 Q1 FY17 Q1
Revenue
$0.42
$0.48
+14%
FY16 Q1 FY17 Q1
Earnings per Share
(Excluding Special Items2)
TTM1 Free Cash Flow3
1TTM: Trailing Twelve Months
2Special Items definition in appendix
3Free Cash Flow: Cash Flow from Operations – Net Capital Expenditures
Net Capital Expenditures: Gross Capital Expenditures – Asset Sales
FY16 Q1 FY17 Q1
+16%
6. Automotive Industrial Comms &
Data Center
Consumer Computing
+1%
FY16 Q1 vs. FY17 Q1 Revenue
-16%
-3%
-4%
Fiscal 2017 First Quarter Results by End Market
6
+16%
18%
26%
21%
31%
4%
FY17 Q1 Revenue: $561M
Consumer
Automotive
Industrial
Communications & Data Center
Computing
Note: Due to nature of our general purpose products, estimates by Major Markets are imprecise
7. Fiscal 2017 Second Quarter Guidance
FY17 Q2 Guidance
Revenue $520M – $560M
Gross Margin
63% – 65% GAAP excl. Special Items2
(61% – 63% GAAP)
Earnings Per
Share
$0.40 – $0.46 GAAP excl. Special Items1
($0.37 – $0.43 GAAP)
Gross Capital
Expenditures
Target range
of 1 – 3% of revenue
7
1Special Items definition in Appendix
Note: Maxim Integrated’s business outlook does not include the potential impact of any restructuring activity, acquisitions, or other business combinations that
may be completed during the quarter.
FY17 Q2 End Market Guidance vs. FY17 Q1
Automotive: Up
Industrial: Down
Communications & Data Center: Down
Consumer: Down
Computing: Up
9. 0%
10%
20%
30%
$0
$300
$600
$900
FY12
Q1
FY13
Q1
FY14
Q1
FY15
Q1
FY16
Q1
FY17
Q1
TTM1 Free Cash Flow
9
1TTM: Trailing Twelve Months
Note: Free Cash Flow: Cash from Operations – Net Capital Expenditures
Net Capital Expenditures: Gross Capital Expenditures – Asset Sales
FY17 Q1 Asset Sales included $24.5M of proceeds from the sale of securities related to the sale of a manufacturing facility in San Antonio, Texas
$M As % of Revenue
35%
11. Gross CapEx
Target:
1 to 3%
of Revenue
0%
2%
4%
6%
8%
10%
12%
14%
16%
FY12
Q1
FY13
Q1
FY14
Q1
FY15
Q1
FY16
Q1
FY17
Q1
Accelerated Depreciation
Depreciation
Gross Capital Expenditures
Capital Expenditures vs. Depreciation (excluding Special Items)
11
% of Revenue
Accelerated Depreciation
12. $0.20
$0.22
$0.24
$0.26
$0.28
$0.30
$0.32
FY11 Q1 FY13 Q1 FY15Q1 FY17 Q1
Quarterly Cash Dividend Per Share
12
$0
$50
$100
$150
$200
$250
FY11 Q1 FY13 Q1 FY15 Q1 FY17 Q1
Dividends & Share Repurchases
Dividend
Return of Cash to Shareholders
Buyback
+5%
+9%
+8%
+8%
$272M remaining in share repurchase
program as of FY17 Q1 end
$0.33
+7%
+10%
13.
14. 14
Appendix
2Special Items: intangible asset amortization; accelerated depreciation; acquisition-related inventory write-up; impairment of long-lived assets;
impairment of goodwill and intangible assets; severance and restructuring; acquisition-related costs; contingent consideration adjustments
relating to certain acquisitions; expected loss on rent expense for vacated office space; loss related to sale of land and buildings; impairment of
investments in privately-held companies; tax provision impacts due to fixed asset tax basis adjustment relating to prior year depreciation
expense.
15. Reconciliation of GAAP vs. GAAP Excluding Special Items (Unaudited)
15
September 24, June 25, September 26,
2016 2016 2015
Reconciliation of GAAP gross profit to GAAP gross profit excluding special items:
GAAP gross profit 345,732$ 347,027$ 286,351$
GAAP gross profit % 61.6% 61.3% 50.9%
Special items:
Intangible asset amortization 12,602 11,829 16,638
Accelerated depreciation (1) 1,178 4,098 43,631
Total special items 13,780 15,927 60,269
GAAP gross profit excluding special items 359,512$ 362,954$ 346,620$
GAAP gross profit % excluding special items 64.0% 64.1% 61.6%
Reconciliation of GAAP operating expenses to GAAP operating expenses excluding
special items:
GAAP operating expenses 173,659$ 224,654$ 362,116$
Special items:
Intangible asset amortization 2,443 2,538 3,591
Impairment of long-lived assets (2) 6,134 429 157,697
Impairment of intangible assets - 27,602 -
Severance and restructuring 9,965 4,149 7,126
Other operating expenses (income), net (3) (28,481) 4,962 315
Total special items (9,939) 39,680 168,729
GAAP operating expenses excluding special items 183,598$ 184,974$ 193,387$
Reconciliation of GAAP net income (loss) to GAAP net income excluding special
items:
GAAP net income (loss) 137,614$ 92,339$ (72,143)$
Special items:
Intangible asset amortization 15,045 14,367 20,229
Accelerated depreciation (1) 1,178 4,098 43,631
Impairment of long-lived assets (2) 6,134 429 157,697
Impairment of intangible assets - 27,602 -
Severance and restructuring 9,965 4,149 7,126
Other operating expenses (income), net (3) (28,481) 4,962 315
Interest and other expense (income), net (471) (247) (109)
Pre-taxtotal special items 3,370 55,360 228,889
Other income taxeffects and adjustments (4) (2,754) (7,228) (36,434)
GAAP net income excluding special items 138,230$ 140,471$ 120,312$
GAAP net income per share excluding special items:
Basic 0.49$ 0.49$ 0.42$
Diluted 0.48$ 0.49$ 0.42$
Shares used in the calculation of earnings per share excluding special items:
Basic 283,633 284,354 284,588
Diluted (5) 288,574 288,544 288,897
ANALYSIS OF GAAP VERSUS GAAP EXCLUDING SPECIAL ITEMS DISCLOSURES
(Unaudited)
(in thousands, except per share data)
Three Months Ended
(1) Includes building and equipment accelerated depreciation related to San Jose and Dallas manufacturing facilities.
Other income taxeffects and adjustments (4) (2,754) (7,228) (36,434)
GAAP net income excluding special items 138,230$ 140,471$ 120,312$
GAAP net income per share excluding special items:
Basic 0.49$ 0.49$ 0.42$
Diluted 0.48$ 0.49$ 0.42$
Shares used in the calculation of earnings per share excluding special items:
Basic 283,633 284,354 284,588
Diluted (5) 288,574 288,544 288,897
(2) Includes impairment of investments in privately-held companies and other equipment impairment charges.
(4) Includes taxeffect of pre-taxspecial items and miscellaneous taxadjustments.
(1) Includes building and equipment accelerated depreciation related to San Jose and Dallas manufacturing facilities.
(5) Shares used in diluted earnings per share excluding special items differs fromGAAP loss per share due to net income on a non-GAAP basis for the
first quarter of fiscal year 2016.
(3) Includes gain on sale of micro-electromechanical systems (MEMS) business line during the first quarter of fiscal year 2017.