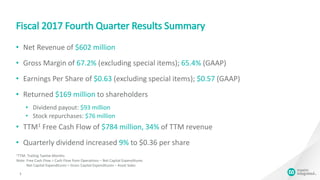
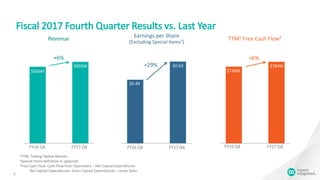
- Net revenue for the fourth quarter of fiscal 2017 was $602 million, an increase of 6% from the same quarter last year. Earnings per share excluding special items was $0.63, an increase of 29% from the previous year.
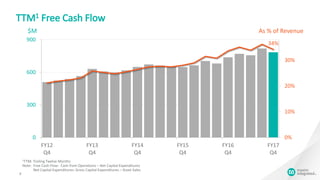
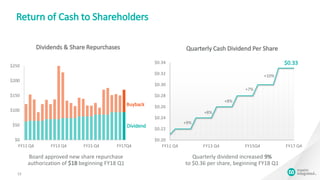
- The company returned $169 million to shareholders in the form of dividends ($93 million) and stock repurchases ($76 million). Trailing twelve month free cash flow was $784 million, or 34% of revenue.
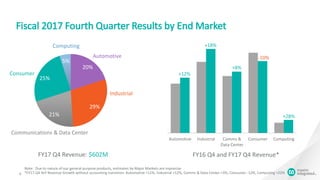
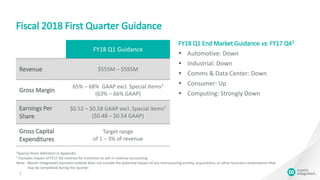
- Guidance for the first quarter of fiscal 2018 forecasts revenue between $555-595 million and earnings per share between $0.52-0.58 excluding special items. End market demand is expected to decline in automotive, industrial