1) The document provides an earnings presentation for 4Q16 and full year 2016 results for Masonite International Corporation. It highlights strong sales growth in North America and Europe, margin expansion, and progress on strategic initiatives.
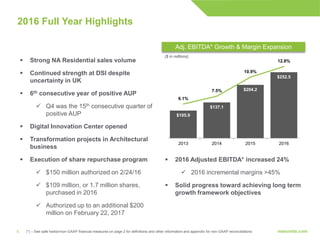
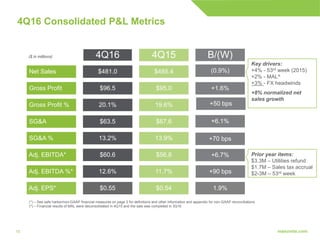
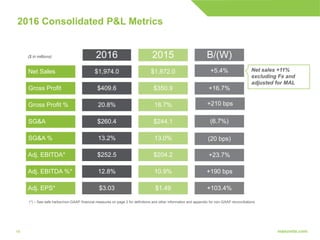
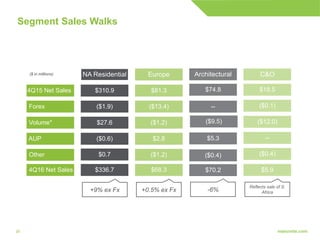
2) Financial results showed net sales growth of 5.4% in 2016, Adjusted EBITDA growth of 23.7%, and Adjusted EPS growth of over 100%.
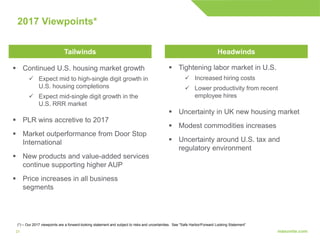
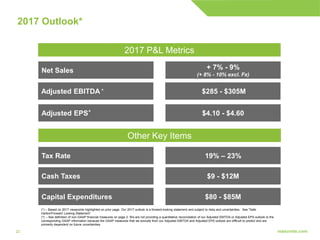
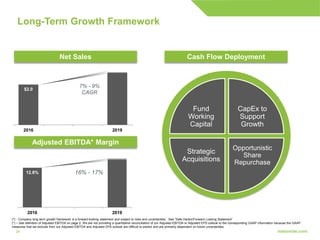
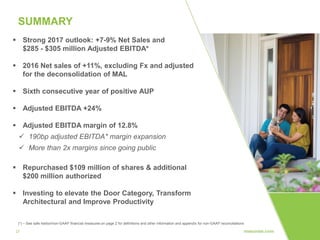
3) An outlook is provided for 2017 anticipating continued US housing market growth, sales growth of 7-9%, Adjusted EBITDA of $285-305 million, and Adjusted EPS of $4.10-$4.60.