This document describes establishing a lithology identification plate for the Putao Hua oil layer in the Pu Xi oilfield based on well logging data and core analysis. It first normalizes well logging curves to remove non-geological influences. It then establishes crossplots between logging parameters such as gamma ray, resistivity, and spontaneous potential to identify lithologies of siltstone, muddy siltstone, silty mudstone, and mudstone. Accuracy of identification is tested and lithology identification standards are established to accurately identify lithologies, an important step for oilfield exploration.
The significance of Surface Logging For The Formation Evaluation Advance Surf...Evangelos Siskos
The significance of Surface Logging For The Formation Evaluation Advance Surface Logging Technology is a Master of Science Thesis presentation for the MSc in Oil & Gas Technology program at Eastern Macedonia and thrace Institute of Technology.
International Journal of Engineering Research and Applications (IJERA) is an open access online peer reviewed international journal that publishes research and review articles in the fields of Computer Science, Neural Networks, Electrical Engineering, Software Engineering, Information Technology, Mechanical Engineering, Chemical Engineering, Plastic Engineering, Food Technology, Textile Engineering, Nano Technology & science, Power Electronics, Electronics & Communication Engineering, Computational mathematics, Image processing, Civil Engineering, Structural Engineering, Environmental Engineering, VLSI Testing & Low Power VLSI Design etc.
Particle Size Distribution & Classification of Soilwasim shaikh
According to the US classification standards, soil particles are divided into seven grades: clay particles <0.002 mm, silt particles 0.002–0.05 mm, very fine sand 0.05–0.1 mm, fine sand 0.1–0.25 mm, medium sand 0.25–0.5 mm, coarse sand 0.5–1.0 mm, and very coarse sand 1–2 mm.
This workshop covers the different ways of presenting grammar, both form and meaning, and provides ideas for controlled student practice. Teachers will understand the basic principles of conveying meaning and highlighting form through techniques such as timelines, concept checking and guided discovery. They will also discover how to select and stage practice according to the needs of their students and the importance of accuracy vs. fluency, as well as how to use techniques such as drilling and personalization to provide practice.
Well log analysis for reservoir characterization aapg wikiBRIKAT Abdelghani
Well log is one of the most fundamental methods for reservoir characterization, in oil and gas industry, it is an essential method for geoscientist to acquire more knowledge about the condition below the surface by using physical properties of rocks.
Effects of shale volume distribution on the elastic properties of reserviors ...DR. RICHMOND IDEOZU
Shale volume (Vsh) estimation has been carried out on three selected reservoirs (Nan.1, Nan.2, and Nan.4) distributed across four wells (01, 03, 06, and 12) in Nantin Field, using petrophysical analysis and reservoir modeling techniques with a view to understanding the reservoir elastic properties. Materials utilized for this research work include: Well Log data (Gamma Ray Log, Resistivity Log, Sonic Log, Density Log, Neutron porosity log), and a 3-D Seismic volume were used for the study. Sand and shale were the prevalent lithologies in Nantin Field. Nan. 1 reservoir was thickest in Nantin well 12 (29.7ft), Nantin 2 reservoir was thickest in Nantin Well 12 (30.9ft) while Nantin 4 reservoir was thickest in Well 3 (72ft). Correlation well panel across the Field showed that Nantin 4 reservoir, was thicker than Nan 1 and Nan 2 Reservoir respectively. Normal and synthetic Faults were also mapped, the trapping system in the field includes anticlines in association with fault closures. The thicknesses and lateral extents of these reservoirs were delineated into three zones (1, 2, and 3) which were modeled appropriately. Petrophysical and some elasticity parameters such as Poisson ratio (PR), Acoustic Impedance (AI), and Reflectivity Coefficient (RC) were evaluated for the wells. The results from elasticity evaluation showed a high Poisson Ratio of 0.40 in Nantin 2 reservoir of Well 12 based on high shale volume distribution of 0.70 indicating high stress level and possible boundary to hydraulic fracture. The lowest Poisson Ratio was evaluated in Nantin reservoir of Well 1 with lowest shale volume of 0.18 which indicates weak zones and may not constrain a fracturing job. Results from Acoustic impedance showed a high AI value of 7994.3 in Nan 2 Reservoir compared to Nan.1 which has the least AI value of 7447.3 because of low shale volume. A higher Reflectivity Coefficient of 0.01 was recorded in Nan.2 reservoir indicating bright spot while a lower RC of -0.00023 was recorded in Nan.4 Reservoir indicating dim spot. Hydrocarbon volume estimate of the three reservoirs showed 163mmstb in Nan.1 reservoir, 169mmstb, in Nantin 2 reservoir and 115mmstb in Nan. 4 Reservoir. The reservoirs encountered were faulted and laterally extensive. Nantin 2 reservoir was more prolific with a STOIIP of 169 mmstb compared to Nan. 1 with a STOIP of 163 mmstb and Nantin.4 with a STOIP of 115 mmstb, because of its good petrophysical values, facies quality and low shale volume distributions.
Reservoir Characterization of “G900” Sandstones Using Wireline Logs and Cores...iosrjce
Wireline logs and cores are analysed to evaluate the quality of reservoir “G900” of Gabo field as
insight for reservoir production optimization planning. “G900” have very good intergranular porosity and
excellent permeability with the main reservoir fluid content as oil and water. “G900” sands are cleaner
towards the North indicating relatively higher play potential. This clay rich subarkosic to arkosic sandstones is
rich in quartz and albite with grain size that is fine to coarse, dominantly poorly sorted, platykurtic to
mesokurtic with symmetrical to fine skewness.. It is a stacked interval of near shore deposits within deltaic
sequences that is rich in ripples and cross stratifications. Effective reservoir development plan of “G900” is
achieved by combining this result with seismic, well test, production data and other geological information to
reduce uncertainties, reveal “G900” lateral extent, compartmentalization, complexities, and fluid quantity for
improved production forecast.
Macro heterogeneity of high porosity and permeability reservoirin Bozhong 25-...iosrjce
IOSR Journal of Applied Geology and Geophysics (IOSR-JAGG) is a double blind peer reviewed International Journal that provides rapid publication (within a month) of articles in all areas of Applied Geology and Geophysics. The journal welcomes publications of high quality papers on theoretical developments and practical applications in Applied Geology and Geophysics. Original research papers, state-of-the-art reviews, and high quality technical notes are invited for publications.
Reserve Estimation of Initial Oil and Gas by using Volumetric Method in Mann ...ijtsrd
This research paper is focused to estimate the current production rate of the wells and to predict field remaining reserves. The remaining reserve depends on the production points that selected to represent the real well behavior, the way of dealing with the production data, and the human errors that might happen during the life of the field. Reserves estimating methods are usually categorized into three families analogy, volumetric, and performance techniques. Reserve Estimators should utilize the particular methods, and the number of methods, which in their professional judgment are most appropriate given i the geographic location, formation characteristics and nature of the property or group of properties with respect to which reserves are being estimated ii the amount and quality of available data and iii the significance of such property or group of properties in relation to the oil and gas properties with respect to which reserves are being estimated. In this research paper, the calculation of collecting data and sample by volumetric method are suggested to estimate the oil and gas production rate with time by using the geological configuration and the historical production data from CD 3700 3800 sand in Mann Oil Field. San Win "Reserve Estimation of Initial Oil and Gas by using Volumetric Method in Mann Oil Field" Published in International Journal of Trend in Scientific Research and Development (ijtsrd), ISSN: 2456-6470, Volume-3 | Issue-5 , August 2019, URL: https://www.ijtsrd.com/papers/ijtsrd27945.pdfPaper URL: https://www.ijtsrd.com/engineering/petroleum-engineering/27945/reserve-estimation-of-initial-oil-and-gas-by-using-volumetric-method-in-mann-oil-field/san-win
SPE 160891 Tar Characterization for Optimum Reservoir .docxrafbolet0
SPE 160891
Tar Characterization for Optimum Reservoir Management Strategy
Muhammad Al-Harthi, Mohammed Al-Ali, Ronny Gunarto/ Saudi Aramco
Copyright 2012, Society of Petroleum Engineers
This paper was prepared for presentation at the SPE Saudi Arabia Section Technical Symposium and Exhibition held in Al-Khobar, Saudi Arabia, 8–11 April 2012.
This paper was selected for presentation by an SPE program committee following review of information contained in an abstract submitted by the author(s). Contents of the paper
have not been reviewed by the Society of Petroleum Engineers and are subject to correction by the author(s). The material, as presented, does not necessarily reflect any position
of the Society of Petroleum Engineers, its officers, or members. Papers presented at the SPE meetings are subject to publication review by Editorial Committee of Society of
Petroleum Engineers. Electronic reproduction, distribution, or storage of any part of this paper without the written consent of the Society of Petroleum Engineers is prohibited.
Permission to reproduce in print is restricted to an abstract of not more than 300 words; illustrations may not be copied. The abstract must contain conspicuous acknowledgment of
where and whom the paper was presented. Write Librarian, SPE, P.O. Box 833836, Richardson, TX 75083-3836, U.S.A., fax 01-972-952-9435.
Abstract
Tar mats are extra-heavy bitumen that occur between
aquifers and overlaying oil columns. They seal either
partially or completely an oil reservoir from its
aquifer and reduces aquifer support. Tar
characterization includes evaluation of the tar
distribution and its sealing degree. It is an important
prerequisite to optimize the water injection well’s
requirement and placement to maximize sweep and
recovery.
This paper discusses a case study and demonstrates
an integrated methodology by using static and
dynamic data to determine the tar distribution and its
sealing degree. The study includes both early life data
before the subject field was put in production, as put
on production, and post-production data to refine the
characterization. Additionally, the use of formation
pressure while drilling and Pyrolytic Oil-Productivity
Index (POPI) analysis to optimize the injector’s
placement will also be highlighted. Moreover,
saturation and production logging tool analysis were
incorporated to determine if there is aquifer influx
across the tar mat. The degree of the aquifer influx is
also evaluated using material balance and reservoir
simulation.
Introduction
Field X is one of Saudi Aramco fields that was
developed with four producing reservoirs namely, 1,
2, 3 and 4 reservoirs. The producing reservoirs have
relatively good reservoir quality with average
permeability of 310 md. The value is only one-third
of average permeability from pressure build up which
indicates an existence of fractures. The reservoir
properties are relatively uniform.
Effect of fines on liquefaction using shake table testeSAT Journals
calamities resulting into considerable damages. One of the most detrimental
effects caused due to earthquake is liquefaction. This paper deals with experimental investigation of effects of fines content on
liquefaction behavior using shake table test. A test program consisted of total 19 tests conducted on saturated cohesionless sand
with varying amount of non-plastic silt. The behavior of such silty sand in the relative density range 30 to 60% has been studied
by subjecting the specimens to a specific acceleration of 0.54g. Effect of silt content and the relative density on generation of pore
pressure and thereby initiation of liquefaction has been studied. The results obtained from the present study showed that cyclic
stress ratio (CSR) values decrease with the increase in fines content for lower relative densities. Delay in development of pore
pressure is observed with the increasing fines content. This indicates that higher silt contents at higher densities offer better
resistance to liquefaction. Further, for lower densities and lesser silt contents liquefaction occurred at pore pressure ratio even
less than one. The trend observed for CSR and relative density is similar when compared with triaxial test reported in literature.
The points where liquefaction has occurred in the field, when checked in the present study, they lie in ‘YES’ zone of liquefaction.
Keywords: Relative Density, Cyclic Stress Ratio, Pore Pressure Ratio, Liquefaction Resistance, Initiation of
Liquefaction
Epistemic Interaction - tuning interfaces to provide information for AI supportAlan Dix
Paper presented at SYNERGY workshop at AVI 2024, Genoa, Italy. 3rd June 2024
https://alandix.com/academic/papers/synergy2024-epistemic/
As machine learning integrates deeper into human-computer interactions, the concept of epistemic interaction emerges, aiming to refine these interactions to enhance system adaptability. This approach encourages minor, intentional adjustments in user behaviour to enrich the data available for system learning. This paper introduces epistemic interaction within the context of human-system communication, illustrating how deliberate interaction design can improve system understanding and adaptation. Through concrete examples, we demonstrate the potential of epistemic interaction to significantly advance human-computer interaction by leveraging intuitive human communication strategies to inform system design and functionality, offering a novel pathway for enriching user-system engagements.
Encryption in Microsoft 365 - ExpertsLive Netherlands 2024Albert Hoitingh
In this session I delve into the encryption technology used in Microsoft 365 and Microsoft Purview. Including the concepts of Customer Key and Double Key Encryption.
Builder.ai Founder Sachin Dev Duggal's Strategic Approach to Create an Innova...Ramesh Iyer
In today's fast-changing business world, Companies that adapt and embrace new ideas often need help to keep up with the competition. However, fostering a culture of innovation takes much work. It takes vision, leadership and willingness to take risks in the right proportion. Sachin Dev Duggal, co-founder of Builder.ai, has perfected the art of this balance, creating a company culture where creativity and growth are nurtured at each stage.
Elevating Tactical DDD Patterns Through Object CalisthenicsDorra BARTAGUIZ
After immersing yourself in the blue book and its red counterpart, attending DDD-focused conferences, and applying tactical patterns, you're left with a crucial question: How do I ensure my design is effective? Tactical patterns within Domain-Driven Design (DDD) serve as guiding principles for creating clear and manageable domain models. However, achieving success with these patterns requires additional guidance. Interestingly, we've observed that a set of constraints initially designed for training purposes remarkably aligns with effective pattern implementation, offering a more ‘mechanical’ approach. Let's explore together how Object Calisthenics can elevate the design of your tactical DDD patterns, offering concrete help for those venturing into DDD for the first time!
Smart TV Buyer Insights Survey 2024 by 91mobiles.pdf91mobiles
91mobiles recently conducted a Smart TV Buyer Insights Survey in which we asked over 3,000 respondents about the TV they own, aspects they look at on a new TV, and their TV buying preferences.
Accelerate your Kubernetes clusters with Varnish CachingThijs Feryn
A presentation about the usage and availability of Varnish on Kubernetes. This talk explores the capabilities of Varnish caching and shows how to use the Varnish Helm chart to deploy it to Kubernetes.
This presentation was delivered at K8SUG Singapore. See https://feryn.eu/presentations/accelerate-your-kubernetes-clusters-with-varnish-caching-k8sug-singapore-28-2024 for more details.
LF Energy Webinar: Electrical Grid Modelling and Simulation Through PowSyBl -...DanBrown980551
Do you want to learn how to model and simulate an electrical network from scratch in under an hour?
Then welcome to this PowSyBl workshop, hosted by Rte, the French Transmission System Operator (TSO)!
During the webinar, you will discover the PowSyBl ecosystem as well as handle and study an electrical network through an interactive Python notebook.
PowSyBl is an open source project hosted by LF Energy, which offers a comprehensive set of features for electrical grid modelling and simulation. Among other advanced features, PowSyBl provides:
- A fully editable and extendable library for grid component modelling;
- Visualization tools to display your network;
- Grid simulation tools, such as power flows, security analyses (with or without remedial actions) and sensitivity analyses;
The framework is mostly written in Java, with a Python binding so that Python developers can access PowSyBl functionalities as well.
What you will learn during the webinar:
- For beginners: discover PowSyBl's functionalities through a quick general presentation and the notebook, without needing any expert coding skills;
- For advanced developers: master the skills to efficiently apply PowSyBl functionalities to your real-world scenarios.
Generative AI Deep Dive: Advancing from Proof of Concept to ProductionAggregage
Join Maher Hanafi, VP of Engineering at Betterworks, in this new session where he'll share a practical framework to transform Gen AI prototypes into impactful products! He'll delve into the complexities of data collection and management, model selection and optimization, and ensuring security, scalability, and responsible use.
Observability Concepts EVERY Developer Should Know -- DeveloperWeek Europe.pdfPaige Cruz
Monitoring and observability aren’t traditionally found in software curriculums and many of us cobble this knowledge together from whatever vendor or ecosystem we were first introduced to and whatever is a part of your current company’s observability stack.
While the dev and ops silo continues to crumble….many organizations still relegate monitoring & observability as the purview of ops, infra and SRE teams. This is a mistake - achieving a highly observable system requires collaboration up and down the stack.
I, a former op, would like to extend an invitation to all application developers to join the observability party will share these foundational concepts to build on:
SAP Sapphire 2024 - ASUG301 building better apps with SAP Fiori.pdfPeter Spielvogel
Building better applications for business users with SAP Fiori.
• What is SAP Fiori and why it matters to you
• How a better user experience drives measurable business benefits
• How to get started with SAP Fiori today
• How SAP Fiori elements accelerates application development
• How SAP Build Code includes SAP Fiori tools and other generative artificial intelligence capabilities
• How SAP Fiori paves the way for using AI in SAP apps
Dev Dives: Train smarter, not harder – active learning and UiPath LLMs for do...UiPathCommunity
💥 Speed, accuracy, and scaling – discover the superpowers of GenAI in action with UiPath Document Understanding and Communications Mining™:
See how to accelerate model training and optimize model performance with active learning
Learn about the latest enhancements to out-of-the-box document processing – with little to no training required
Get an exclusive demo of the new family of UiPath LLMs – GenAI models specialized for processing different types of documents and messages
This is a hands-on session specifically designed for automation developers and AI enthusiasts seeking to enhance their knowledge in leveraging the latest intelligent document processing capabilities offered by UiPath.
Speakers:
👨🏫 Andras Palfi, Senior Product Manager, UiPath
👩🏫 Lenka Dulovicova, Product Program Manager, UiPath
Dev Dives: Train smarter, not harder – active learning and UiPath LLMs for do...
E05823437
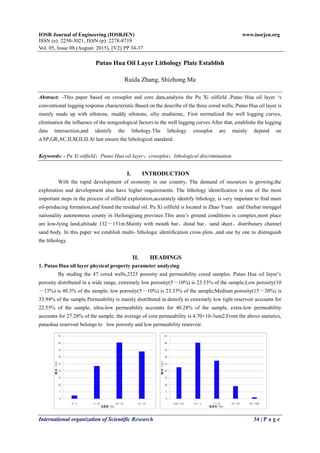
1. IOSR Journal of Engineering (IOSRJEN) www.iosrjen.org
ISSN (e): 2250-3021, ISSN (p): 2278-8719
Vol. 05, Issue 08 (August. 2015), ||V2|| PP 34-37
International organization of Scientific Research 34 | P a g e
Putao Hua Oil Layer Lithology Plate Establish
Ruida Zhang, Shizhong Ma
Abstract: -This paper based on crossplot and core data,analysis the Pu Xi oilfield ,Putao Hua oil layer ‘s
conventional logging response characteristic.Based on the describe of the three cored wells, Putao Hua oil layer is
mainly made up with siltstone, muddy siltstone, silty mudstone,. First normalized the well logging curves,
elimination the influence of the nongeological factors to the well logging curves.After that, establishe the logging
data intersection,and identify the lithology.The lithology crossplot are mainly depand on
△SP,GR,AC,ILM,ILD.At last ensure the lithological standard.
Keywords: - Pu Xi oilfield;Putao Hua oil layer;crossplot;lithological discrimination.
I. INTRODUCTION
With the rapid development of economy in our country, The demand of resources is growing,the
exploration and development also have higher requirements. The lithology identification is one of the most
important steps in the process of oilfield exploration,accurately identify lithology, is very impotant to find main
oil-producing formation,and found the residual oil. Pu Xi oilfield is located in Zhao Yuan and Durbat monggol
nationality autonomous county in Heilongjiang province.This area’s ground conditions is complex,most place
are low-lying land,altitude 132~151m.Mainly with mouth bar、distal bar、sand sheet、distributary channel
sand body. In this paper we establish multi- lithologic identification cross plots ,and one by one to distinguish
the lithology.
II. HEADINGS
1. Putao Hua oil layer physical property parameter analyzing
By studing the 47 cored wells,2325 porosity and permeability cored samples. Putao Hua oil layer’s
porosity distributed in a wide range, extremely low porosity(5~10%) is 23.53% of the sample;Low porosity(10
~15%) is 40.3% of the sample; low porosity(5~10%) is 23.53% of the sample;Medium porosity(15~20%) is
33.94% of the sample.Permeability is mainly distributed in densify to extremely low tight reservoir accounts for
22.55% of the sample, ultra-low permeability accounts for 40.28% of the sample, extra-low permeability
accounts for 27.28% of the sample, the average of core permeability is 4.70×10⁻³um2.From the above statistics,
putaohua reservoir belongs to low porosity and low permeability reservoir.
2. Putao Hua Oil Layer Lithology Plate Establish
International organization of Scientific Research 35 | P a g e
Fig.1 Putao Hua oil layer porosity histogram Fig.2 Putao Hua oil layer permeability histogram
III. NORMALIZATION OF GEOPHYSICAL LOGGING
The Normalization of geophysical logging is most important step to complete before the well logging
interpretation. Due to the different years of logging,the difference of logging instrumentation,and some of the
artificial impact. These will have a certain influence on logging curves,and affect the accuracy of the
interpretation result.Standardization of well logging curve can eliminate the influence of the area of geological
factors on the well logging curve.
Before to standardize, we select the P111-2 to be the standard layer, this layer is widely distributed in
the scope, stability sedimentation,With the same logging response to the stability of the mudstone laye.First of
all to drift the baseline of the SP curve.Set natural potential value of the mudstone to zero,Calculate the average
of index bed interval transit time ,Using the trend surface method of acoustic moveout correction,Fig3 and Fig4
are before and after the correction of acoustic travel time distribution trend diagram.
Fig.3 before correction Fig.4 after correction
IV. PUTAO HUA OIL LAYER LITHOLOGIC DISCRIMINATION PLATE
ESTABLISHION
Putaohua reservoir belongs to the subaqueous deposit,Contains a lot of calcitic cementatio、 nablock
and oiliness difference,These factors will have larger influence on logging response. In this paper preferred
the AC, GR, △SP, and ILM、ILD curve to set up lithologic identification plate. First , according to the
data, readout the typical data of Cored Wells , readout the thickness of relatively large silt rock and argillaceous
siltstone, silty mudstone, mudstone values.Should pay attention to when reading a value, to read each paragraph
lithology relatively well site average,This method of reading values can reflect the each of the lithologic
features, eliminate the error caused by the limit of the l ogging instrument measuring resolution,And it can
eliminate the influence of strata to read values on both ends.
3.1 Siltstone, muddy siltstone and silty mudstone, mudstone identification plate
The putaohua reservoir oil-water are distributed complex,There are a lot of nablock, calcitic
cementation and mud interlayer,These factors have a great influence on electric resistance,In order to eliminate
the influence of electric resistance to lithologic interpretation,This paper uses SP and AC curve to set up the
cross plot ,This method can eliminate the influence of factors such as fluid,calcium can also be identified(Fig.5).
3. Putao Hua Oil Layer Lithology Plate Establish
International organization of Scientific Research 36 | P a g e
Fig.5 Identify the sandstone and mudstone cross plot
(SDT+1.76*GR)<454.4 for siltstone and muddy siltstone, (SDT+ 1.76 * GR) > 454.4 formudstone
and silty mudstone. For more than 95% accuracy,To achieve the requirements of oilfield production,Next to
distinguish number 1 area of siltstone and argillaceous siltstoue, number 2area of silty mudstone and mudstone.
3.2 Identification of siltstone and muddy siltstone plate
Through the analysis of the physical nature of siltstone and muddy siltstone characteristics and logging
response characteristics,we will found that because of the muddy siltstone contained in mud, this lead to the
muddy siltstone’s GR value is higher than that of the siltstone’s GR value,and because of the effect of mud, the
permeability of argillaceous siltstone worse than siltstone,By comparing several reaction permeability curve, the
magnitude difference of induction resistivity is obvious, using natural gamma and (ILM-ILD) build the siltstone
and muddy siltstone lithologic identification plate(Fig.6).
Fig.6 Identification of siltstone and argillaceous siltstone chart
The chart can distinguish the siltstone and argillaceous siltstone, (ILM - ILD) > 0.32 * GR - 26.7 for
siltstone; (ILM - ILD) < 0.32 * GR - 26.7, which is muddy siltstone. Misinterpret as sample points of
argillaceous siltstone 3 accounted for 6.4% of the total sample, coincidence rate reaches 94%.
1
2
4. Putao Hua Oil Layer Lithology Plate Establish
International organization of Scientific Research 37 | P a g e
3.3 Silty mudstone and Mudstone Identification plate
Before identificate silty mudstone and mudstone,we should analyze the difference between them.
Through analyzing , because of the silty mudstone have less radioactive substances and mudstone,lead to the
silty mudstone’s permeability is higher to the mudstone.Use the △SP and induction resistivity to identify the
silty mudstone and mudstone(Fig.7).
Fig.7 Silty mudstone and Mudstone Identification plate
When 2.2-(ILM-ILD)<△SP and △SP<((ILM-ILD)-0.05)/0.025 for silty mudstone.
V. CONCLUSION
This paper based on 3 pressure coring wells,15 zones and 133 data points.Made the GR-AC、
GR-(ILM-ILD)、△SP-(ILM-ILD) cross plots,and to test them.We have these following conclusions.
1)Use the GR-AC cross plot to identificate the siltstone、muddy siltstone、silty mudstone、mudstone. When
(AC+1.76*GR)<454.4 are siltstone and muddy siltstone and(AC+1.76*GR)>454.4 are silty mudstone and
mudstone.
2)After identificate the siltstone、muddy siltstone and the silty mudstone、mudstone.Use the GR-(ILM-ILD)
cross plot to identificate the siltstone and muddy siltstone. When(ILM-ILD)>0.32*GR-26.7 is siltstone.When
(ILM-ILD)<0.32*GR-26.7 is muddy siltstone.
3 ) Use the △SP-(ILM-ILD) cross plot to identificate the silty mudstone and mudstone.When
(ILM-ILD)<0.014*GR-1.23 is silty mudstone;When (ILM-ILD)>0.014*GR-1.23 is mudstone.
REFERENCES
[1] Chang D,Liu J L,et al.Technique and development of litihology identification.Inner Mongolia
Petrochemical Industry (in Chinese),2009,(6):69-70.
[2] Ye H M,Fu W S,Wu J.Reservoir parameter interpretation model study of mature oilfield with multi-target
stratum.Science and Technology Review(in Chinese),2010,28(9):52-58.
[3] Ma Z.Petroleum Logging Geology (in Chinese).Wuhan:China University of Geosciences
Press,1994:37-38.
[4] Song Y J,Hu Y S .Geophysical Data Comprehensive and Interpretation (in Chinese).Daqing:Daqing
Petroleum Institute,2005:124-135.
[5] Wang X M.The Principle of Applied Geopgysics(in Chinese).Beijing:Petroleun Industry Press,2000.
[6] Yan L,Pan B Z,Chen Y K,et al,Log recognition and integrated evaluation of volcanic gas bearing
reservoirs in Dongling Area,Songliao Basin.Geophysical & Geochenical Exploration(in
Chinese),2008,132(6):656-660.