Download to read offline

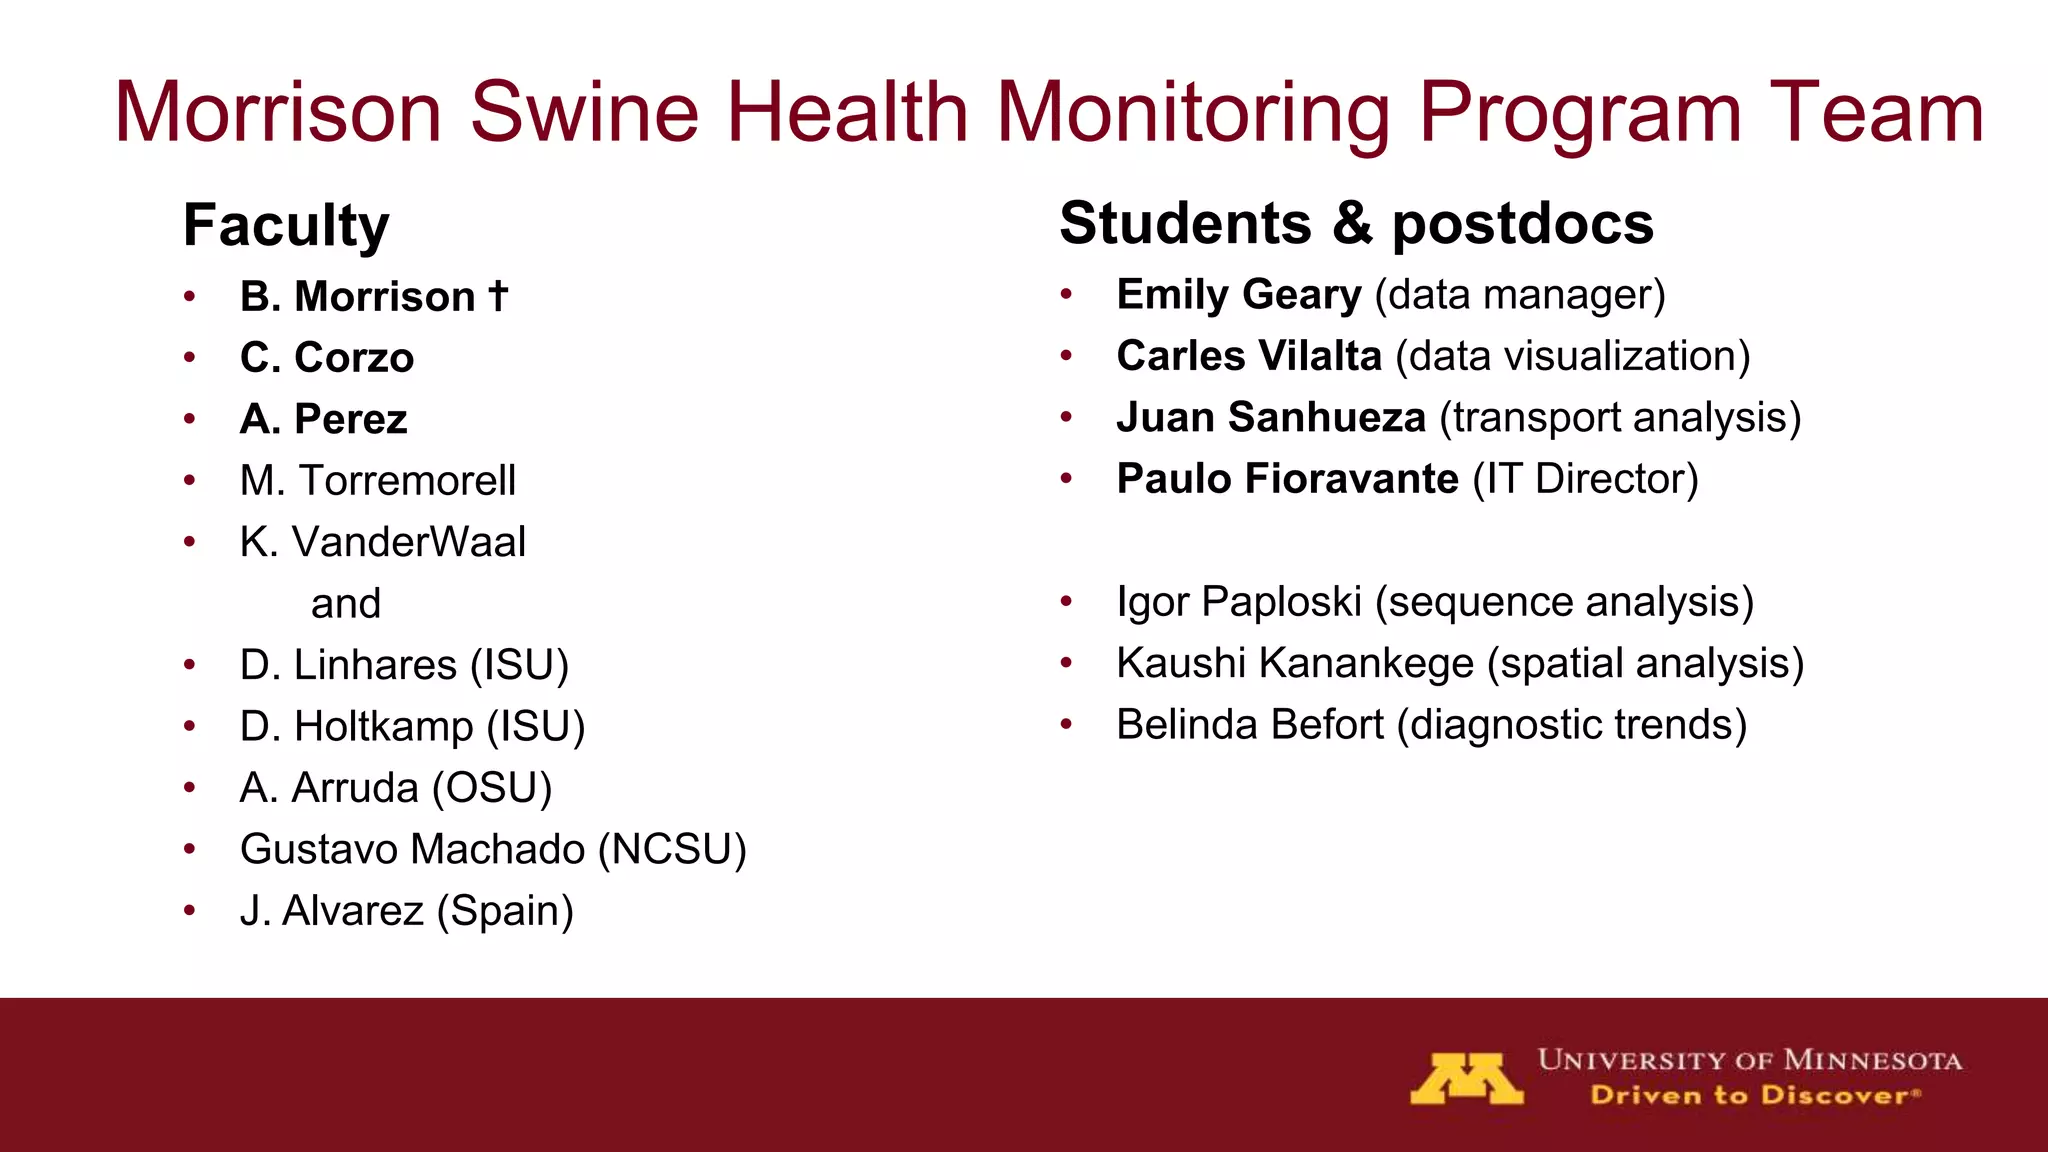
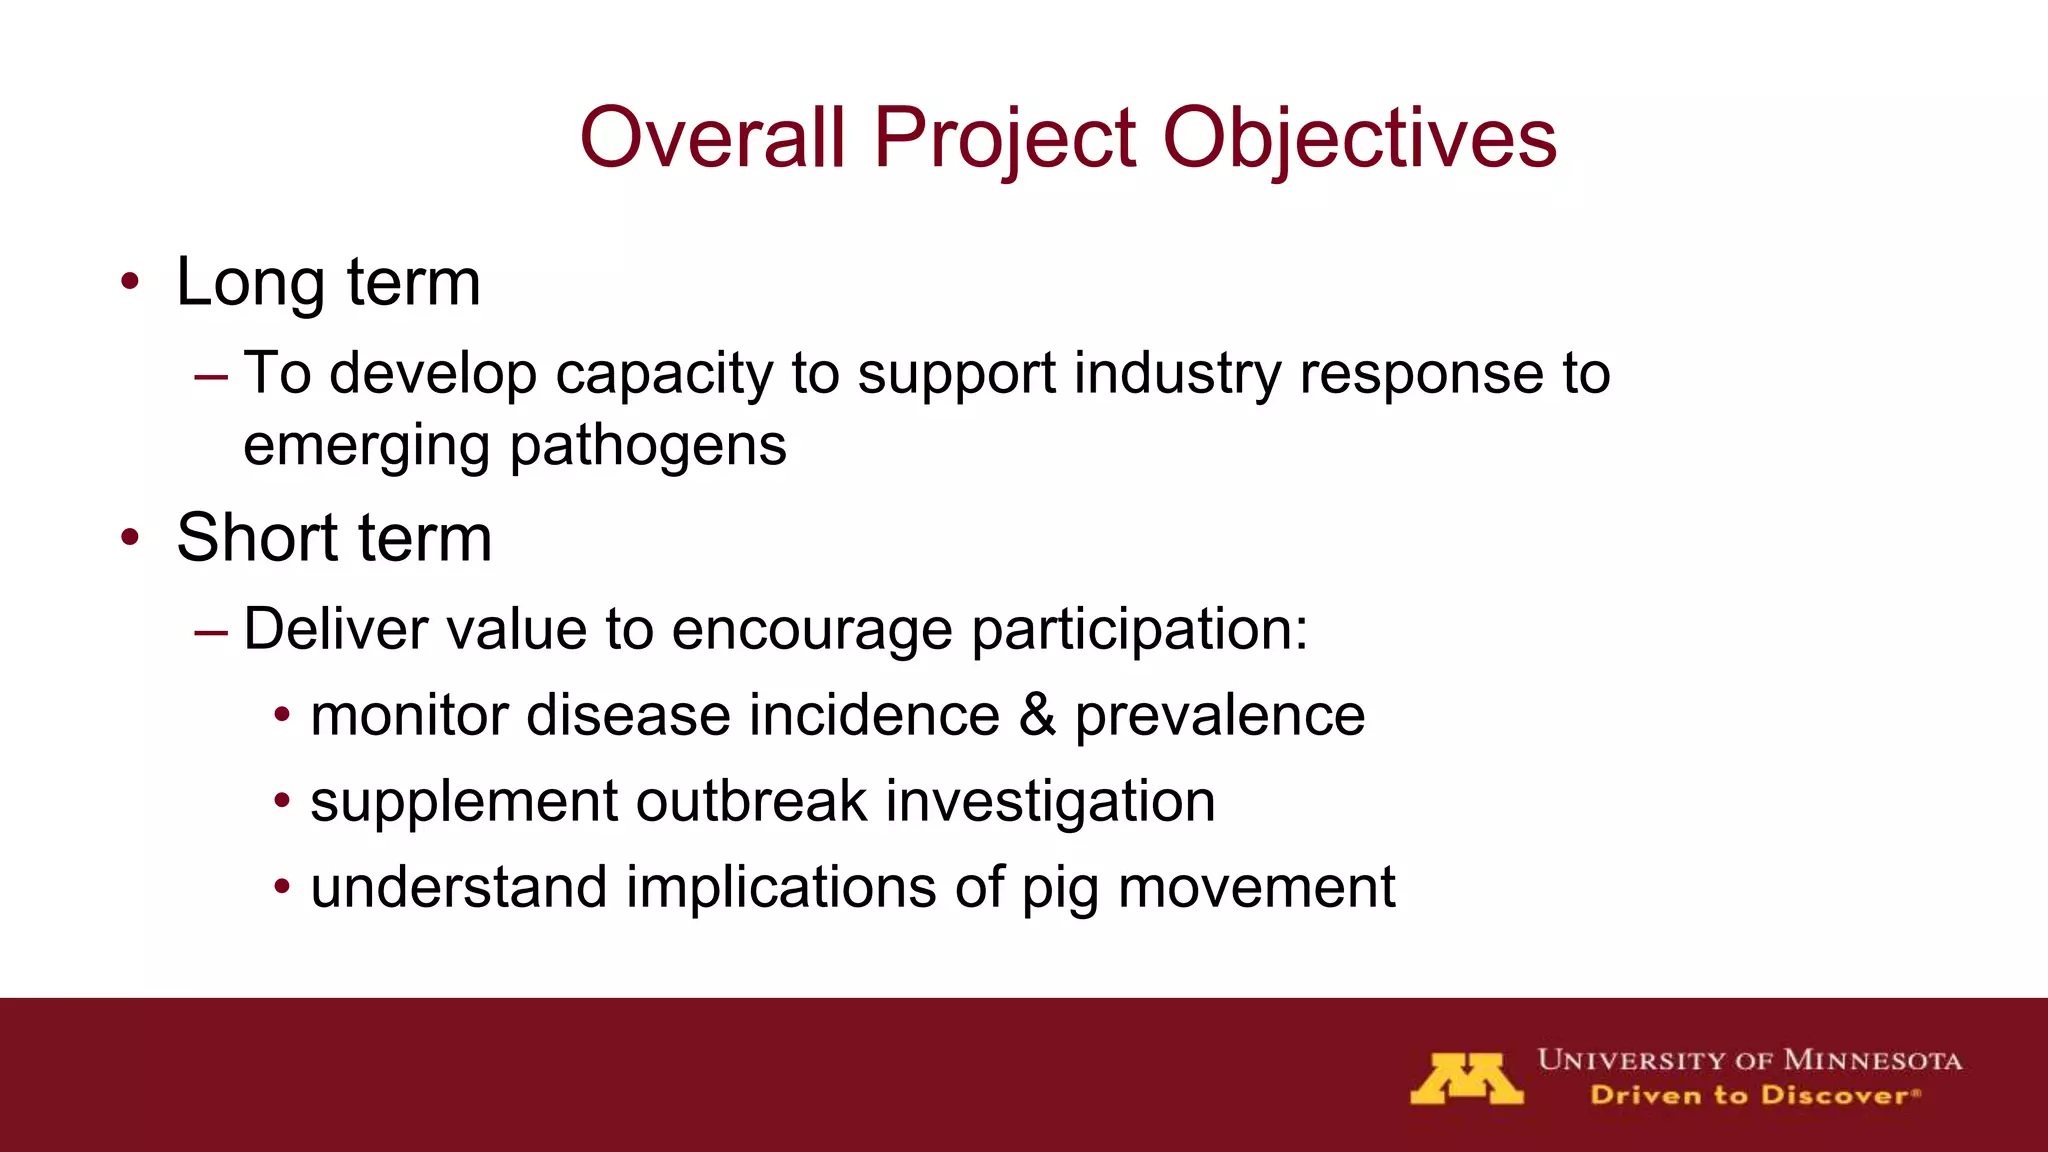
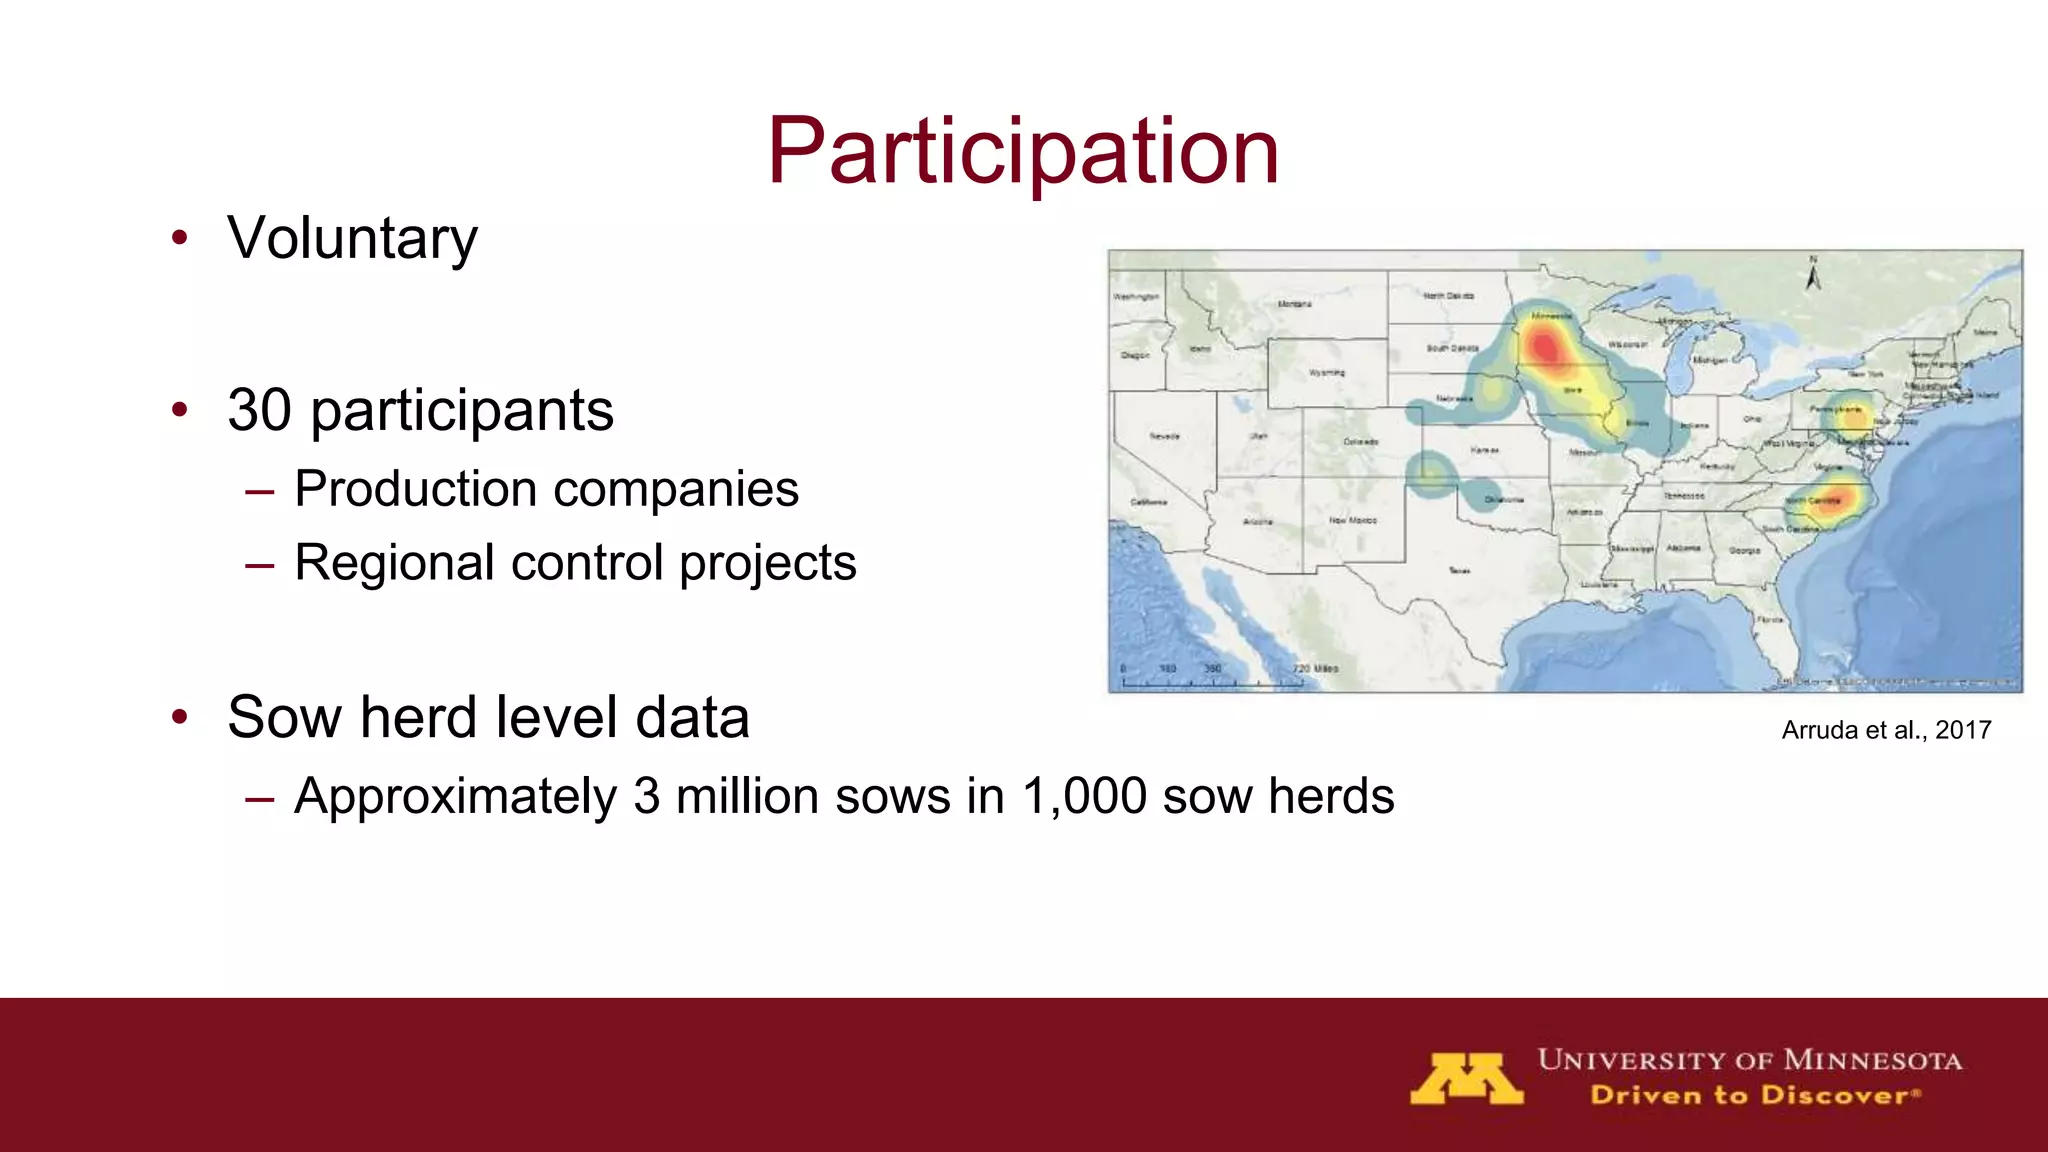
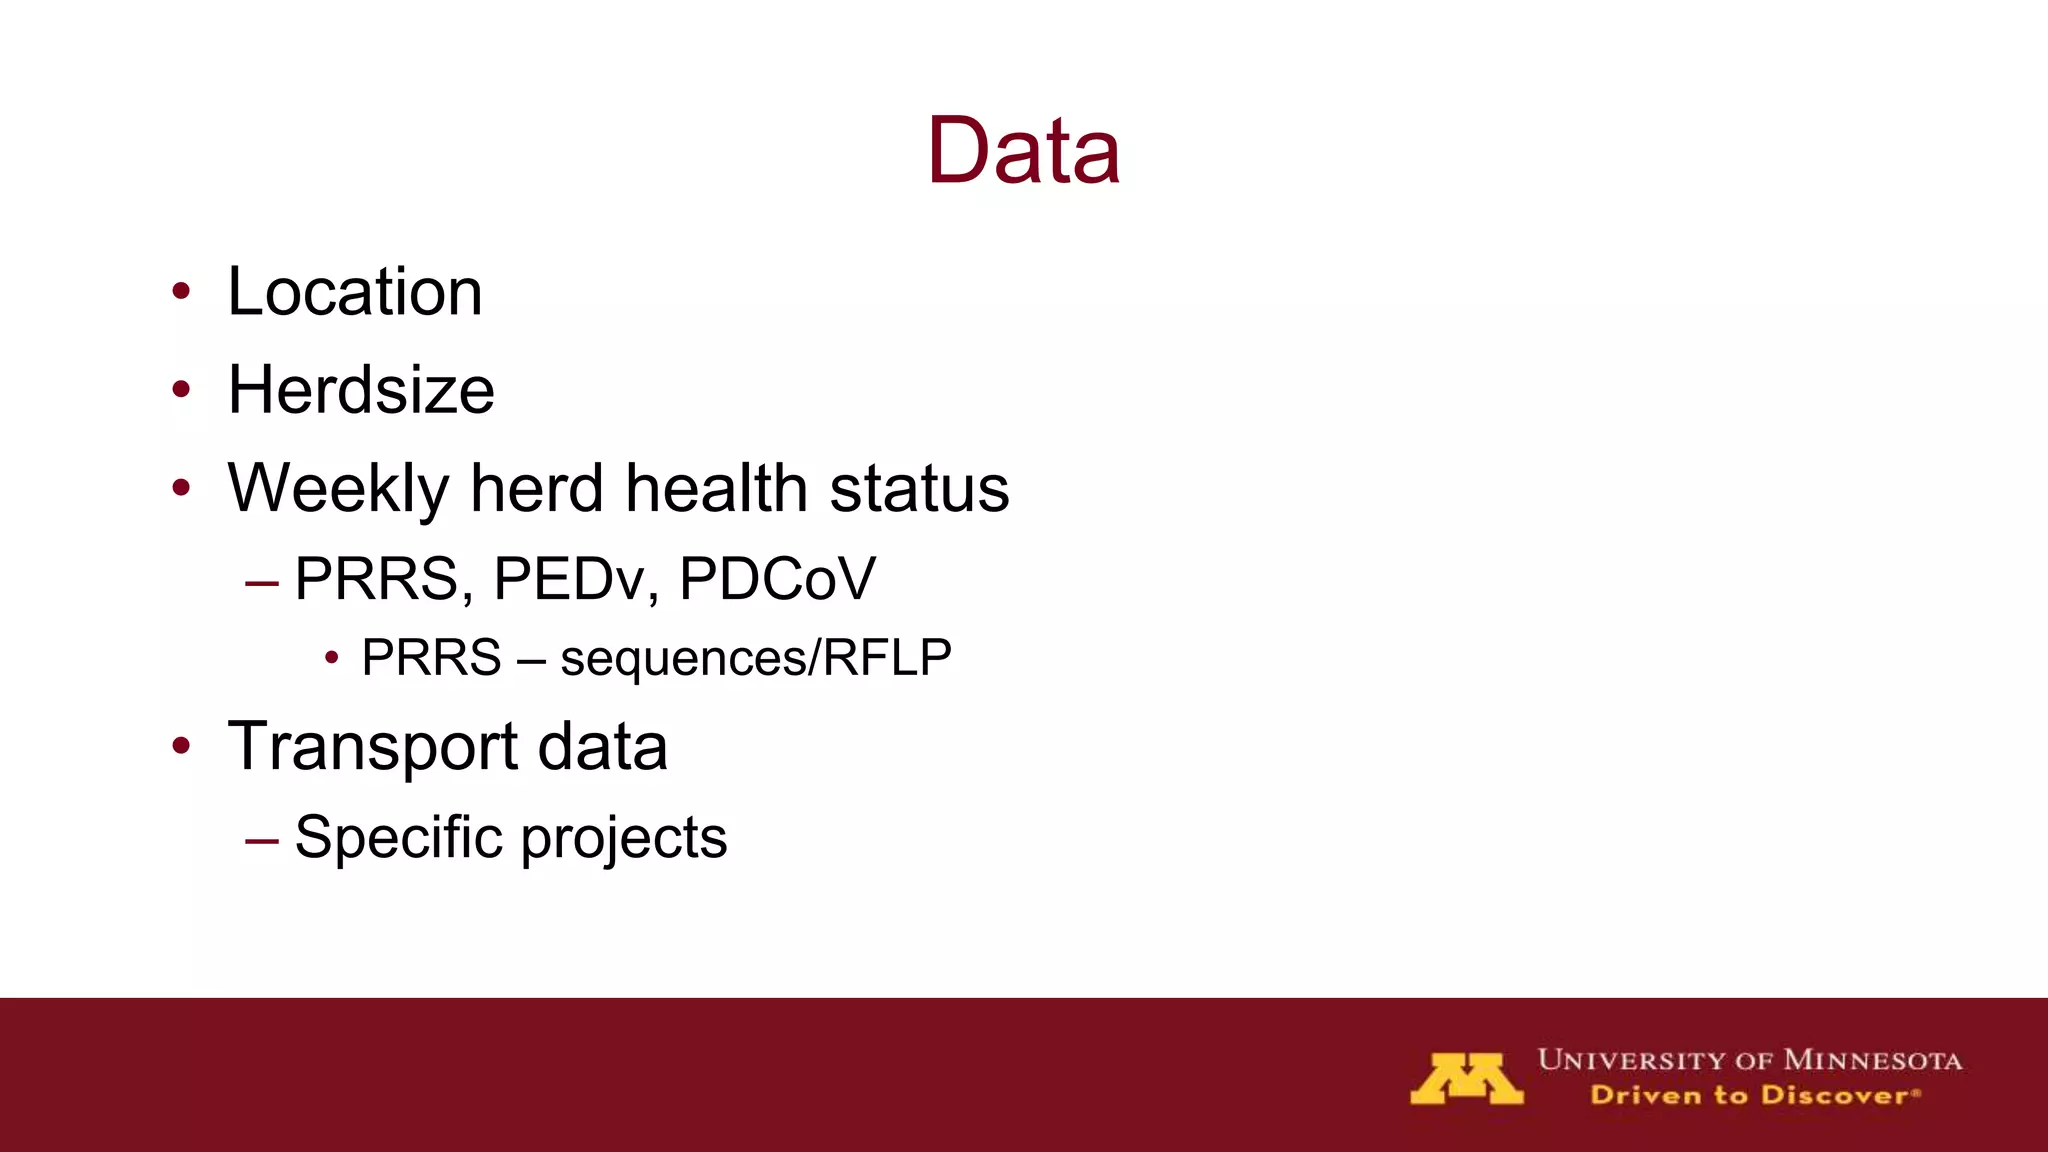

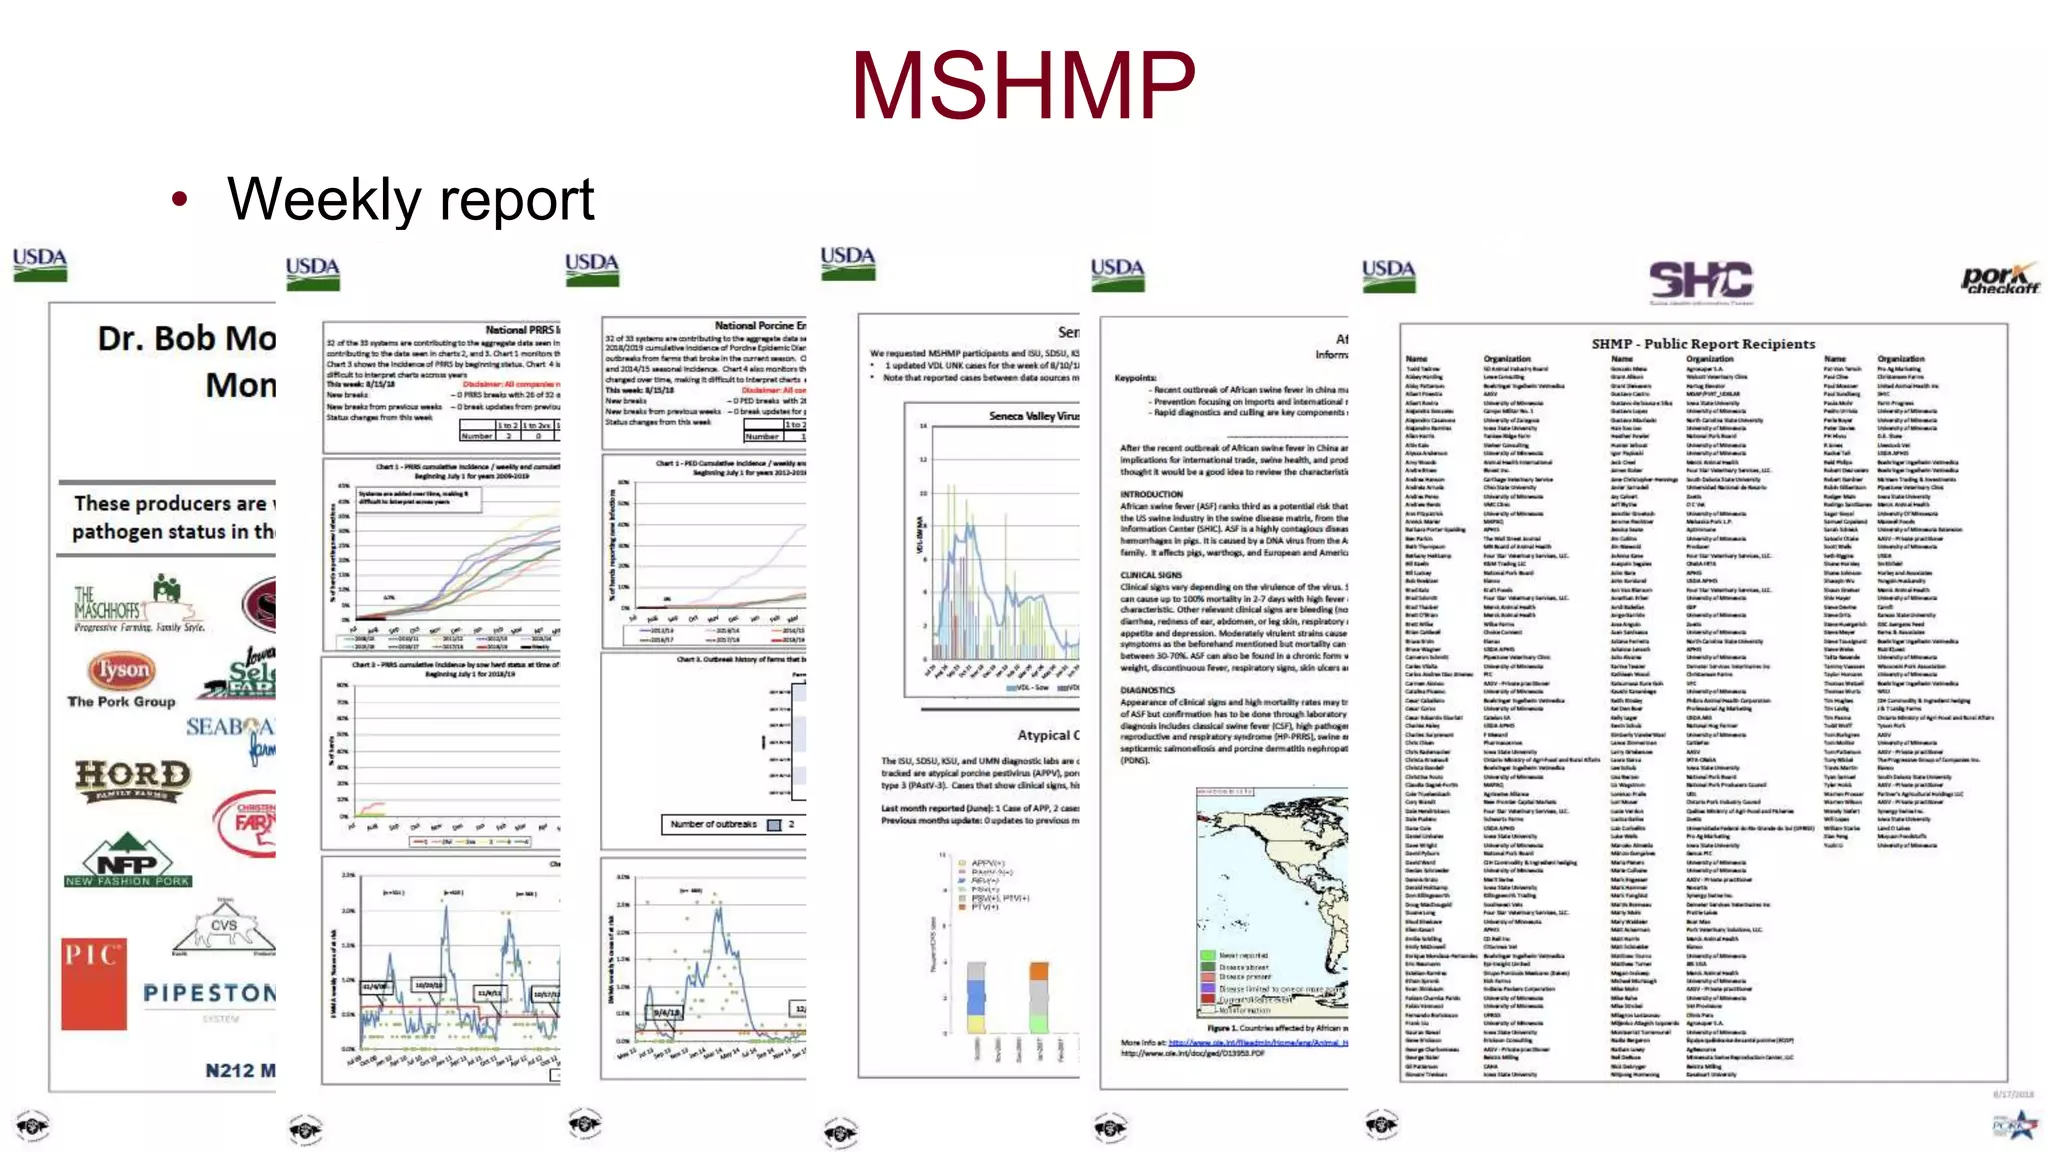
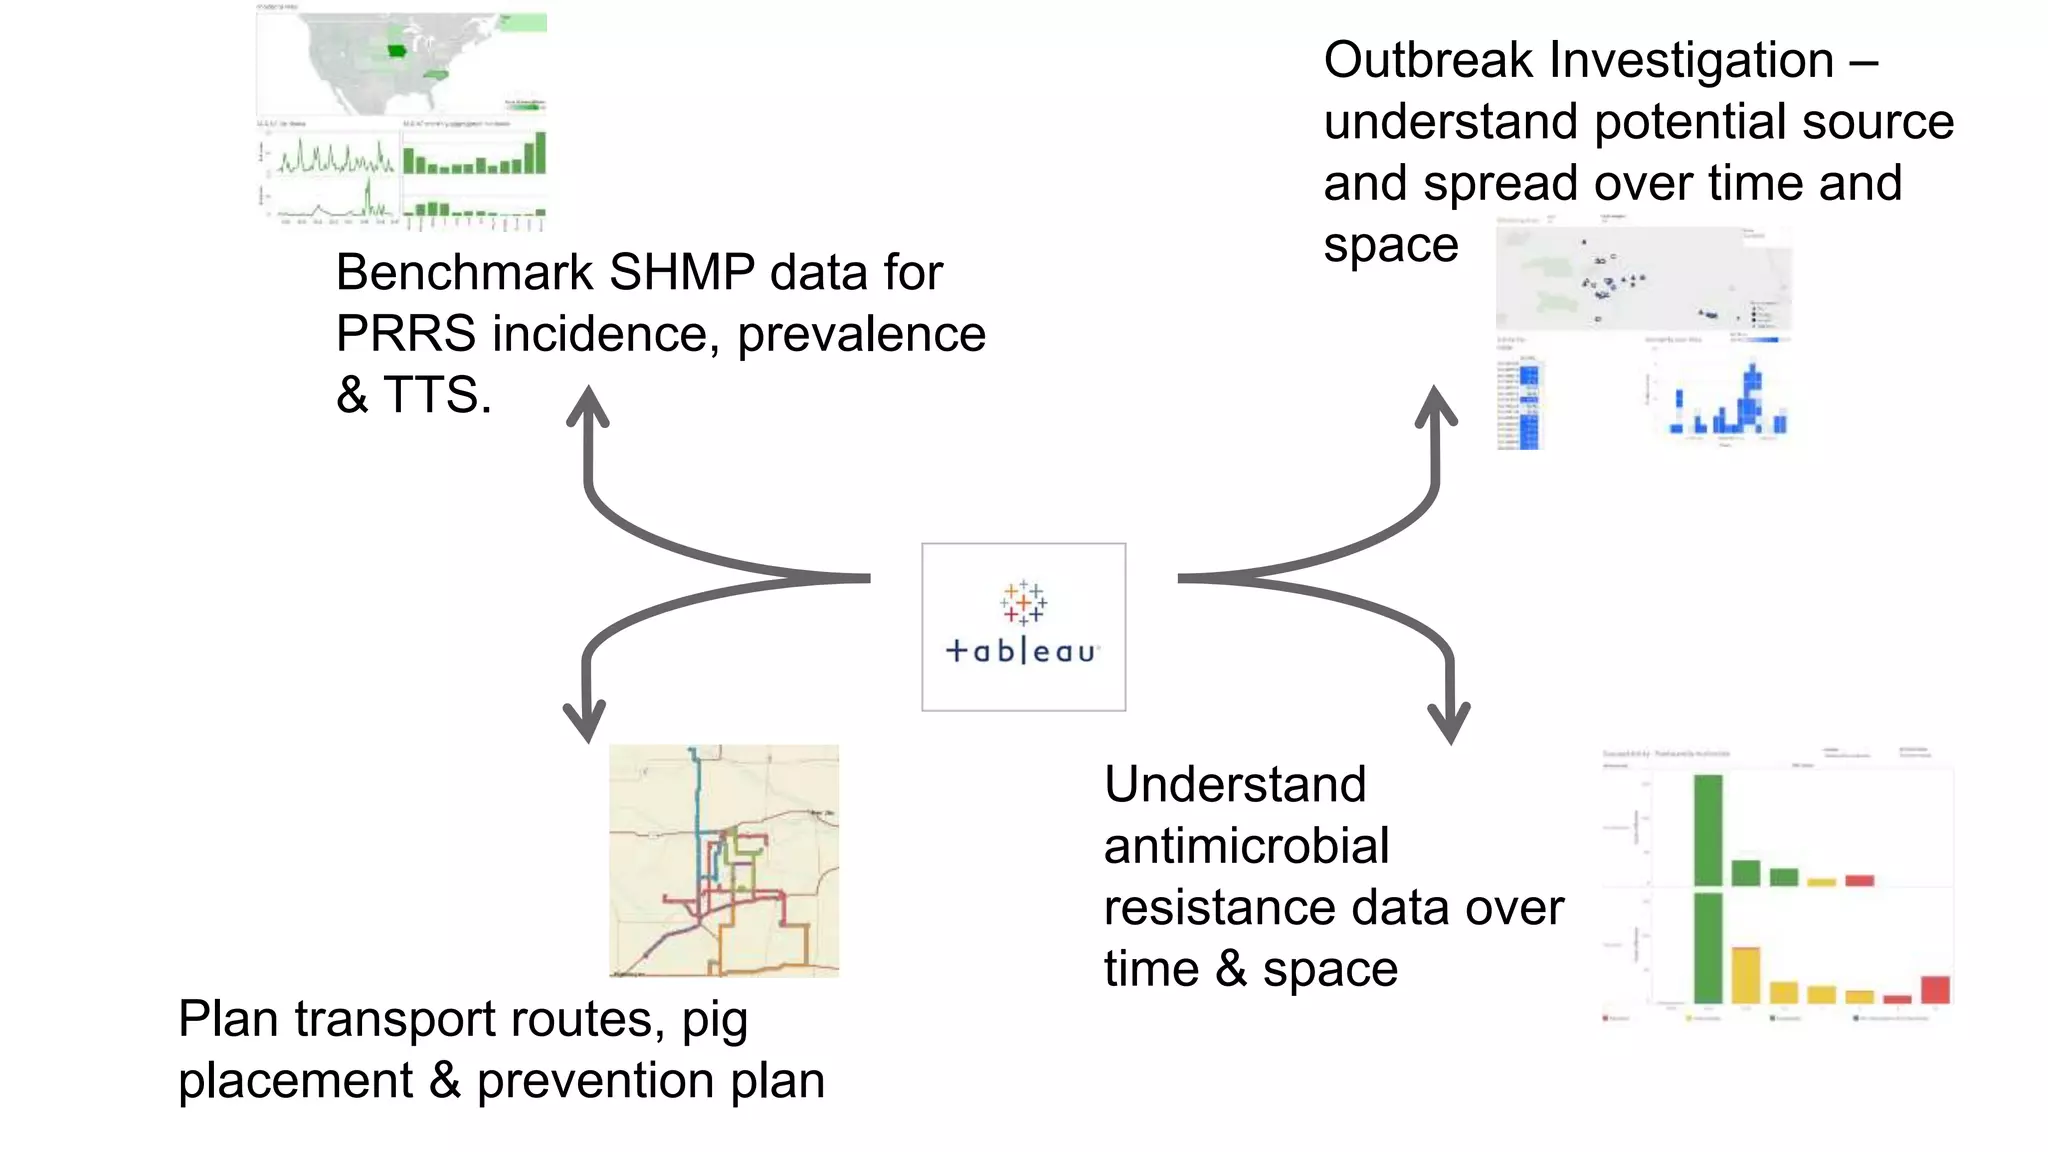


The document outlines the Morrison Swine Health Monitoring Program, led by a team of faculty and students, aimed at supporting the swine industry in response to emerging pathogens. It focuses on long-term capacity building and short-term benefits such as monitoring disease incidence and assisting with outbreak investigations. The program includes participation from 30 production companies, providing data on herd health and transport to better understand disease spread and antimicrobial resistance.