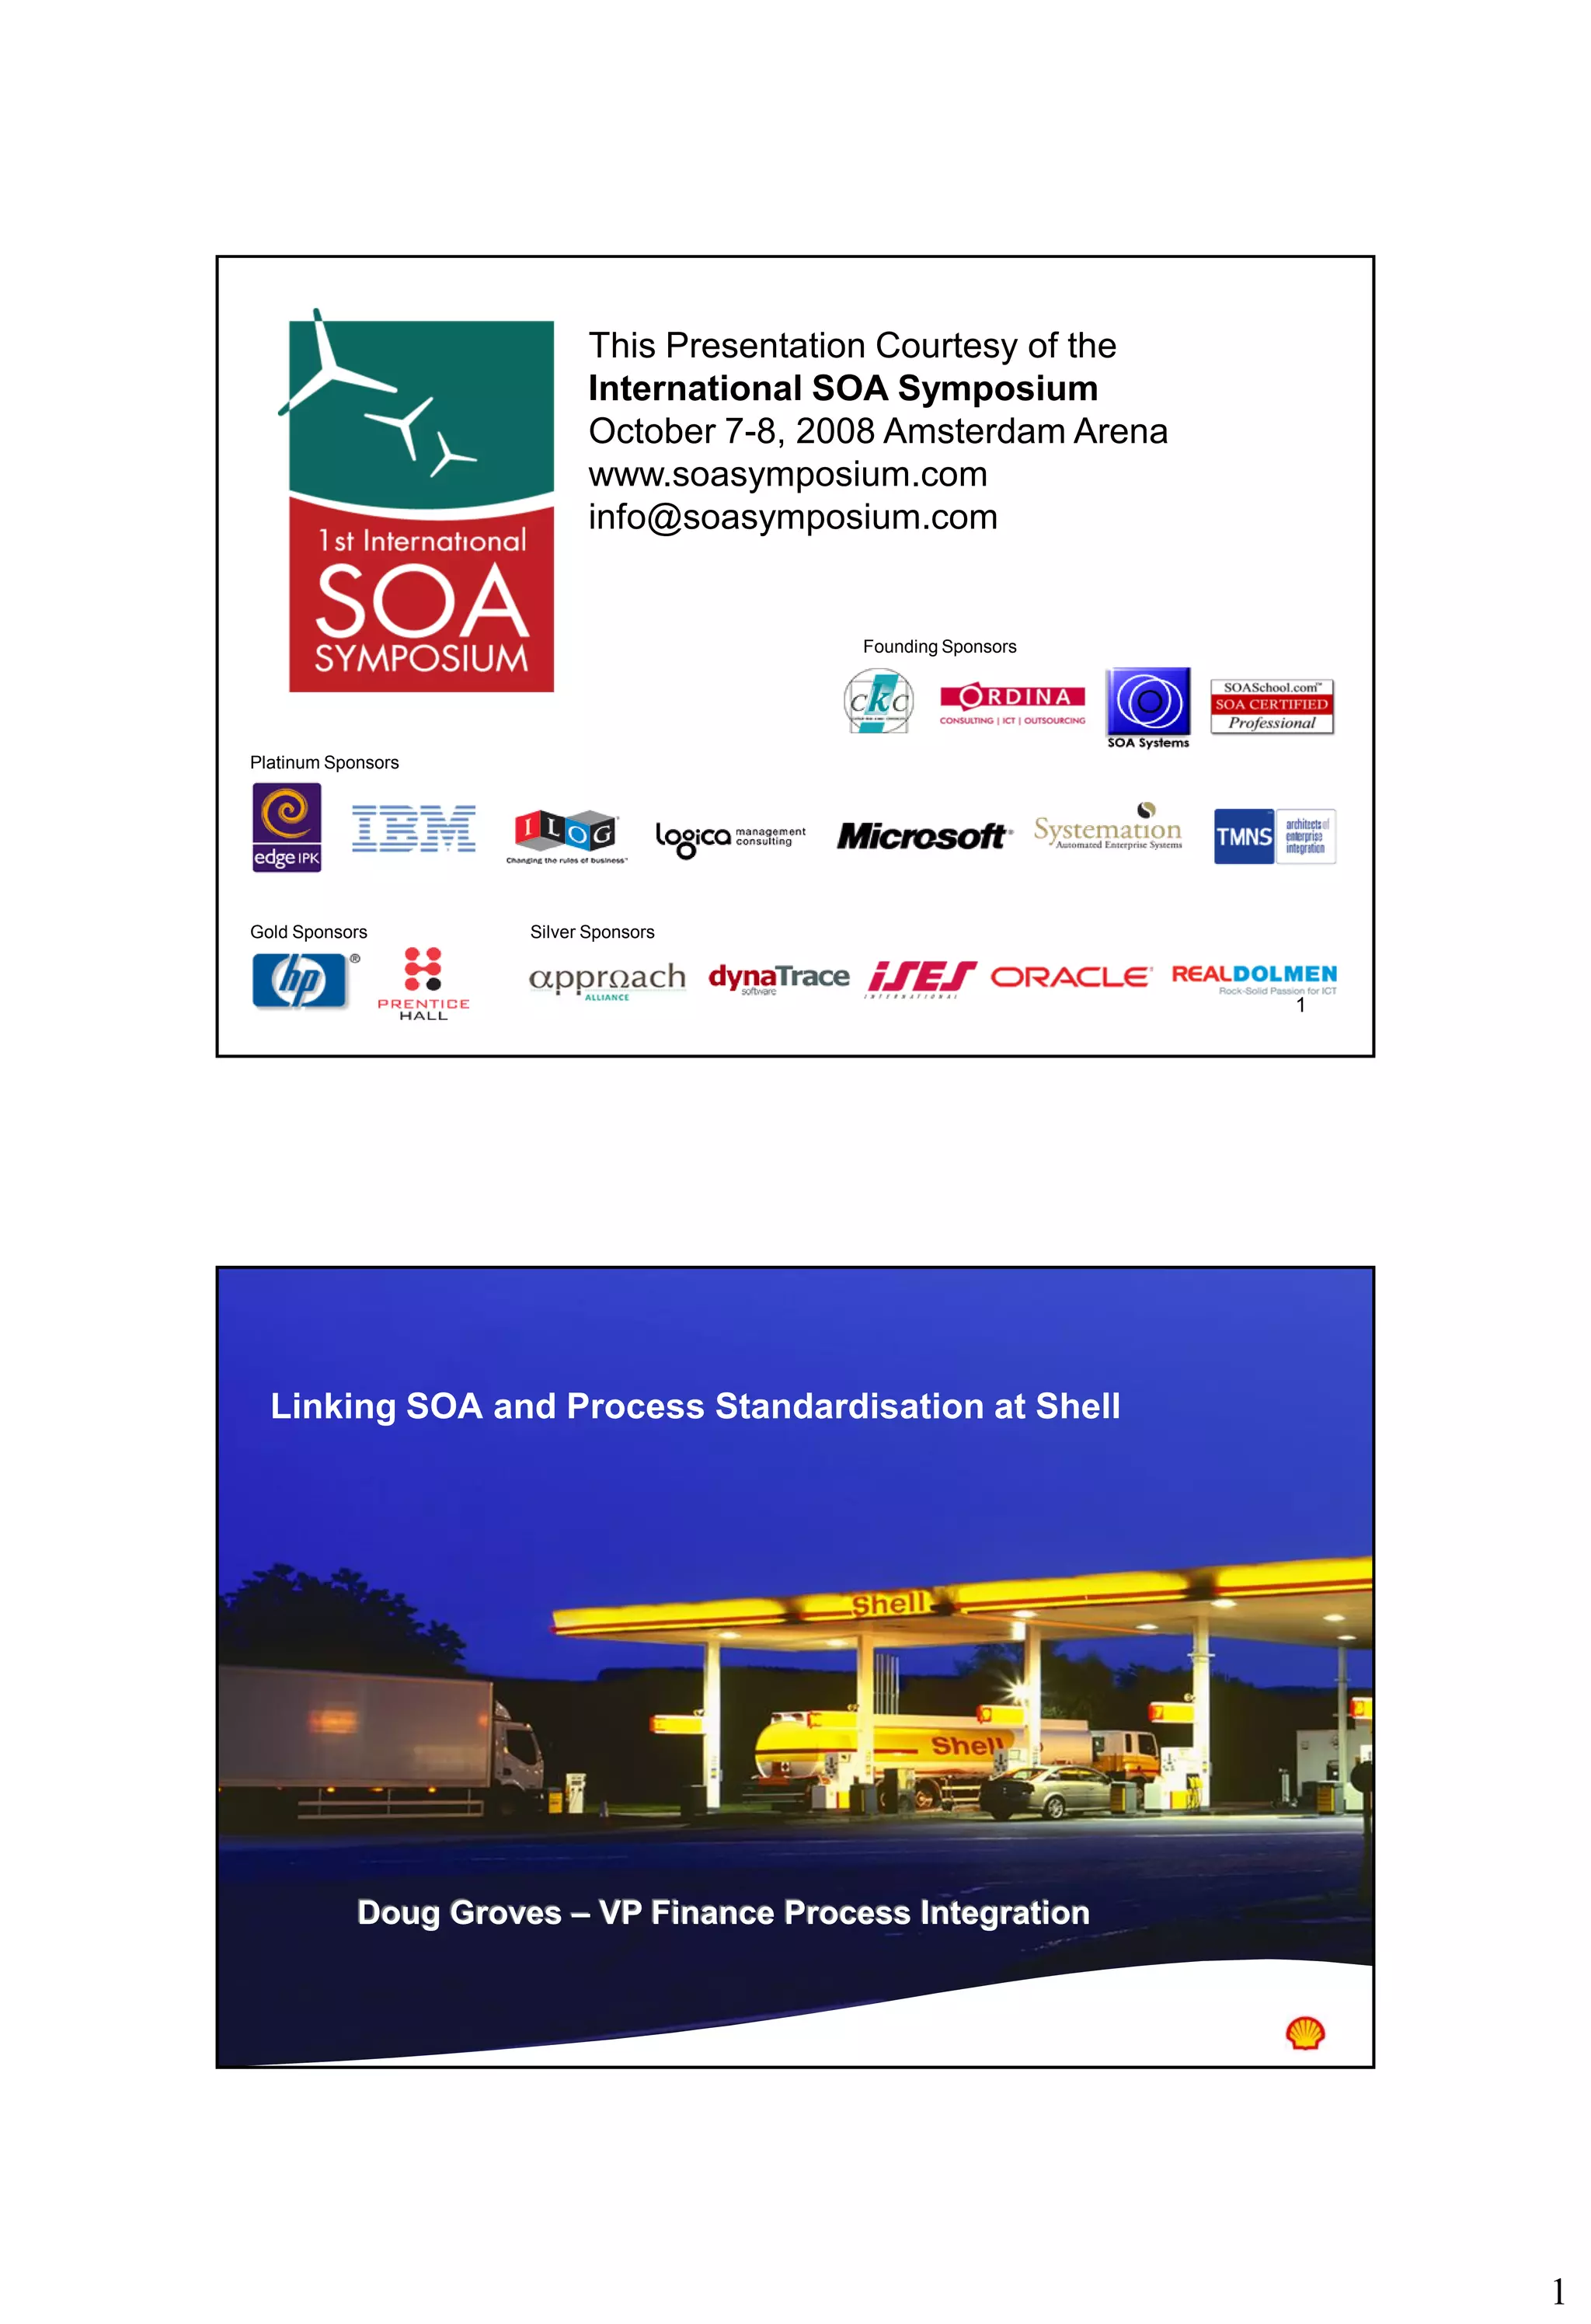
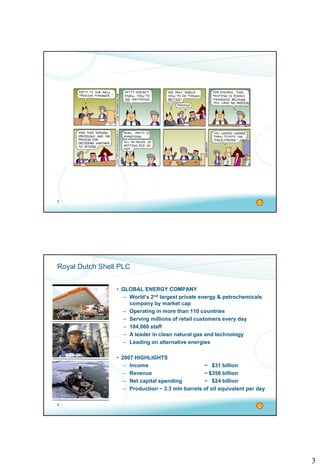
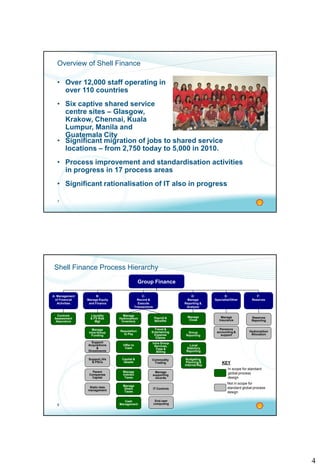
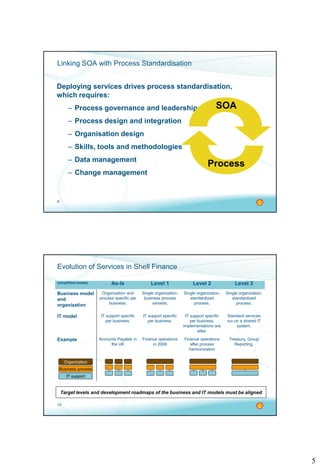
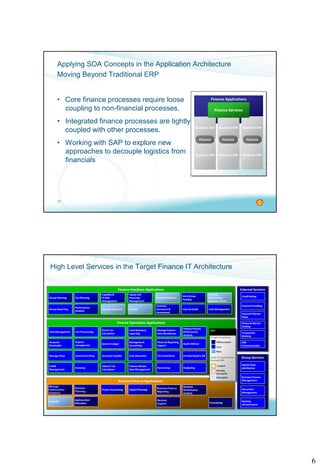
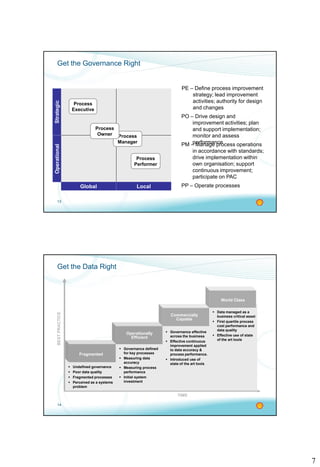
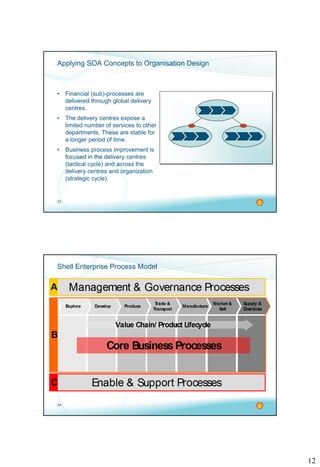
1
1
Founding Sponsors
This Presentation Courtesy of the
International SOA Symposium
October 7-8, 2008 Amsterdam Arena
www.soasymposium.com
info@soasymposium.com
Gold Sponsors
Platinum Sponsors
Silver Sponsors
2
Linking SOA and Process Standardisation at Shell
Doug Groves – VP Finance Process Integration
2
3
Theory
Should SOA fall short of expectations, it
will be for the same reasons ERP and
CRM have fallen short of expectations.
4
Theory
Should SOA fall short of expectations, it will be
for the same reasons ERP and CRM have fallen
short of expectations:
Insufficient Enterprise and Process
Maturity
3
5
6
Royal Dutch Shell PLC
• GLOBAL ENERGY COMPANY
– World’s 2nd largest private energy & petrochemicals
company by market cap
– Operating in more than 110 countries
– Serving millions of retail customers every day
– 104,000 staff
– A leader in clean natural gas and technology
– Leading on alternative energies
• 2007 HIGHLIGHTS
– Income ~ $31 billion
– Revenue ~ $356 billion
– Net capital spending ~ $24 billion
– Production ~ 3.3 mln barrels of oil equivalent per day
4
7
Overview of Shell Finance
• Significant migration of jobs to shared service
locations – from 2,750 today to 5,000 in 2010.
• Process improvement and standardisation activities
in progress in 17 process areas
• Significant rationalisation of IT also in progress
• Over 12,000 staff operating in
over 110 countries
• Six captive shared service
centre sites – Glasgow,
Krakow, Chennai, Kuala
Lumpur, Manila and
Guatemala City
8
Requisition
to Pay
Shell Finance Process Hierarchy
Group Finance
A: Management
of Financial
Activities
B:
Manage Equity
and Finance
Manage
Intra-Group
Funding
C:
Record &
Execute
Transactions
Liquidity
& FX Risk
Mgt
Local
Statutory
Reporting
Cash
Management
Manage
Direct
Taxes
Payroll &
Benefits
Manage
Close
Group
Reporting
Manage
Indirect
Taxes
Controls
Assessment
Assurance
Travel &
Entertaining
Expense
Claims
Budgeting,
Planning &
Internal Rep
Offer to
Cash
Manage
Hydrocarbon
Inventory
Capital &
Assets
D:
Manage
Reporting &
Analysis
E:
Specialist/Other
F:
Reserves
Commodity
Trading
Support
Acquisitions
&
Divestments
Parent
Companies
Capital
Manage
supporting
records
IT Controls
End user
computing
Static data
management
Manage
Insurance
Pensions
accounting &
support
Support JVs
& PSCs
Hydrocarbon
Allocation
Reserves
Reporting
Intra Group
Services,
Fees &
Billing
In scope for standard
global process
design
Not in scope for
standard global process
design
KEY
5
9
Linking SOA with Process Standardisation
Deploying services drives process standardisation,
which requires:
– Process governance and leadership
– Process design and integration
– Organisation design
– Skills, tools and methodologies
– Data management
– Change management
Process
SOA
10
Evolution of Services in Shell Finance
(simplified model) As-Is Level 1 Level 2 Level 3
Business model
and
organization
Organization and
process specific per
business.
Single organization,
business process
variants.
Single organization,
standardized
process.
Single organization,
standardized
process.
IT model IT support specific
per business.
IT support specific
per business.
IT support specific
per business,
implementations are
alike.
Standard services
run on a shared IT
system.
Example Accounts Payable in
the UK
Finance operations
in 2008
Finance operations
after process
harmonization
Treasury, Group
Reporting,
Business process
IT support
Organization
Target levels and development roadmaps of the business and IT models must be aligned
6
11
Applying SOA Concepts in the Application Architecture
Moving Beyond Traditional ERP
• Core finance processes require loose
coupling to non-financial processes.
• Integrated finance processes are tightly
coupled with other processes.
• Working with SAP to explore new
approaches to decouple logistics from
financials
Finance Applications
Business ERP
Business DW
Business ERP
Business DW
Business ERP
Business DW
Finance Services
Finance Finance Finance
12
External ServicesFinance Functions Applications
Business Finance Applications
Finance Operations Applications
Group Reporting
Local Statutory
reporting
Group Planning
Tax Compliance
Group Services
Business Process
Management
JV & PSC
Business
Performance
Analysis
Finance Process
Performance
Analysis
Payment handling
Credit Rating
Finance Master
Data Management
Accounts
Receivable
Accounts PayableManage Close
Dispute
management
Invoicing
Business Finance
Reporting
Audit Defense
Provide Routine MI
Controls,
Assurance &
Assessment
Cash Allocation
Indirect Tax
Calculation
Pension
Decision
Support
Equity and
Financing
Management
Cash Management
Master Data
distribution
Asset Accounting
Financial Reporting
Support
Manage Finance
Data Warehouse
Manage
Hydrocarbon
Inventory
Business
Planning
Manage Insurance
Liquidity &
FX Risk
Management
Tax Provisioning
Financial Market
Rates
Investor Relations
Hydrocarbon
Allocation
Credit
Management
Internal Audit
Budgeting
Project Accounting
Intra Group
Funding
Tax Planning
Forecasting
Direct Tax
Calculation
Performance
Analysis
Document
Management
Travel&
Entertaining
Expenses Claims
Financial Market
Dealing
Transaction
Banking
Cash Management
Capital Planning
Banking
Infrastructure
B2B
Communication
General Ledger
Management
Accounting
Forecasting
KEY
Target Competency
Level of coupling with
Business ERP
Base
Core
Differentiated
Decoupled
Partially
decoupled
Coupled
High Level Services in the Target Finance IT Architecture
7
13
Get the Governance Right
LocalGlobal
StrategicOperational
Process
Executive
Process
Manager
Process
Performer
PP – Operate processes
PE – Define process improvement
strategy; lead improvement
activities; authority for design
and changes
PO – Drive design and
improvement activities; plan
and support implementation;
monitor and assess
performancePM – Manage process operations
in accordance with standards;
drive implementation within
own organisation; support
continuous improvement;
participate on PAC
Process
Owner
14
Get the Data Right
 Governance defined
for key processes
 Measuring data
accuracy
 Measuring process
performance
 Initial system
investment
 Undefined governance
 Poor data quality
 Fragmented processes
 Perceived as a systems
problem
 Governance effective
across the business
 Effective continuous
improvement applied
to data accuracy &
process performance.
 Introduced use of
state of the art tools
 Data managed as a
business critical asset
 First quartile process
cost performance and
data quality
 Effective use of state
of the art tools
Operationally
Efficient
BESTPRACTICE
TIME
Commercially
Capable
Fragmented
World Class
8
15
Data Quality - Meeting Defined Standards for Good Business Reasons; Not
About Being Perfect
Data
Quality
Standards
Cost/Benefit
How much is it worth spending on
data?
Relevance
Are we maintaining data we do not
need?
Security/Accessibility
Do we need to restrict access to the
data?
Timeliness
Is the data up to date?
Is it available when required?
Completeness
Do we have all data to the right level
of detail?
Clarity/Uniqueness
Can we clearly select the right data?
Consistency
Is there more than one version of the
data?
Accuracy/Precision
Is the data accurate within tolerance?
16
Process and Enterprise Maturity Model
Process Design
Process Metrics
Process
Ownership
Process
Performers
Process
Infrastructure
Enterprise
Leadership
Enterprise
Governance
Enterprise Culture
Enterprise
Expertise
P – Ad-hoc, Designed, Integrated to Extended
E – From Process Tolerant to Process Centric
A way to evaluate the primary elements required to manage and
execute processes
Five
Maturity
Levels
9
17
Enterprise Maturity Extract - Leadership
Requisite Indicators Requisite Indicators
Leadership Awareness The enterprise's senior
executive team recognizes the
need to improve operational
performance but has only a
limited understanding of the
power of business processes.
Operational improvement is a
frequent discussion topic at
executive meetings.
Executives attend seminars or
perform site visits regarding
performance improvement
techniques. Process
terminology is often used but not
always precisely.
At least one senior executive
deeply understands the
business process concept, how
the enterprise can use it to
improve performance, and what
is involved in implementing it.
A member of the seniormost
executive group relates
enterprise performance
problems to specific
fragmentation and design flaws
in particular processes.
Alignment The leadership of the process
program lies in the middle
management ranks.
A mid-level manager has
developed a passion for process
and is lobbying with executives
to adopt the process approach.
A senior executive has taken
leadership of, and responsibility
for, the process program
A senior executive had made a
personal commitment of time
and resources to process
transformation, and is visibly
promoting the process concept.
Behavior A senor executive endorses and
invests in operational improvement.
Budget has been allocated for
process improvement training
and initiatives, and improvement
projects have been mandated.
A senior executive has publicly
set stretch performance goals in
customer terms and is prepared
to commit resources, make
deep changes, and remove
roadblocks in order to achieve
those goals.
Resources (financial and
human) have been assigned to
a process transformation
program in pursuit of explicit
stretch goals; managers who
attempt to impede the program
are appropriately disciplined.
Style The senior executive team has
started shifting from a top-down,
hierarchical style to an open,
collaborative style.
Senior managers actively solicit
ideas from lower levels of the
organization; some diagonal
task forces are in operation and
executives are following some of
their recommendations.
The senior executive team
leading the process program is
passionate about the need to
change and about process as
the key tool for change.
The senior executive leading the
process program spends
significant personal time
communicating and promoting
the program, and weaves
process concepts and goals into
all business discussions.
E-1 E-2
18
Process Maturity Model – Process Infrastructure
Information Systems
P1 P2 P3 P4
Fragmented legacy
support the
An IT system
from functional
supports the
An integrated IT
designed with the
mind and adhering
enterprise
the process.
An IT system with
architecture that
industry standards
enterprise
supports the
10
19
PEMM Use in Shell
• Assess maturity before new
deployment and adjust plans
as appropriate
• Define annual maturity
improvement plans by process
and organisation
• Tool for understanding keys to
success
• Annual survey to assess
progress
Methodology
& Tools
Leadership
& Goals
Execution &
Governance
Training &
Communications
Measurement
People
& Culture
Technology
20
Questions?
11
21
Process Re-engineering in Practice?
How the Process Owner
explained it
How the Process Designers
understood it
What the consultants
suggested …
How Onshore IT
designed it
How Offshore IT built it
How it was documented What the Deployment Team
did
How it Worked
at Go-live
How IT supports it What the Business really
needed …
22
Analysis of “loose” coupling in processes
Process decomposition to identify rough
boundaries
Approach to Define the Business Services
L1
L2
L3
L3
Process centric governance structure
Process driven data ownership
i i
i
The Business Services definition is iterative with Application Services definition
12
23
Applying SOA Concepts to Organisation Design
• Financial (sub)-processes are
delivered through global delivery
centres.
• The delivery centres expose a
limited number of services to other
departments. These are stable for
a longer period of time.
• Business process improvement is
focused in the delivery centres
(tactical cycle) and across the
delivery centres and organization
(strategic cycle).
24
Shell Enterprise Process Model

Doug Groves Shell S O A Symposium

  • 1.
    1 1 Founding Sponsors This PresentationCourtesy of the International SOA Symposium October 7-8, 2008 Amsterdam Arena www.soasymposium.com info@soasymposium.com Gold Sponsors Platinum Sponsors Silver Sponsors 2 Linking SOA and Process Standardisation at Shell Doug Groves – VP Finance Process Integration
  • 2.
    2 3 Theory Should SOA fallshort of expectations, it will be for the same reasons ERP and CRM have fallen short of expectations. 4 Theory Should SOA fall short of expectations, it will be for the same reasons ERP and CRM have fallen short of expectations: Insufficient Enterprise and Process Maturity
  • 3.
    3 5 6 Royal Dutch ShellPLC • GLOBAL ENERGY COMPANY – World’s 2nd largest private energy & petrochemicals company by market cap – Operating in more than 110 countries – Serving millions of retail customers every day – 104,000 staff – A leader in clean natural gas and technology – Leading on alternative energies • 2007 HIGHLIGHTS – Income ~ $31 billion – Revenue ~ $356 billion – Net capital spending ~ $24 billion – Production ~ 3.3 mln barrels of oil equivalent per day
  • 4.
    4 7 Overview of ShellFinance • Significant migration of jobs to shared service locations – from 2,750 today to 5,000 in 2010. • Process improvement and standardisation activities in progress in 17 process areas • Significant rationalisation of IT also in progress • Over 12,000 staff operating in over 110 countries • Six captive shared service centre sites – Glasgow, Krakow, Chennai, Kuala Lumpur, Manila and Guatemala City 8 Requisition to Pay Shell Finance Process Hierarchy Group Finance A: Management of Financial Activities B: Manage Equity and Finance Manage Intra-Group Funding C: Record & Execute Transactions Liquidity & FX Risk Mgt Local Statutory Reporting Cash Management Manage Direct Taxes Payroll & Benefits Manage Close Group Reporting Manage Indirect Taxes Controls Assessment Assurance Travel & Entertaining Expense Claims Budgeting, Planning & Internal Rep Offer to Cash Manage Hydrocarbon Inventory Capital & Assets D: Manage Reporting & Analysis E: Specialist/Other F: Reserves Commodity Trading Support Acquisitions & Divestments Parent Companies Capital Manage supporting records IT Controls End user computing Static data management Manage Insurance Pensions accounting & support Support JVs & PSCs Hydrocarbon Allocation Reserves Reporting Intra Group Services, Fees & Billing In scope for standard global process design Not in scope for standard global process design KEY
  • 5.
    5 9 Linking SOA withProcess Standardisation Deploying services drives process standardisation, which requires: – Process governance and leadership – Process design and integration – Organisation design – Skills, tools and methodologies – Data management – Change management Process SOA 10 Evolution of Services in Shell Finance (simplified model) As-Is Level 1 Level 2 Level 3 Business model and organization Organization and process specific per business. Single organization, business process variants. Single organization, standardized process. Single organization, standardized process. IT model IT support specific per business. IT support specific per business. IT support specific per business, implementations are alike. Standard services run on a shared IT system. Example Accounts Payable in the UK Finance operations in 2008 Finance operations after process harmonization Treasury, Group Reporting, Business process IT support Organization Target levels and development roadmaps of the business and IT models must be aligned
  • 6.
    6 11 Applying SOA Conceptsin the Application Architecture Moving Beyond Traditional ERP • Core finance processes require loose coupling to non-financial processes. • Integrated finance processes are tightly coupled with other processes. • Working with SAP to explore new approaches to decouple logistics from financials Finance Applications Business ERP Business DW Business ERP Business DW Business ERP Business DW Finance Services Finance Finance Finance 12 External ServicesFinance Functions Applications Business Finance Applications Finance Operations Applications Group Reporting Local Statutory reporting Group Planning Tax Compliance Group Services Business Process Management JV & PSC Business Performance Analysis Finance Process Performance Analysis Payment handling Credit Rating Finance Master Data Management Accounts Receivable Accounts PayableManage Close Dispute management Invoicing Business Finance Reporting Audit Defense Provide Routine MI Controls, Assurance & Assessment Cash Allocation Indirect Tax Calculation Pension Decision Support Equity and Financing Management Cash Management Master Data distribution Asset Accounting Financial Reporting Support Manage Finance Data Warehouse Manage Hydrocarbon Inventory Business Planning Manage Insurance Liquidity & FX Risk Management Tax Provisioning Financial Market Rates Investor Relations Hydrocarbon Allocation Credit Management Internal Audit Budgeting Project Accounting Intra Group Funding Tax Planning Forecasting Direct Tax Calculation Performance Analysis Document Management Travel& Entertaining Expenses Claims Financial Market Dealing Transaction Banking Cash Management Capital Planning Banking Infrastructure B2B Communication General Ledger Management Accounting Forecasting KEY Target Competency Level of coupling with Business ERP Base Core Differentiated Decoupled Partially decoupled Coupled High Level Services in the Target Finance IT Architecture
  • 7.
    7 13 Get the GovernanceRight LocalGlobal StrategicOperational Process Executive Process Manager Process Performer PP – Operate processes PE – Define process improvement strategy; lead improvement activities; authority for design and changes PO – Drive design and improvement activities; plan and support implementation; monitor and assess performancePM – Manage process operations in accordance with standards; drive implementation within own organisation; support continuous improvement; participate on PAC Process Owner 14 Get the Data Right  Governance defined for key processes  Measuring data accuracy  Measuring process performance  Initial system investment  Undefined governance  Poor data quality  Fragmented processes  Perceived as a systems problem  Governance effective across the business  Effective continuous improvement applied to data accuracy & process performance.  Introduced use of state of the art tools  Data managed as a business critical asset  First quartile process cost performance and data quality  Effective use of state of the art tools Operationally Efficient BESTPRACTICE TIME Commercially Capable Fragmented World Class
  • 8.
    8 15 Data Quality -Meeting Defined Standards for Good Business Reasons; Not About Being Perfect Data Quality Standards Cost/Benefit How much is it worth spending on data? Relevance Are we maintaining data we do not need? Security/Accessibility Do we need to restrict access to the data? Timeliness Is the data up to date? Is it available when required? Completeness Do we have all data to the right level of detail? Clarity/Uniqueness Can we clearly select the right data? Consistency Is there more than one version of the data? Accuracy/Precision Is the data accurate within tolerance? 16 Process and Enterprise Maturity Model Process Design Process Metrics Process Ownership Process Performers Process Infrastructure Enterprise Leadership Enterprise Governance Enterprise Culture Enterprise Expertise P – Ad-hoc, Designed, Integrated to Extended E – From Process Tolerant to Process Centric A way to evaluate the primary elements required to manage and execute processes Five Maturity Levels
  • 9.
    9 17 Enterprise Maturity Extract- Leadership Requisite Indicators Requisite Indicators Leadership Awareness The enterprise's senior executive team recognizes the need to improve operational performance but has only a limited understanding of the power of business processes. Operational improvement is a frequent discussion topic at executive meetings. Executives attend seminars or perform site visits regarding performance improvement techniques. Process terminology is often used but not always precisely. At least one senior executive deeply understands the business process concept, how the enterprise can use it to improve performance, and what is involved in implementing it. A member of the seniormost executive group relates enterprise performance problems to specific fragmentation and design flaws in particular processes. Alignment The leadership of the process program lies in the middle management ranks. A mid-level manager has developed a passion for process and is lobbying with executives to adopt the process approach. A senior executive has taken leadership of, and responsibility for, the process program A senior executive had made a personal commitment of time and resources to process transformation, and is visibly promoting the process concept. Behavior A senor executive endorses and invests in operational improvement. Budget has been allocated for process improvement training and initiatives, and improvement projects have been mandated. A senior executive has publicly set stretch performance goals in customer terms and is prepared to commit resources, make deep changes, and remove roadblocks in order to achieve those goals. Resources (financial and human) have been assigned to a process transformation program in pursuit of explicit stretch goals; managers who attempt to impede the program are appropriately disciplined. Style The senior executive team has started shifting from a top-down, hierarchical style to an open, collaborative style. Senior managers actively solicit ideas from lower levels of the organization; some diagonal task forces are in operation and executives are following some of their recommendations. The senior executive team leading the process program is passionate about the need to change and about process as the key tool for change. The senior executive leading the process program spends significant personal time communicating and promoting the program, and weaves process concepts and goals into all business discussions. E-1 E-2 18 Process Maturity Model – Process Infrastructure Information Systems P1 P2 P3 P4 Fragmented legacy support the An IT system from functional supports the An integrated IT designed with the mind and adhering enterprise the process. An IT system with architecture that industry standards enterprise supports the
  • 10.
    10 19 PEMM Use inShell • Assess maturity before new deployment and adjust plans as appropriate • Define annual maturity improvement plans by process and organisation • Tool for understanding keys to success • Annual survey to assess progress Methodology & Tools Leadership & Goals Execution & Governance Training & Communications Measurement People & Culture Technology 20 Questions?
  • 11.
    11 21 Process Re-engineering inPractice? How the Process Owner explained it How the Process Designers understood it What the consultants suggested … How Onshore IT designed it How Offshore IT built it How it was documented What the Deployment Team did How it Worked at Go-live How IT supports it What the Business really needed … 22 Analysis of “loose” coupling in processes Process decomposition to identify rough boundaries Approach to Define the Business Services L1 L2 L3 L3 Process centric governance structure Process driven data ownership i i i The Business Services definition is iterative with Application Services definition
  • 12.
    12 23 Applying SOA Conceptsto Organisation Design • Financial (sub)-processes are delivered through global delivery centres. • The delivery centres expose a limited number of services to other departments. These are stable for a longer period of time. • Business process improvement is focused in the delivery centres (tactical cycle) and across the delivery centres and organization (strategic cycle). 24 Shell Enterprise Process Model