1
Equal Access Participatory Monitoring and Evaluation toolkit
Module 5: Doing qualitative data analysis
Introduction
Once you have collected data, what do you do with it? How do you learn from it?
Qualitative data analysis (QDA) is the process of turning written data such as interview and field
notes into findings. There are no formulas, recipes or rules for this process, for which you will need
skills, knowledge, experience, insight and a willingness to keep learning and working at it.
There are many different ways of doing QDA. They include the case study approach, theory-based
approaches, and collaborative and participatory forms of analysis. We encourage you to try to
involve others in the process and to discuss and review your findings as much as possible. This will
help to make your findings more useful and trustworthy. No matter what method of analysis and
interpretation is used, your aim should always be to produce good quality findings.
One of the challenges that you’re likely to face is getting others to accept to value of qualitative data
compared with quantitative data, which is seen by some are more ‘scientific’ and valid. Getting
others who are involved in your programs to take the time and interest to become engaged in the
QDA process is likely to be another challenge that you’ll face. However, we hope that the information
in this module will help you to overcome some of these challenges.
This module aims to provide basic step-by-step information and examples about effective ways of
organising, managing and analysing qualitative data. This information draws on our experiences of
working closely with the M&E team at Equal Access Nepal for the past four years. We hope the
guidelines and examples in this module are useful to those who are beginning the journey of learning
about qualitative analysis. Additional examples and exercises related to data management and
analysis can be found in the EAR handbook (see http://ear.findingavoice.org/dealing/index.html).
Outcomes from using this module
You will understand:
 how good quality qualitative data analysis (QDA) can help you identify impacts of your
programs to better meet your objectives and the needs of the community
 the steps involved in undertaking basic QDA, including repeated reading, analysis and
interpretation
 the value of involving others in the QDA process
 the difference between description and interpretation
 the value of seeking feedback on your analysis and using triangulation to increase the
trustworthiness of findings
2
Why conduct QDA in communication for development programs?
Some good reasons for analysing qualitative M&E data collected about your communication for
development programs include:
 To identify any significant changes in people and communities that your programs may have
contributed to, whether directly or indirectly, expected or unexpected, positive or negative,
and to tell your stakeholders what impacts your programs are having in bringing changes to
community people and what people are gaining in the process.
 To better understand the subtle indicators of social change that have emerged from your
data, which you and others may not have thought about.
 To identify ways in which your programs can be improved or changed to better meet their
objectives and the needs of the community.
 To gain knowledge about emerging issues that can help you to understand your data better
and can be included in your programs.
 To enrich your findings with lively and detailed information that quantitative data does not
always provide.
 To better understand the culture, experiences, and activities of diverse community members
and the context of people’s lives and the communities where they live, which can help or
hinder social change.
 To find out about listening patterns related to your programs and changing patterns of media
consumption and use.
 To understand who is included and who is excluded from community dialogue, participation
and decision making related to the topics discussed in your programs.
What are your main aims in analysing qualitative data about your programs?
QDA process
Qualitative M&E data such as Most Significant Change (MSC) stories (see MSC manual for M&E staff
and others at Equal Access) and notes from focus group discussions (FGDs) are quite ‘messy’ and
unstructured. QDA does not happen in a linear way; it is not a neat and simple process. Rather, it
involves a repeated process of critically reading, interpreting and reaching shared understandings of
your data, as shown below.
3
Qualitative data can provide a rich picture of the impacts of your programs (expected and
unexpected, positive and negative) compared with quantitative data about things like the number of
people who listened to your program. This can help you to highlight the success factors of your
program. The process of collecting and analysing qualitative data provides good opportunities for
program staff and stakeholders to be actively involved in the PM&E process. Meetings held to discuss
data can include discussions about how well your programs are working and how they could be
improved.
Setting up data organisation, management and analysis systems
Setting up data collection, organisation and management systems that work well and everyone
understands is vital for good quality QDA. This is because it enables you and your programs to use
the data you have collected effectively, to improve your activities. Such systems can be quite simple
or more complex. However, the important thing is that they work effectively and meet your
particular needs.
Having good systems in place can also help you to better understand the impacts of your activities on
different groups of community members over time. Data collected at certain points in time, which
can readily be found and identified, can be compared to assess longer term changes in knowledge,
attitudes and behaviour. It can also show changing patterns in such things as listening to your radio
programs and the use of ICTs by various groups in the community.
Templates used at EAN to manage research data are provided in the appendix to this module
What sort of data organisation, management and analysis systems do you currently have in
place?
How could these systems be improved?
4
Basic data organisation, management and analysis steps
The diagram below sets out the 12 steps involved in doing basic QDA which are described in this
module. Of course, these steps are not usually undertaken in such a linear way, and you will find that
you will need to engage in smaller cycles of doing analysis, critically reflecting on your findings and
discussing them with others, and then revising your findings.
Example of the M&E data collection, organisation and management systems at EAN, set
up as part of AC4SC
There are eight community researchers (CRs) in five districts who conduct research in the community and
send research data to the M&E team on a monthly basis. They have been given a simple template to collect
and enter data on the research participant's profile and other qualitative and quantitative data. After they
receive this data, the M&E team file them and code them. Provision has been made to allocate up to six
codes per piece of data. Those codes are put into the database entry template. This template also contains
space for data on the participants’ profile (ethnicity, age, gender, education, occupation), date of data
collection, location of research, research tools used, relevance of research, and radio program discussed.
Based on this information, the database has been designed (using an SQL server as the back end) as well as
an interface for entering data into database, which was designed using Visual Basics 6.0. This overall
database system has been mainly designed to manage the research data and easily retrieve the required
information with the help of different searching criteria like codes, education, age, ethnicity, date (time
period), and gender. Each piece of data (such as an interview) is given a unique identification number
which is essential for data management, retrieval and analysis purposes.
Some challenges and issues
Much of the data that we received initially from the CRs were not directly related to the program
objectives. Most of this data was written up based on the use of different participatory tools and
techniques but the in-depth data which the project required was not always provided very well. The
concept of the template and database was introduced later on and we planned to enter all of the CR data
received since May 2009. Since some of this earlier data was not very useful, it had to be excluded from the
database entry. On reflection, it would have been better if such an approach had been initiated from the
very beginning of the project implementation.
Another challenge has been getting the CRs to gather all of the information about participants to maintain
their profile and enable us to more rigorously conduct further cross tabulation analysis. Addressing this
issue has required giving constant feedback and mentoring to some of the CRs.
5
Step 1: Record your data and prepare memos
You must keep an accurate record of all the data you collect. Documentation is an integral part of the
research and evaluation process. This means keeping a clear and detailed record of all the data you
have collected in the form of detailed notes, transcripts, diagrams, maps or other materials. The
more detailed and clear your notes are at the time of doing your research, the easier it will be to use
your data later on.
Writing up your data in detail can take some time but is a vital part of the qualitative research
process. Time in your working day should therefore be allocated to this activity. The following steps
should be followed:
During the field visit:
 Prepare rough notes of interviews, FGDs etc
 Make audio and/or visual recordings
 Gather any materials developed during participatory activities
Immediately after the field visit:
 Type your field notes as soon as possible (a template for field notes may be useful)
 Prepare memos based on an initial analysis by the data collector (see explanation and
example in the box below).
 Listen to the audio tape of your interview, FDGs etc (if made) and note the time into the tape
that an important or interesting topic was raised then fully transcribe this passage.
Quotations can then be later used to illustrate key findings in your M&E report.
6
Step 2: Label and archive your data
You now need to organise your data to make it easy to use for analysis. This means labelling all data,
so that you know where it came from and how it was collected. You also need to set up an archive or
database to help you easily find your data. This is most effectively done using a computer program
such as Excel but could initially be paper copies of your data held in a lever arch file or something
similar.
All data must have the following basic information:
 Who? – name of interviewee and researcher
 Where? – location of interview etc.
 When? - date and time of interview
 How? - methods used (ie. interview and observation)
Record archive - This will help you to find your data
 Create a unique identification number
 Develop a filing system
The value of memos
 Memos are short notes (about two lines long) that capture the essence of what you learned
from an activity. This can be helpful in identifying the main codes for a piece of data analysis
(i.e. education, gender etc.). Here is an example of a memo about the data collected by a
community researcher from Nepal:
This interview shows how listener's interest changed regarding the content and preferences
related to listening. New codes like conflict and constituent assembly and listening pattern
(individual versus group) emerged which needs more research now. It also provides feedback on
how to convert learnings into behaviour.
Extract from interview: ‘We formed an SSMK club and started listening to SSMK because it has
good information. I stopped listening to SSMK because I knew about HIV and AIDS and problem
solving. My interest is now increased towards politics. This is because of the conflict and the
constituent assembly. SSMK is fruitful for young ones. People prefer individual listening than group
because they have to manage time for group listening. People who are busy at work listen to the
radio while others watch TV. People prefer to listen on their local FM radio station because of the
clear sound. To turn their learnings into behaviour, it is better to encourage listeners to take part in
activities’.
Male, 30, Dang (22 August, 2009)
 Writing memos as soon as possible after a field visit or research activity is a useful way of recording
important learnings and information which can then be shared with others. This practice is a useful aid
to remembering the key issues and to beginning the process of coding and analysis. It is, in effect, the
first step in the analysis process.
 Meetings of M&E and program staff could be held once a month to review memos and to encourage
everyone to talk about the issues in the memos and to inform the initial data analysis.
7
 Design a record database for basic information
Your data is unique and valuable and should be protected. You should make copies of all your data
and put the master copy away in a secure place for safekeeping. Some researchers like to make one
copy of their data for writing on as they do the analysis and another that can be used for cutting and
pasting (this can also be done on a computer).
Step 3: Review your PM&E objectives
Before analysing your data, you should always start by reviewing your evaluation goals, i.e., the
reason you undertook the evaluation in the first place. This will help you to organise your data and
focus your analysis.
For example, if you wanted to improve your program by identifying what is working well and what is
not working so well with it, you can organize data into these two categories: 1. What works well; and,
2. What does not work well. As you read through your data you can develop suggestions for
improving the program.
If you’re conducting an impact evaluation, you could categorise data according to the indicators you
have for each program objective.
Step 4: Analyse contextual and demographic data
It is important to have a good understanding of who the data was collected from, what tools were
used to collect the data, and the local context and issues that are relevant to the focus of your
evaluation. This information will help your analysis and interpretation of the data and is particularly
important if your data is collected by different researchers in various locations.
Demographic data about research participants can be put into a template like the example provided
in Appendix 1 at the end of this module, and then statistics prepared on the age, gender, caste or
ethnic group, occupation, education level and other relevant details about your research
participants. This information can later be included in your evaluation report. This will help the
readers of your report to understand more about how many people took part in your research, how
wide a diversity of people were involved, and what their backgrounds were. Such information also
helps to validate your results and conclusions.
Step 5: Carefully read through the data and begin coding
Begin the process of analysis by carefully reading through all your field notes, interview transcripts
etc and making comments in the margins about the key patterns, themes and issues in the data. A
pattern refers to a descriptive finding such as ‘Most of the participants reported that they lacked
time to listen to the radio due to school and household duties’. A theme is a broad category or topic
such as ‘barriers to listening’.
You could use coloured pens to code different ideas or themes in your data. Some people like to use
Post-it notes or coloured dots in this process. You can also do this using a word-processing program.
You will need to read your data several times before it is completely coded.
8
A code is a way of organising data in terms of its subject matter. You are likely to use many codes,
some general, and some more specific. For instance, a general code might be 'education' and you
could use it to identify data that is relevant to education. A more specific code might be 'higher
education' which you use because the data refers to improving the quality of higher education.
You will need to go through your data in detail, coding it according to the types of themes and issues
that emerge. For example, the codes ‘education’ and ‘health’ will probably be relevant to most
research at some point. By coding data as ‘education’ or ‘health’ you are marking it in a way that
means you can find it and return to it later, knowing that this particular piece of data is about
‘education’ or ‘health’ (it could be about both, in which case you will have applied both codes to it).
In this way the code will help you to identify relevant bits of data that you can pull together later to
say something about ‘education’ and/or ‘health’.
Coding is more than simply organising data. Coding also helps you to begin the process of
systematically analysing it, working out what the data is telling you and the relationships and
patterns in your data.
As your research develops you will define many codes, building up an increasingly detailed
understanding of the data. If you are working as a team on the process of coding, it is important to
develop a shared understanding and agreement on the names of codes and what they mean. The
codes you develop are likely to change as your research proceeds and you develop new
understandings of the topics you are researching. An example of part of a codebook developed by
the M&E team at EAN is provided below. This shows some of the codes identified as part of their
analysis of the community researcher data.
Extract from codebook developed by Equal Access Nepal
SN Code Brief definition Full definition When to use
1 Listening
Pattern
Frequency and type
of radio program
listening and
related broadcast
issues
Information relating to the
frequency of listening to the
radio programs, the listening
mode, the broadcast station,
the preferred broadcast time
of these programs, and barriers
to listening
Use this code for all references which illustrate
patterns of listening to the SSMK or NN radio
programs, listening mode (i.e. individual or
group etc), feedback or comments about the
radio station that the programs are listened to
on, the preferred broadcast time of these
programs, and any barriers to listening
2 Feedback Feedback on radio
program format
and content
Negative or positive
suggestions, appreciation or
other feedback about the
format, style and content of the
radio programs
Use this code for all the references which
illustrate suggestions, appreciation or other
feedback about the format, presentation style,
presenters and issues discussed in the SSMK or
NN radio programs
3 Awareness Changes in
awareness or
knowledge
Any changes in listeners’
awareness or knowledge,
brought about by listening to
the radio programs
Use this code for all references which illustrate
any changes in the awareness or knowledge of
listeners that was directly brought about by
listening to the SSMK or NN radio programs
9
Developing a comprehensive codebook can take some time and effort. If you don’t have the time and
resources to undertake a full coding process, there are other options that can be used to manage and
begin analysing your data. For example, the MSC manual sets out a process for sorting Most
Significant Change stories into ‘domains of change’ such as ‘Changes in knowledge or awareness’ and
‘Changes in attitude and behaviour’, and then selecting the most significant stories and recording the
reasons for this selection. This type of process could also be used to analyse qualitative data such as
extracts from interviews or FGDs.
Step 6: Identify and summarise themes
Once you have an initial list of codes, and agreed definitions of these codes, you can begin organising
your data into similar categories such as ‘listening patterns’, ‘feedback on programs’, ‘program
impacts’ and ‘suggested improvements’. These headings can later be used when you prepare a
report on your findings. Next, you can summarise the main themes, drawing on contextual data and
other information that can help you to better understand your findings.
Example of major themes from an analysis of community researcher data
The following themes have been adapted from two reports on the analysis of mainly interview and focus
group data collected by eight community researchers in five research districts of Nepal over a five month
period in 2009. 150 pieces of data were collected during this time.
Listening pattern
Unlike the previous report, the data collected in this period showed that most of the participants in four of
the five of the research sites were listening to SSMK at least once every two weeks. This change appears
to have come about because the community researchers in all research areas have been encouraging
participants to regularly listen to both the SSMK and Naya Nepal radio programs.
Feedback on program presenters
Similarly in the earlier report, many participants in one group discussion in Dadheldura involving seven
male and three female students aged 16 to 18 commented that the presentation of the new SSMK team
did not draw their attention well enough. However, since that data was collected there has been a
noticeable change in their attitude towards new team. Now, they all listen to the program and said they
appreciated the efforts of the new team to improve their presentation style, following the feedback given
to them. They also gave useful suggestions about improving a few things that did not work well in the
program such as the use of too many English words or the ‘urban-centred’ themes that did not represent
the reality or rural life very well.
Impacts of SSMK
In a group discussion held in Palpa with six female and five male participants aged 17 - 20, most of them
said that the SSMK program had taught them to walk towards a more positive path in life rather than a
negative one. They said that adopting a more positive outlook has helped them to realise their
responsibility towards their community. Taking inspiration from the program, they conducted street-
dramas which aimed to raise community awareness about water borne disease and safety measures for
women. After listening to the program, some of them also said they had changed their attitude towards
caste discrimination and have openly discussed sensitive issues such as untouchability at home with their
parents, brothers and sisters.
10
Note how frequently each pattern or theme occurs and who talked about this theme (for example,
people of a particular gender or ethnic group or those in a particular location). It is usually best to
look for the range of views expressed by participants rather than trying to quantify the responses.
However, if your data clearly shows which participants made particular comments, it can add rigour
to your analysis to include some quantification of responses where it is appropriate to do so. An
example of the main themes from the analysis of interview and focus group data collected by
community researchers in Nepal is shown above.
Step 7: Interpret findings, assess contributions to impacts and summarise
The next step involves attempting to put your data into perspective. This means comparing your
results with what you expected, and with your original program objectives, indicators and research
questions. You would then summarise your main findings, under broad headings such as ‘Listening
Patterns’ and ‘Program Impacts’.
Interpretation goes beyond description. It means attaching significance to what your data is telling
you, making sense of your findings, offering explanations, drawing conclusions and lessons learned,
and imposing order onto a complex and messy world. Your findings should aim to do the following:
1. Confirm what you know that is supported by the data.
2. Get rid of any misconceptions.
3. Illuminate important things that you didn’t know but should know.
You also need to consider the extent to which your program may have contributed to the impacts
identified, based on the evidence that you have collected and analysed. This means understanding
how various aspects of your programs (including grassroots activities by listener clubs and NGOs)
work over time in combination with other activities to produce certain impacts and effects.
You may start with very limited data, which only tells you about a certain group of people in a certain
place. This is fine as a beginning as long as you make it clear in your reports that the findings are
limited to these people in this place. Gradually, over time, you can increase the scope of your
research, talk to more people from different backgrounds, in different locations. The important point
is to be aware of the limitations of the research you have done, and make this clear to readers of
your reports. The next step is to investigate issues of interest further.
It is always best to take a cautious approach to the interpretation of your data. This means avoiding
leaping to conclusions or making assumptions about why something happened. This is why it is
always useful to discuss your interpretations at length with others. Learning how to produce a good
interpretation of your data can be challenging and is likely to take some time but is worth
persevering with as an effective and rigorous interpretation can really improve your data analysis
reports. Seeking feedback and support from others with more experience in this area should help
you to improve more quickly.
11
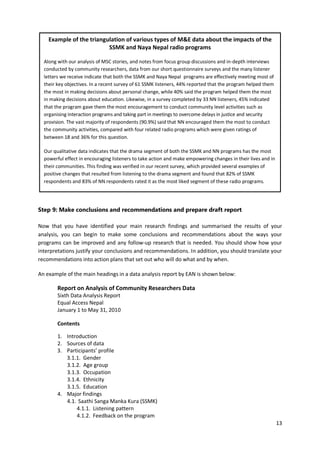
Example of the interpretation of data about the impacts of the SSMK program
The data in the following example was collected using the MSC technique in four research sites in different
parts of Nepal. Interviews were conducted with four to six people in each site over a two month period. A
total of 19 stories were collected from 10 females and 5 males aged 16 - 19 and three women and one
man aged 35 - 45. Some details in the examples have been added to better illustrate the level of detail that
you should try to achieve in your reports.
Impact of SSMK
Improved Communication Skills
In five of the stories listening to SSMK encouraged four young people and one older woman to more
openly discuss important issues with members of their family and to communicate better with others, as
the following examples illustrate:
I started listening to the SSMK radio program and gaining knowledge from the drama segment. I made the
habit of open discussion with my daughters and started treating them as friends. My daughters were happy
with me and they even started helping me with work, and sharing their feelings and their school activities.
(Housewife, aged 49, Chhetri caste, Dadeldhura)
With the help of critical thinking [learned by listening to SSMK] I was able to communicate with my aunt.
Her husband works away from home and even she has to go to work during the morning. I put forward my
proposal - I told her that I shall look after her daughter till morning when she goes to work and once she is
back she will go to school. For that she should pay me for my school. She agreed and right now I am staying
at her home and my study is going fine. (Female student, aged 20, Dang)
Increased Motivation to Study
Six of the stories also showed that SSMK is helping some young people to increase their motivation to
study, as the following quotation demonstrates:
I am a regular listener of the SSMK program. I listen to the drama related to the importance of education. I
was affected by the drama that was aired about how a person who neglects his studies suffers in the later
phase of his life. This drama, as well as pressure from my mother and brother, helped me to realise the
importance of education. I find that I have an increased interest towards studies these days. Earlier, I used
to secure just-pass numbers in class 5, 6 and 7 but in class 8 I stood second. This is all due to the help of the
SSMK radio program and my family, that I have reached this place. (Male student, aged 17, Chhetri caste,
Dang)
Interpretation
The impacts mentioned above are part of our analysis of MSC stories which are regularly collected by
community researchers. They indicate that the SSMK program is effectively meeting its objectives of
building the life skills of young people and empowering young people to make good decisions. Our analysis
of these stories indicates that listening to SSMK has had a positive impact on some listeners in increasing
their skills in communication and critical thinking. These new skills, and the encouragement they have
gained from listening to the program, have helped to improve relationships among family members. Some
young people were also more motivated to study and later became more financially independent and
better able to contribute money to their household. As the quotations above indicate, the drama segment
of the program appears to have the most powerful effect in encouraging listeners to develop a more
positive attitude and to make empowering changes in their life. They also show that these impacts are
magnified by the encouragement of other family members who may not have listened to the program, but
have indirectly experienced some positive effects of the program such as improved communication and
relationships with their son or daughter.
12
Step 8: Triangulate data sources
Triangulation is a crucial step in the evaluation and impact assessment process. Triangulation is the
process of combining multiple methods and perspectives with various types of data sources in order
to cross-check the results of your research. It can also mean using several different researchers in an
evaluation. An example of triangulation is provided below.
Once you’ve completed an analysis of a large amount of qualitative data of different types it is very
useful to triangulate this data. Qualitative data can also be triangulated with quantitative data. This
process helps to strengthen your evaluation and make your findings more useful to others by
providing different information and perspectives about the topic of your evaluation. It also enables
you and others to check the validity of your data and your findings, thereby making your findings
more trustworthy.
Triangulation of different sources of qualitative data, such as those shown in the diagram below,
could involve:
 Drawing on quantitative data from your analysis of short questionnaire surveys to cross-
check the findings from your analysis of qualitative data and to indicate how wide-spread
certain impacts and outcomes are.
 Using different participatory techniques to measure the same indicator and then comparing
the results. If the results are similar they are more likely to be accurate.
 Comparing the themes in your observations (written in field notes) with the themes in
interviews and noting any changes over time. Ask participants to explain these changes.
 Checking the consistency of what people say about the same topic over time.
 Comparing the perspectives of people who have different points of view (for example,
listener club members, staff of your partner organisations, and parents of young listeners).
 Checking interview and FGD data or MSC stories against program documentation and other
written evidence that can verify what interviewees reported.
Triangulation of different sources of data
Interviews
(in-depth
and group)
Data from
participatory
techniques
Observations
and field
notes
MSC technique
(stories and
other data)
Short
questionnaire
surveys
13
Step 9: Make conclusions and recommendations and prepare draft report
Now that you have identified your main research findings and summarised the results of your
analysis, you can begin to make some conclusions and recommendations about the ways your
programs can be improved and any follow-up research that is needed. You should show how your
interpretations justify your conclusions and recommendations. In addition, you should translate your
recommendations into action plans that set out who will do what and by when.
An example of the main headings in a data analysis report by EAN is shown below:
Report on Analysis of Community Researchers Data
Sixth Data Analysis Report
Equal Access Nepal
January 1 to May 31, 2010
Contents
1. Introduction
2. Sources of data
3. Participants’ profile
3.1.1. Gender
3.1.2. Age group
3.1.3. Occupation
3.1.4. Ethnicity
3.1.5. Education
4. Major findings
4.1. Saathi Sanga Manka Kura (SSMK)
4.1.1. Listening pattern
4.1.2. Feedback on the program
Example of the triangulation of various types of M&E data about the impacts of the
SSMK and Naya Nepal radio programs
Along with our analysis of MSC stories, and notes from focus group discussions and in-depth interviews
conducted by community researchers, data from our short questionnaire surveys and the many listener
letters we receive indicate that both the SSMK and Naya Nepal programs are effectively meeting most of
their key objectives. In a recent survey of 61 SSMK listeners, 44% reported that the program helped them
the most in making decisions about personal change, while 40% said the program helped them the most
in making decisions about education. Likewise, in a survey completed by 33 NN listeners, 45% indicated
that the program gave them the most encouragement to conduct community level activities such as
organising interaction programs and taking part in meetings to overcome delays in justice and security
provision. The vast majority of respondents (90.9%) said that NN encouraged them the most to conduct
the community activities, compared with four related radio programs which were given ratings of
between 18 and 36% for this question.
Our qualitative data indicates that the drama segment of both the SSMK and NN programs has the most
powerful effect in encouraging listeners to take action and make empowering changes in their lives and in
their communities. This finding was verified in our recent survey, which provided several examples of
positive changes that resulted from listening to the drama segment and found that 82% of SSMK
respondents and 83% of NN respondents rated it as the most liked segment of these radio programs.
14
4.1.3. Feedback on various contemporary issues
4.1.4. Learnings and impacts
4.2 Naya Nepal (NN)
4.2.1. Listening pattern
4.2.2. Feedback on the program
4.2.3. Feedback on various contemporary issues
4.2.4. Learning and impacts
5. Recommendations to content teams
6. Constraints of the research
7. Conclusion
Step 10: Seek feedback and validation
Once you have prepared a draft report on your evaluation, it is important to ask program staff and
others to critically review your initial analysis, recommendations, learnings and conclusions.
The process of cross-checking your findings and evidence of impacts with others is important to
enable valid judgements to be made about your findings. This can highlight biases and specific
interests and can reveal contradictions in your data that may not be easily explained.
Example of feedback on a data analysis report
The following example illustrates the feedback on a draft report on the M&E team at EAN’s data
analysis of community research data received from the SSMK and Naya Nepal content teams
(provided in Track Changes in the report). This helped to increase the trustworthiness of our
analysis.
On a bi-monthly basis the M&E team shares the data analysis report with content team (CT) members for
comments and feedback. Comments and feedback provided by the content team members are often
related to doing more follow up research on the same issue or asking for some new issue to research. This
process has helped to make the findings and analysis reports more trustworthy and useful to the content
team members.
Extract from report: One of the interviewee from Dadeldhura thinks that the program deals with the
present situation of the country. If the program would also include more of the community issues like their
problems, infrastructures, employment etc, it would be much better.
Comment from CT: This is of course a good suggestion. NN does not deal with each and every issue though.
So I would request the community researcher to talk about the audience limitations of the program so that
the audience will be able to identify local issues based the topics NN deals with.
Extract from report: As per the various community discussions held in research sites, we found that the
listening trend of the program is gradually decreasing. The popularity of television programs (*) is found to
be the major factor for the drop in listenership. Another factor is that people are more attracted towards
local languages program covering their issues, aired from local FM stations (**).
Comments from CT : * What is the major reason behind this? ** What are the local issues? Did
they identify any particular issues?
15
Based on the feedback on your draft report and the validation process, you should revise your
analysis and finalise your report.
Step 11: Communicate your findings
The next step is to share your findings with program staff and stakeholders, community members
and donors. These findings can be used to help your program to better respond to local community
needs and expectations, increase sustainability, and work more effectively.
They can also be used to identify areas where further research is needed. At this stage, you will need
to think about:
 What you have found out and how can this information be of use to the overall development
of your programs?
 How can you best put your findings to use?
 How can local community people benefit from this research and your findings?
 How can this research best be used to identify other issues you need to explore?
 What is the best way to share your findings with different groups?
Analysis is an important step in putting your data to work and allowing it to be utilised in the
community and by your organisation. This is an evaluation of part of your organisation’s work and
what it has achieved, and it identifies its strengths and weaknesses. It is important to acknowledge
successes as well as failures and negative impacts as this is the best way to learn more about how
well your programs are working and how they can be improved.
While program staff and donors may prefer to receive a written report, it is likely to be more useful
to share your findings with the community using a range of methods such as community forums,
newsletters and wall newspapers. This is also an excellent way to check the validity of your findings.
Step 12: Implement recommendations and improve QDA system
Now that you have shared your findings with others and obtained their feedback on your report and
its recommendations, those responsible can begin to implement the recommendations. You can also
begin to conduct any follow up research that may be needed.
In addition, you should regularly review your QDA systems and processes to identify anything that’s
not working well and how it could be made more effective, efficient and sustainable in terms of the
resources and time you have available.
Some final words
This approach to QDA allows you and your programs to ground your evaluations in the wider social
context in which your programs are working and to engage others in the QDA process. This makes it
possible to describe direct and indirect, expected and unexpected impacts of your programs in great
detail. This is a hugely valuable and rare resource and it places program staff and others in a good
position to decide what needs to be done to improve your programs and projects. With such
findings, you can PLAN actions, DO them, and continue to OBSERVE and REFLECT (i.e. research) how
these new actions work or don’t work.
16
Some of the steps in QDA can be quite challenging, and some activities might be very time
consuming, depending on what is required, but you always need to share what you have learned,
and what you think is important to pass onto others. Good quality QDA allows you to get a good
understanding what works and what does not work so well in your programs. This can help you to
better meet your objectives and the needs of different social groups in the community.
17
Appendix 1: Reporting formats for community researchers
Example of a template for collecting information about participants and the
research conducted
Summary Report
Daily Report
Date:
Name of Place:
Number of participants:
Male: Female:
Ethnic: Dalit: Madheshi: Brahmin: Chhetri: Others:
Age range (maximum participants)..............to.................years
Objective:
Tools used:
Major issue discussed:
Example of template for collecting demographic data about research participants
S.N. Name Address Age Education Occupation Listening pattern
NN SSMK
1
2
3
4
5
6
18
Appendix 2: Database interface used by Equal Access Nepal
19

Doing qualitative data analysis

  • 1.
    1 Equal Access ParticipatoryMonitoring and Evaluation toolkit Module 5: Doing qualitative data analysis Introduction Once you have collected data, what do you do with it? How do you learn from it? Qualitative data analysis (QDA) is the process of turning written data such as interview and field notes into findings. There are no formulas, recipes or rules for this process, for which you will need skills, knowledge, experience, insight and a willingness to keep learning and working at it. There are many different ways of doing QDA. They include the case study approach, theory-based approaches, and collaborative and participatory forms of analysis. We encourage you to try to involve others in the process and to discuss and review your findings as much as possible. This will help to make your findings more useful and trustworthy. No matter what method of analysis and interpretation is used, your aim should always be to produce good quality findings. One of the challenges that you’re likely to face is getting others to accept to value of qualitative data compared with quantitative data, which is seen by some are more ‘scientific’ and valid. Getting others who are involved in your programs to take the time and interest to become engaged in the QDA process is likely to be another challenge that you’ll face. However, we hope that the information in this module will help you to overcome some of these challenges. This module aims to provide basic step-by-step information and examples about effective ways of organising, managing and analysing qualitative data. This information draws on our experiences of working closely with the M&E team at Equal Access Nepal for the past four years. We hope the guidelines and examples in this module are useful to those who are beginning the journey of learning about qualitative analysis. Additional examples and exercises related to data management and analysis can be found in the EAR handbook (see http://ear.findingavoice.org/dealing/index.html). Outcomes from using this module You will understand:  how good quality qualitative data analysis (QDA) can help you identify impacts of your programs to better meet your objectives and the needs of the community  the steps involved in undertaking basic QDA, including repeated reading, analysis and interpretation  the value of involving others in the QDA process  the difference between description and interpretation  the value of seeking feedback on your analysis and using triangulation to increase the trustworthiness of findings
  • 2.
    2 Why conduct QDAin communication for development programs? Some good reasons for analysing qualitative M&E data collected about your communication for development programs include:  To identify any significant changes in people and communities that your programs may have contributed to, whether directly or indirectly, expected or unexpected, positive or negative, and to tell your stakeholders what impacts your programs are having in bringing changes to community people and what people are gaining in the process.  To better understand the subtle indicators of social change that have emerged from your data, which you and others may not have thought about.  To identify ways in which your programs can be improved or changed to better meet their objectives and the needs of the community.  To gain knowledge about emerging issues that can help you to understand your data better and can be included in your programs.  To enrich your findings with lively and detailed information that quantitative data does not always provide.  To better understand the culture, experiences, and activities of diverse community members and the context of people’s lives and the communities where they live, which can help or hinder social change.  To find out about listening patterns related to your programs and changing patterns of media consumption and use.  To understand who is included and who is excluded from community dialogue, participation and decision making related to the topics discussed in your programs. What are your main aims in analysing qualitative data about your programs? QDA process Qualitative M&E data such as Most Significant Change (MSC) stories (see MSC manual for M&E staff and others at Equal Access) and notes from focus group discussions (FGDs) are quite ‘messy’ and unstructured. QDA does not happen in a linear way; it is not a neat and simple process. Rather, it involves a repeated process of critically reading, interpreting and reaching shared understandings of your data, as shown below.
  • 3.
    3 Qualitative data canprovide a rich picture of the impacts of your programs (expected and unexpected, positive and negative) compared with quantitative data about things like the number of people who listened to your program. This can help you to highlight the success factors of your program. The process of collecting and analysing qualitative data provides good opportunities for program staff and stakeholders to be actively involved in the PM&E process. Meetings held to discuss data can include discussions about how well your programs are working and how they could be improved. Setting up data organisation, management and analysis systems Setting up data collection, organisation and management systems that work well and everyone understands is vital for good quality QDA. This is because it enables you and your programs to use the data you have collected effectively, to improve your activities. Such systems can be quite simple or more complex. However, the important thing is that they work effectively and meet your particular needs. Having good systems in place can also help you to better understand the impacts of your activities on different groups of community members over time. Data collected at certain points in time, which can readily be found and identified, can be compared to assess longer term changes in knowledge, attitudes and behaviour. It can also show changing patterns in such things as listening to your radio programs and the use of ICTs by various groups in the community. Templates used at EAN to manage research data are provided in the appendix to this module What sort of data organisation, management and analysis systems do you currently have in place? How could these systems be improved?
  • 4.
    4 Basic data organisation,management and analysis steps The diagram below sets out the 12 steps involved in doing basic QDA which are described in this module. Of course, these steps are not usually undertaken in such a linear way, and you will find that you will need to engage in smaller cycles of doing analysis, critically reflecting on your findings and discussing them with others, and then revising your findings. Example of the M&E data collection, organisation and management systems at EAN, set up as part of AC4SC There are eight community researchers (CRs) in five districts who conduct research in the community and send research data to the M&E team on a monthly basis. They have been given a simple template to collect and enter data on the research participant's profile and other qualitative and quantitative data. After they receive this data, the M&E team file them and code them. Provision has been made to allocate up to six codes per piece of data. Those codes are put into the database entry template. This template also contains space for data on the participants’ profile (ethnicity, age, gender, education, occupation), date of data collection, location of research, research tools used, relevance of research, and radio program discussed. Based on this information, the database has been designed (using an SQL server as the back end) as well as an interface for entering data into database, which was designed using Visual Basics 6.0. This overall database system has been mainly designed to manage the research data and easily retrieve the required information with the help of different searching criteria like codes, education, age, ethnicity, date (time period), and gender. Each piece of data (such as an interview) is given a unique identification number which is essential for data management, retrieval and analysis purposes. Some challenges and issues Much of the data that we received initially from the CRs were not directly related to the program objectives. Most of this data was written up based on the use of different participatory tools and techniques but the in-depth data which the project required was not always provided very well. The concept of the template and database was introduced later on and we planned to enter all of the CR data received since May 2009. Since some of this earlier data was not very useful, it had to be excluded from the database entry. On reflection, it would have been better if such an approach had been initiated from the very beginning of the project implementation. Another challenge has been getting the CRs to gather all of the information about participants to maintain their profile and enable us to more rigorously conduct further cross tabulation analysis. Addressing this issue has required giving constant feedback and mentoring to some of the CRs.
  • 5.
    5 Step 1: Recordyour data and prepare memos You must keep an accurate record of all the data you collect. Documentation is an integral part of the research and evaluation process. This means keeping a clear and detailed record of all the data you have collected in the form of detailed notes, transcripts, diagrams, maps or other materials. The more detailed and clear your notes are at the time of doing your research, the easier it will be to use your data later on. Writing up your data in detail can take some time but is a vital part of the qualitative research process. Time in your working day should therefore be allocated to this activity. The following steps should be followed: During the field visit:  Prepare rough notes of interviews, FGDs etc  Make audio and/or visual recordings  Gather any materials developed during participatory activities Immediately after the field visit:  Type your field notes as soon as possible (a template for field notes may be useful)  Prepare memos based on an initial analysis by the data collector (see explanation and example in the box below).  Listen to the audio tape of your interview, FDGs etc (if made) and note the time into the tape that an important or interesting topic was raised then fully transcribe this passage. Quotations can then be later used to illustrate key findings in your M&E report.
  • 6.
    6 Step 2: Labeland archive your data You now need to organise your data to make it easy to use for analysis. This means labelling all data, so that you know where it came from and how it was collected. You also need to set up an archive or database to help you easily find your data. This is most effectively done using a computer program such as Excel but could initially be paper copies of your data held in a lever arch file or something similar. All data must have the following basic information:  Who? – name of interviewee and researcher  Where? – location of interview etc.  When? - date and time of interview  How? - methods used (ie. interview and observation) Record archive - This will help you to find your data  Create a unique identification number  Develop a filing system The value of memos  Memos are short notes (about two lines long) that capture the essence of what you learned from an activity. This can be helpful in identifying the main codes for a piece of data analysis (i.e. education, gender etc.). Here is an example of a memo about the data collected by a community researcher from Nepal: This interview shows how listener's interest changed regarding the content and preferences related to listening. New codes like conflict and constituent assembly and listening pattern (individual versus group) emerged which needs more research now. It also provides feedback on how to convert learnings into behaviour. Extract from interview: ‘We formed an SSMK club and started listening to SSMK because it has good information. I stopped listening to SSMK because I knew about HIV and AIDS and problem solving. My interest is now increased towards politics. This is because of the conflict and the constituent assembly. SSMK is fruitful for young ones. People prefer individual listening than group because they have to manage time for group listening. People who are busy at work listen to the radio while others watch TV. People prefer to listen on their local FM radio station because of the clear sound. To turn their learnings into behaviour, it is better to encourage listeners to take part in activities’. Male, 30, Dang (22 August, 2009)  Writing memos as soon as possible after a field visit or research activity is a useful way of recording important learnings and information which can then be shared with others. This practice is a useful aid to remembering the key issues and to beginning the process of coding and analysis. It is, in effect, the first step in the analysis process.  Meetings of M&E and program staff could be held once a month to review memos and to encourage everyone to talk about the issues in the memos and to inform the initial data analysis.
  • 7.
    7  Design arecord database for basic information Your data is unique and valuable and should be protected. You should make copies of all your data and put the master copy away in a secure place for safekeeping. Some researchers like to make one copy of their data for writing on as they do the analysis and another that can be used for cutting and pasting (this can also be done on a computer). Step 3: Review your PM&E objectives Before analysing your data, you should always start by reviewing your evaluation goals, i.e., the reason you undertook the evaluation in the first place. This will help you to organise your data and focus your analysis. For example, if you wanted to improve your program by identifying what is working well and what is not working so well with it, you can organize data into these two categories: 1. What works well; and, 2. What does not work well. As you read through your data you can develop suggestions for improving the program. If you’re conducting an impact evaluation, you could categorise data according to the indicators you have for each program objective. Step 4: Analyse contextual and demographic data It is important to have a good understanding of who the data was collected from, what tools were used to collect the data, and the local context and issues that are relevant to the focus of your evaluation. This information will help your analysis and interpretation of the data and is particularly important if your data is collected by different researchers in various locations. Demographic data about research participants can be put into a template like the example provided in Appendix 1 at the end of this module, and then statistics prepared on the age, gender, caste or ethnic group, occupation, education level and other relevant details about your research participants. This information can later be included in your evaluation report. This will help the readers of your report to understand more about how many people took part in your research, how wide a diversity of people were involved, and what their backgrounds were. Such information also helps to validate your results and conclusions. Step 5: Carefully read through the data and begin coding Begin the process of analysis by carefully reading through all your field notes, interview transcripts etc and making comments in the margins about the key patterns, themes and issues in the data. A pattern refers to a descriptive finding such as ‘Most of the participants reported that they lacked time to listen to the radio due to school and household duties’. A theme is a broad category or topic such as ‘barriers to listening’. You could use coloured pens to code different ideas or themes in your data. Some people like to use Post-it notes or coloured dots in this process. You can also do this using a word-processing program. You will need to read your data several times before it is completely coded.
  • 8.
    8 A code isa way of organising data in terms of its subject matter. You are likely to use many codes, some general, and some more specific. For instance, a general code might be 'education' and you could use it to identify data that is relevant to education. A more specific code might be 'higher education' which you use because the data refers to improving the quality of higher education. You will need to go through your data in detail, coding it according to the types of themes and issues that emerge. For example, the codes ‘education’ and ‘health’ will probably be relevant to most research at some point. By coding data as ‘education’ or ‘health’ you are marking it in a way that means you can find it and return to it later, knowing that this particular piece of data is about ‘education’ or ‘health’ (it could be about both, in which case you will have applied both codes to it). In this way the code will help you to identify relevant bits of data that you can pull together later to say something about ‘education’ and/or ‘health’. Coding is more than simply organising data. Coding also helps you to begin the process of systematically analysing it, working out what the data is telling you and the relationships and patterns in your data. As your research develops you will define many codes, building up an increasingly detailed understanding of the data. If you are working as a team on the process of coding, it is important to develop a shared understanding and agreement on the names of codes and what they mean. The codes you develop are likely to change as your research proceeds and you develop new understandings of the topics you are researching. An example of part of a codebook developed by the M&E team at EAN is provided below. This shows some of the codes identified as part of their analysis of the community researcher data. Extract from codebook developed by Equal Access Nepal SN Code Brief definition Full definition When to use 1 Listening Pattern Frequency and type of radio program listening and related broadcast issues Information relating to the frequency of listening to the radio programs, the listening mode, the broadcast station, the preferred broadcast time of these programs, and barriers to listening Use this code for all references which illustrate patterns of listening to the SSMK or NN radio programs, listening mode (i.e. individual or group etc), feedback or comments about the radio station that the programs are listened to on, the preferred broadcast time of these programs, and any barriers to listening 2 Feedback Feedback on radio program format and content Negative or positive suggestions, appreciation or other feedback about the format, style and content of the radio programs Use this code for all the references which illustrate suggestions, appreciation or other feedback about the format, presentation style, presenters and issues discussed in the SSMK or NN radio programs 3 Awareness Changes in awareness or knowledge Any changes in listeners’ awareness or knowledge, brought about by listening to the radio programs Use this code for all references which illustrate any changes in the awareness or knowledge of listeners that was directly brought about by listening to the SSMK or NN radio programs
  • 9.
    9 Developing a comprehensivecodebook can take some time and effort. If you don’t have the time and resources to undertake a full coding process, there are other options that can be used to manage and begin analysing your data. For example, the MSC manual sets out a process for sorting Most Significant Change stories into ‘domains of change’ such as ‘Changes in knowledge or awareness’ and ‘Changes in attitude and behaviour’, and then selecting the most significant stories and recording the reasons for this selection. This type of process could also be used to analyse qualitative data such as extracts from interviews or FGDs. Step 6: Identify and summarise themes Once you have an initial list of codes, and agreed definitions of these codes, you can begin organising your data into similar categories such as ‘listening patterns’, ‘feedback on programs’, ‘program impacts’ and ‘suggested improvements’. These headings can later be used when you prepare a report on your findings. Next, you can summarise the main themes, drawing on contextual data and other information that can help you to better understand your findings. Example of major themes from an analysis of community researcher data The following themes have been adapted from two reports on the analysis of mainly interview and focus group data collected by eight community researchers in five research districts of Nepal over a five month period in 2009. 150 pieces of data were collected during this time. Listening pattern Unlike the previous report, the data collected in this period showed that most of the participants in four of the five of the research sites were listening to SSMK at least once every two weeks. This change appears to have come about because the community researchers in all research areas have been encouraging participants to regularly listen to both the SSMK and Naya Nepal radio programs. Feedback on program presenters Similarly in the earlier report, many participants in one group discussion in Dadheldura involving seven male and three female students aged 16 to 18 commented that the presentation of the new SSMK team did not draw their attention well enough. However, since that data was collected there has been a noticeable change in their attitude towards new team. Now, they all listen to the program and said they appreciated the efforts of the new team to improve their presentation style, following the feedback given to them. They also gave useful suggestions about improving a few things that did not work well in the program such as the use of too many English words or the ‘urban-centred’ themes that did not represent the reality or rural life very well. Impacts of SSMK In a group discussion held in Palpa with six female and five male participants aged 17 - 20, most of them said that the SSMK program had taught them to walk towards a more positive path in life rather than a negative one. They said that adopting a more positive outlook has helped them to realise their responsibility towards their community. Taking inspiration from the program, they conducted street- dramas which aimed to raise community awareness about water borne disease and safety measures for women. After listening to the program, some of them also said they had changed their attitude towards caste discrimination and have openly discussed sensitive issues such as untouchability at home with their parents, brothers and sisters.
  • 10.
    10 Note how frequentlyeach pattern or theme occurs and who talked about this theme (for example, people of a particular gender or ethnic group or those in a particular location). It is usually best to look for the range of views expressed by participants rather than trying to quantify the responses. However, if your data clearly shows which participants made particular comments, it can add rigour to your analysis to include some quantification of responses where it is appropriate to do so. An example of the main themes from the analysis of interview and focus group data collected by community researchers in Nepal is shown above. Step 7: Interpret findings, assess contributions to impacts and summarise The next step involves attempting to put your data into perspective. This means comparing your results with what you expected, and with your original program objectives, indicators and research questions. You would then summarise your main findings, under broad headings such as ‘Listening Patterns’ and ‘Program Impacts’. Interpretation goes beyond description. It means attaching significance to what your data is telling you, making sense of your findings, offering explanations, drawing conclusions and lessons learned, and imposing order onto a complex and messy world. Your findings should aim to do the following: 1. Confirm what you know that is supported by the data. 2. Get rid of any misconceptions. 3. Illuminate important things that you didn’t know but should know. You also need to consider the extent to which your program may have contributed to the impacts identified, based on the evidence that you have collected and analysed. This means understanding how various aspects of your programs (including grassroots activities by listener clubs and NGOs) work over time in combination with other activities to produce certain impacts and effects. You may start with very limited data, which only tells you about a certain group of people in a certain place. This is fine as a beginning as long as you make it clear in your reports that the findings are limited to these people in this place. Gradually, over time, you can increase the scope of your research, talk to more people from different backgrounds, in different locations. The important point is to be aware of the limitations of the research you have done, and make this clear to readers of your reports. The next step is to investigate issues of interest further. It is always best to take a cautious approach to the interpretation of your data. This means avoiding leaping to conclusions or making assumptions about why something happened. This is why it is always useful to discuss your interpretations at length with others. Learning how to produce a good interpretation of your data can be challenging and is likely to take some time but is worth persevering with as an effective and rigorous interpretation can really improve your data analysis reports. Seeking feedback and support from others with more experience in this area should help you to improve more quickly.
  • 11.
    11 Example of theinterpretation of data about the impacts of the SSMK program The data in the following example was collected using the MSC technique in four research sites in different parts of Nepal. Interviews were conducted with four to six people in each site over a two month period. A total of 19 stories were collected from 10 females and 5 males aged 16 - 19 and three women and one man aged 35 - 45. Some details in the examples have been added to better illustrate the level of detail that you should try to achieve in your reports. Impact of SSMK Improved Communication Skills In five of the stories listening to SSMK encouraged four young people and one older woman to more openly discuss important issues with members of their family and to communicate better with others, as the following examples illustrate: I started listening to the SSMK radio program and gaining knowledge from the drama segment. I made the habit of open discussion with my daughters and started treating them as friends. My daughters were happy with me and they even started helping me with work, and sharing their feelings and their school activities. (Housewife, aged 49, Chhetri caste, Dadeldhura) With the help of critical thinking [learned by listening to SSMK] I was able to communicate with my aunt. Her husband works away from home and even she has to go to work during the morning. I put forward my proposal - I told her that I shall look after her daughter till morning when she goes to work and once she is back she will go to school. For that she should pay me for my school. She agreed and right now I am staying at her home and my study is going fine. (Female student, aged 20, Dang) Increased Motivation to Study Six of the stories also showed that SSMK is helping some young people to increase their motivation to study, as the following quotation demonstrates: I am a regular listener of the SSMK program. I listen to the drama related to the importance of education. I was affected by the drama that was aired about how a person who neglects his studies suffers in the later phase of his life. This drama, as well as pressure from my mother and brother, helped me to realise the importance of education. I find that I have an increased interest towards studies these days. Earlier, I used to secure just-pass numbers in class 5, 6 and 7 but in class 8 I stood second. This is all due to the help of the SSMK radio program and my family, that I have reached this place. (Male student, aged 17, Chhetri caste, Dang) Interpretation The impacts mentioned above are part of our analysis of MSC stories which are regularly collected by community researchers. They indicate that the SSMK program is effectively meeting its objectives of building the life skills of young people and empowering young people to make good decisions. Our analysis of these stories indicates that listening to SSMK has had a positive impact on some listeners in increasing their skills in communication and critical thinking. These new skills, and the encouragement they have gained from listening to the program, have helped to improve relationships among family members. Some young people were also more motivated to study and later became more financially independent and better able to contribute money to their household. As the quotations above indicate, the drama segment of the program appears to have the most powerful effect in encouraging listeners to develop a more positive attitude and to make empowering changes in their life. They also show that these impacts are magnified by the encouragement of other family members who may not have listened to the program, but have indirectly experienced some positive effects of the program such as improved communication and relationships with their son or daughter.
  • 12.
    12 Step 8: Triangulatedata sources Triangulation is a crucial step in the evaluation and impact assessment process. Triangulation is the process of combining multiple methods and perspectives with various types of data sources in order to cross-check the results of your research. It can also mean using several different researchers in an evaluation. An example of triangulation is provided below. Once you’ve completed an analysis of a large amount of qualitative data of different types it is very useful to triangulate this data. Qualitative data can also be triangulated with quantitative data. This process helps to strengthen your evaluation and make your findings more useful to others by providing different information and perspectives about the topic of your evaluation. It also enables you and others to check the validity of your data and your findings, thereby making your findings more trustworthy. Triangulation of different sources of qualitative data, such as those shown in the diagram below, could involve:  Drawing on quantitative data from your analysis of short questionnaire surveys to cross- check the findings from your analysis of qualitative data and to indicate how wide-spread certain impacts and outcomes are.  Using different participatory techniques to measure the same indicator and then comparing the results. If the results are similar they are more likely to be accurate.  Comparing the themes in your observations (written in field notes) with the themes in interviews and noting any changes over time. Ask participants to explain these changes.  Checking the consistency of what people say about the same topic over time.  Comparing the perspectives of people who have different points of view (for example, listener club members, staff of your partner organisations, and parents of young listeners).  Checking interview and FGD data or MSC stories against program documentation and other written evidence that can verify what interviewees reported. Triangulation of different sources of data Interviews (in-depth and group) Data from participatory techniques Observations and field notes MSC technique (stories and other data) Short questionnaire surveys
  • 13.
    13 Step 9: Makeconclusions and recommendations and prepare draft report Now that you have identified your main research findings and summarised the results of your analysis, you can begin to make some conclusions and recommendations about the ways your programs can be improved and any follow-up research that is needed. You should show how your interpretations justify your conclusions and recommendations. In addition, you should translate your recommendations into action plans that set out who will do what and by when. An example of the main headings in a data analysis report by EAN is shown below: Report on Analysis of Community Researchers Data Sixth Data Analysis Report Equal Access Nepal January 1 to May 31, 2010 Contents 1. Introduction 2. Sources of data 3. Participants’ profile 3.1.1. Gender 3.1.2. Age group 3.1.3. Occupation 3.1.4. Ethnicity 3.1.5. Education 4. Major findings 4.1. Saathi Sanga Manka Kura (SSMK) 4.1.1. Listening pattern 4.1.2. Feedback on the program Example of the triangulation of various types of M&E data about the impacts of the SSMK and Naya Nepal radio programs Along with our analysis of MSC stories, and notes from focus group discussions and in-depth interviews conducted by community researchers, data from our short questionnaire surveys and the many listener letters we receive indicate that both the SSMK and Naya Nepal programs are effectively meeting most of their key objectives. In a recent survey of 61 SSMK listeners, 44% reported that the program helped them the most in making decisions about personal change, while 40% said the program helped them the most in making decisions about education. Likewise, in a survey completed by 33 NN listeners, 45% indicated that the program gave them the most encouragement to conduct community level activities such as organising interaction programs and taking part in meetings to overcome delays in justice and security provision. The vast majority of respondents (90.9%) said that NN encouraged them the most to conduct the community activities, compared with four related radio programs which were given ratings of between 18 and 36% for this question. Our qualitative data indicates that the drama segment of both the SSMK and NN programs has the most powerful effect in encouraging listeners to take action and make empowering changes in their lives and in their communities. This finding was verified in our recent survey, which provided several examples of positive changes that resulted from listening to the drama segment and found that 82% of SSMK respondents and 83% of NN respondents rated it as the most liked segment of these radio programs.
  • 14.
    14 4.1.3. Feedback onvarious contemporary issues 4.1.4. Learnings and impacts 4.2 Naya Nepal (NN) 4.2.1. Listening pattern 4.2.2. Feedback on the program 4.2.3. Feedback on various contemporary issues 4.2.4. Learning and impacts 5. Recommendations to content teams 6. Constraints of the research 7. Conclusion Step 10: Seek feedback and validation Once you have prepared a draft report on your evaluation, it is important to ask program staff and others to critically review your initial analysis, recommendations, learnings and conclusions. The process of cross-checking your findings and evidence of impacts with others is important to enable valid judgements to be made about your findings. This can highlight biases and specific interests and can reveal contradictions in your data that may not be easily explained. Example of feedback on a data analysis report The following example illustrates the feedback on a draft report on the M&E team at EAN’s data analysis of community research data received from the SSMK and Naya Nepal content teams (provided in Track Changes in the report). This helped to increase the trustworthiness of our analysis. On a bi-monthly basis the M&E team shares the data analysis report with content team (CT) members for comments and feedback. Comments and feedback provided by the content team members are often related to doing more follow up research on the same issue or asking for some new issue to research. This process has helped to make the findings and analysis reports more trustworthy and useful to the content team members. Extract from report: One of the interviewee from Dadeldhura thinks that the program deals with the present situation of the country. If the program would also include more of the community issues like their problems, infrastructures, employment etc, it would be much better. Comment from CT: This is of course a good suggestion. NN does not deal with each and every issue though. So I would request the community researcher to talk about the audience limitations of the program so that the audience will be able to identify local issues based the topics NN deals with. Extract from report: As per the various community discussions held in research sites, we found that the listening trend of the program is gradually decreasing. The popularity of television programs (*) is found to be the major factor for the drop in listenership. Another factor is that people are more attracted towards local languages program covering their issues, aired from local FM stations (**). Comments from CT : * What is the major reason behind this? ** What are the local issues? Did they identify any particular issues?
  • 15.
    15 Based on thefeedback on your draft report and the validation process, you should revise your analysis and finalise your report. Step 11: Communicate your findings The next step is to share your findings with program staff and stakeholders, community members and donors. These findings can be used to help your program to better respond to local community needs and expectations, increase sustainability, and work more effectively. They can also be used to identify areas where further research is needed. At this stage, you will need to think about:  What you have found out and how can this information be of use to the overall development of your programs?  How can you best put your findings to use?  How can local community people benefit from this research and your findings?  How can this research best be used to identify other issues you need to explore?  What is the best way to share your findings with different groups? Analysis is an important step in putting your data to work and allowing it to be utilised in the community and by your organisation. This is an evaluation of part of your organisation’s work and what it has achieved, and it identifies its strengths and weaknesses. It is important to acknowledge successes as well as failures and negative impacts as this is the best way to learn more about how well your programs are working and how they can be improved. While program staff and donors may prefer to receive a written report, it is likely to be more useful to share your findings with the community using a range of methods such as community forums, newsletters and wall newspapers. This is also an excellent way to check the validity of your findings. Step 12: Implement recommendations and improve QDA system Now that you have shared your findings with others and obtained their feedback on your report and its recommendations, those responsible can begin to implement the recommendations. You can also begin to conduct any follow up research that may be needed. In addition, you should regularly review your QDA systems and processes to identify anything that’s not working well and how it could be made more effective, efficient and sustainable in terms of the resources and time you have available. Some final words This approach to QDA allows you and your programs to ground your evaluations in the wider social context in which your programs are working and to engage others in the QDA process. This makes it possible to describe direct and indirect, expected and unexpected impacts of your programs in great detail. This is a hugely valuable and rare resource and it places program staff and others in a good position to decide what needs to be done to improve your programs and projects. With such findings, you can PLAN actions, DO them, and continue to OBSERVE and REFLECT (i.e. research) how these new actions work or don’t work.
  • 16.
    16 Some of thesteps in QDA can be quite challenging, and some activities might be very time consuming, depending on what is required, but you always need to share what you have learned, and what you think is important to pass onto others. Good quality QDA allows you to get a good understanding what works and what does not work so well in your programs. This can help you to better meet your objectives and the needs of different social groups in the community.
  • 17.
    17 Appendix 1: Reportingformats for community researchers Example of a template for collecting information about participants and the research conducted Summary Report Daily Report Date: Name of Place: Number of participants: Male: Female: Ethnic: Dalit: Madheshi: Brahmin: Chhetri: Others: Age range (maximum participants)..............to.................years Objective: Tools used: Major issue discussed: Example of template for collecting demographic data about research participants S.N. Name Address Age Education Occupation Listening pattern NN SSMK 1 2 3 4 5 6
  • 18.
    18 Appendix 2: Databaseinterface used by Equal Access Nepal
  • 19.