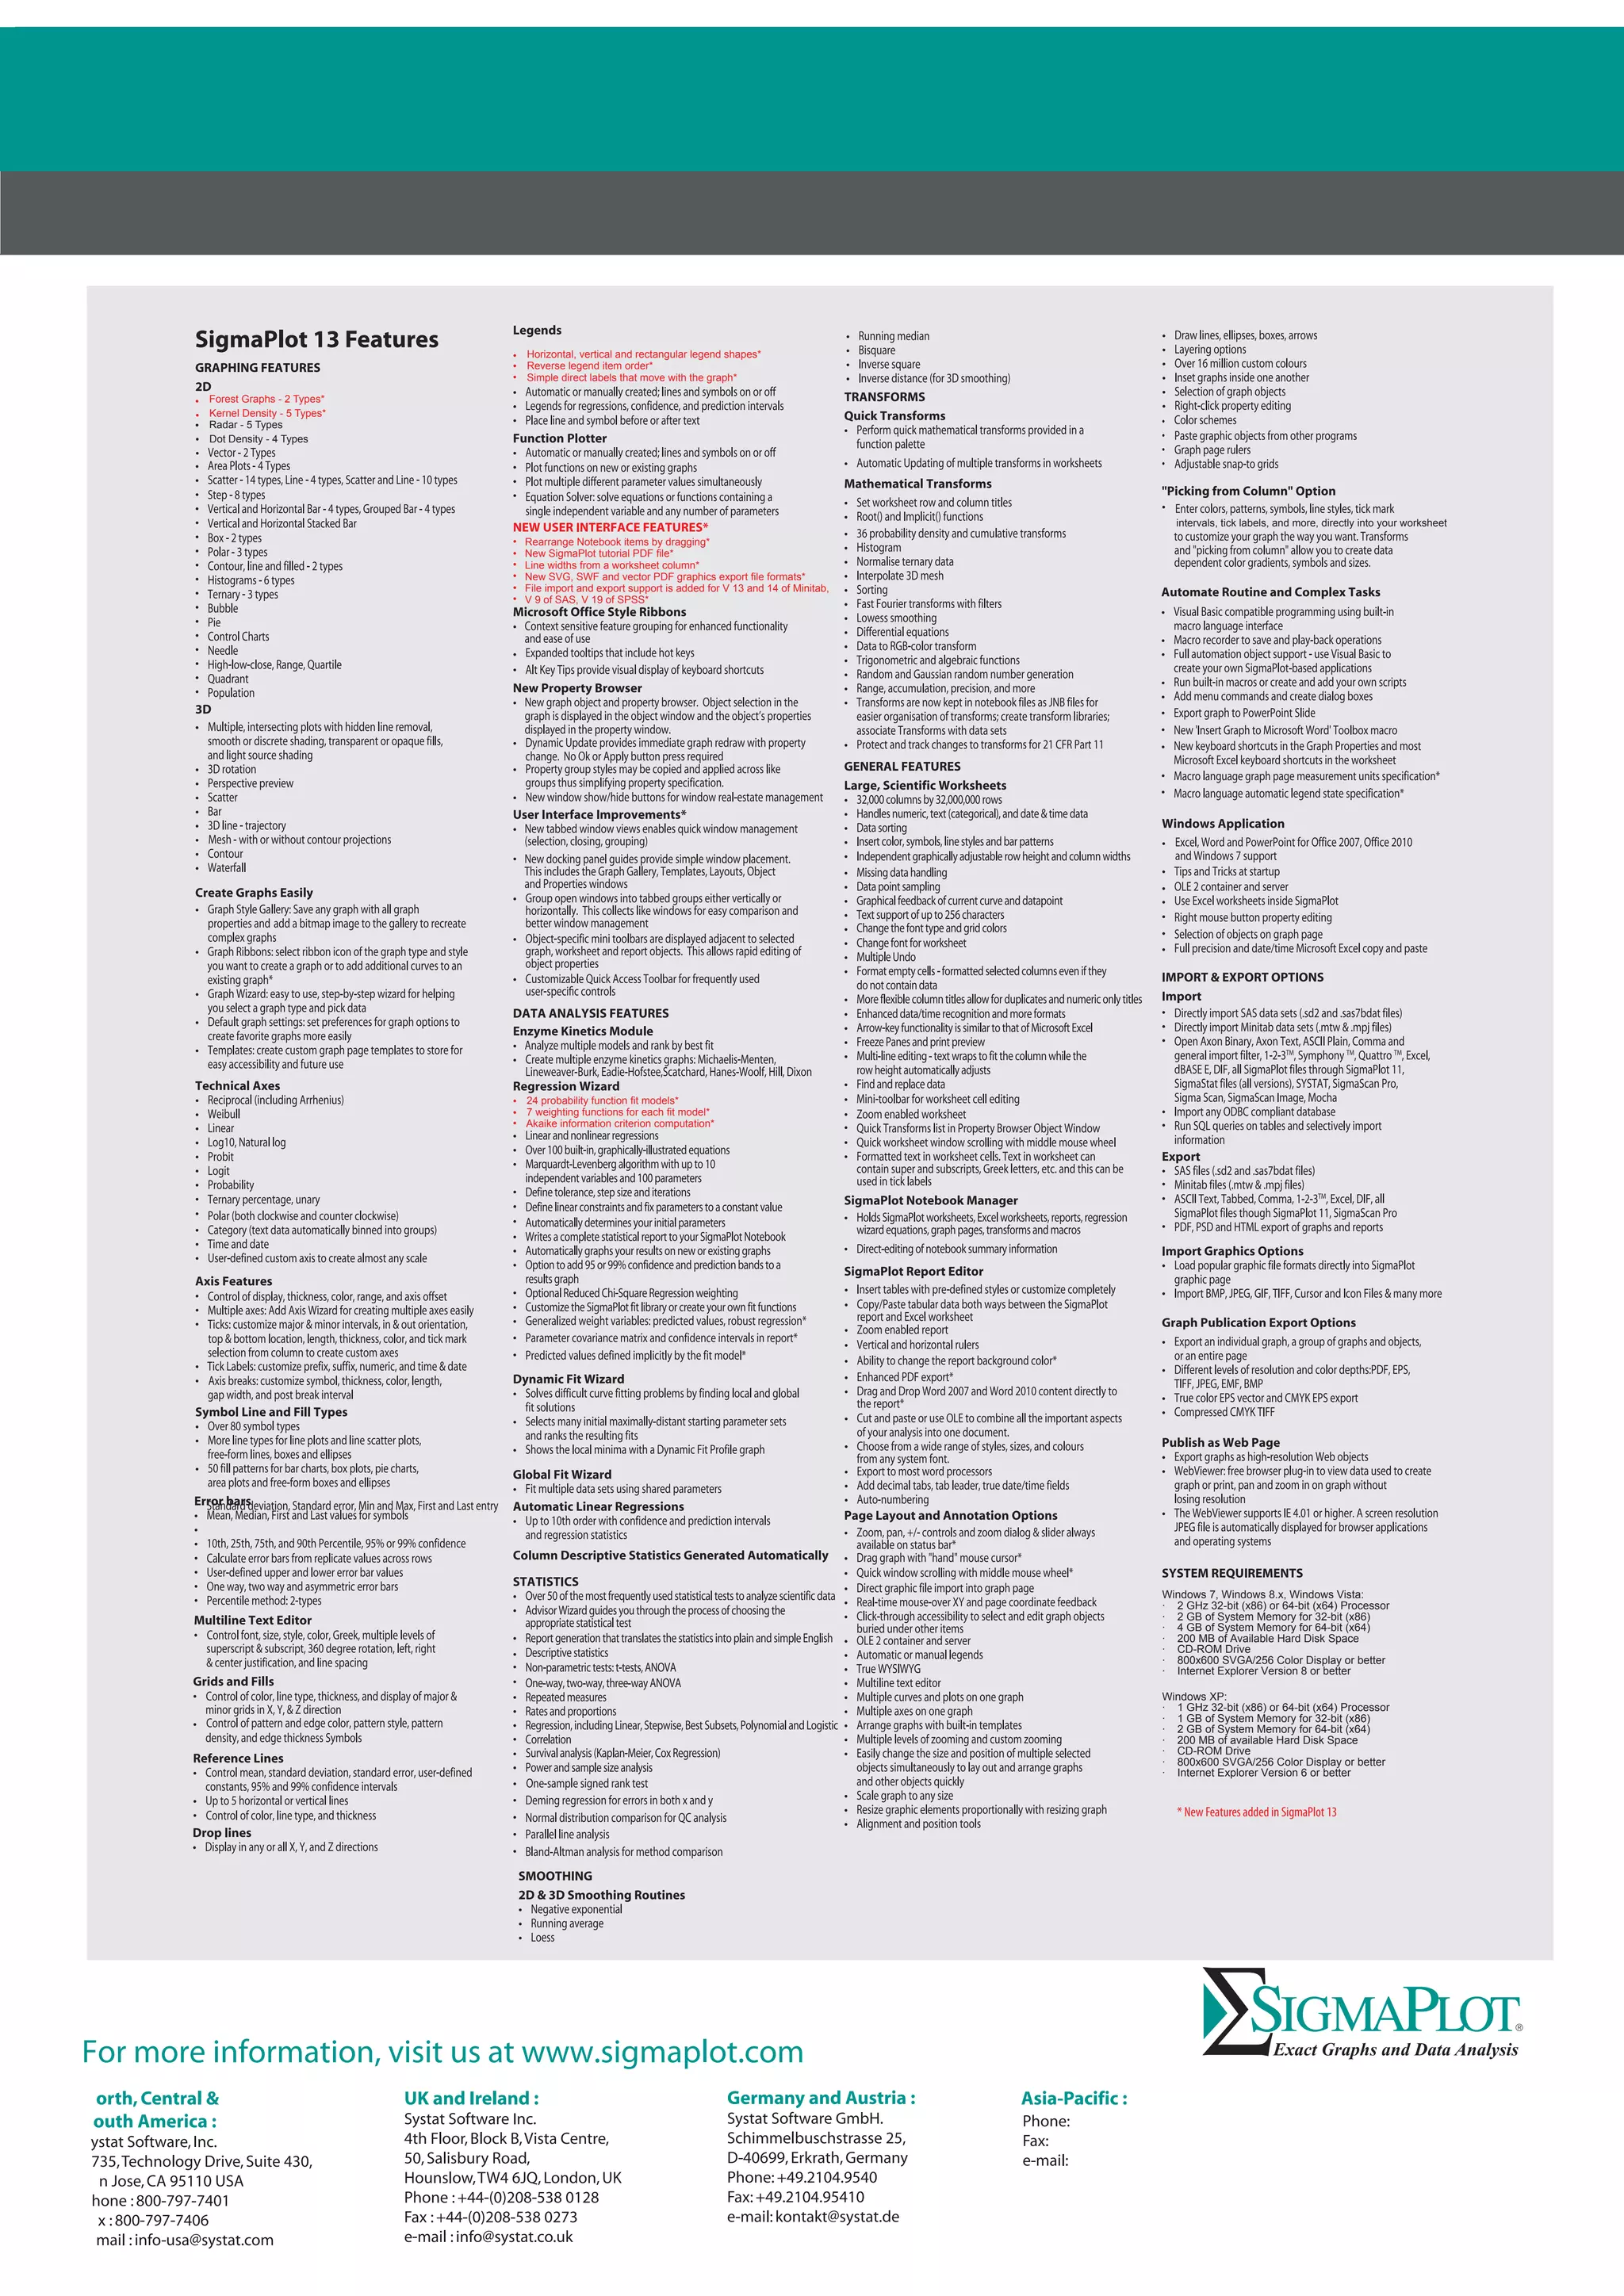
The document discusses new features in the latest version of SigmaPlot statistical analysis and graphing software. Key new features include additional graph types like forest plots and kernel density plots, more options for customizing legends, the ability to set line widths from data columns, and additional file export options. The software also includes more statistical models for curve fitting, new weighting functions, and an improved Akaike information criterion for model selection.
Using microsoft excel for weibull analysisMelvin Carter
A simple introduction to reliability analysis of components. Though this lacks explanations of the calculated steps it shows how simple analysis can be. Note that it only addresses the Weibull distribution. It does share how to look elsewhere if the Weibull shape parameter is not near the ideal three(3).
Predicting Moscow Real Estate Prices with Azure Machine LearningLeo Salemann
With only three months' instruction, a five-person team uses Azure Machine Learning Studio to predict Moscow real estate prices based on property descriptors, macroeconomic indicators, and geospatial data.
Principal Component Analysis, or PCA, is a factual method that permits you to sum up the data contained in enormous information tables by methods for a littler arrangement of "synopsis files" that can be all the more handily envisioned and broke down.
Principal Component Analysis and ClusteringUsha Vijay
Identifying the borrower segments from the give bank data set which has 27000 rows and 77 variable using PROC PRINCOMP. variables, it is important to reduce the data set to a smaller set of variables to derive a feasible
conclusion. With the effect of multicollinearity two or more variables can share the same plane in the in dimensions. Each row of the data can
be envisioned as a 77 dimensional graph and when we project the data as orthonormal, it is expected that the certain characteristics of the
data based on the plots to cluster together as principal components. In order to identify these principal components. PROC PRINCOMP is
executed with all the variables except the constant variables(recoveries and collection fees) and we derive a plot of Eigen values of all the
principal components
Cost Efficient PageRank Computation using GPU : NOTESSubhajit Sahu
Highlighted notes on:
Cost Efficient PageRank Computation using GPU
This paper discusses the use of Aitken extrapolated Power method for PageRank computation. However, the results are unclear whether the performance improvement is due to GPU implementation, or due to use of Aitken extrapolation. The paper mentions a good performance improvement for damping factor values close to 1, and very low tolerance values which are usually not used for PageRank computation. It needs to be cross-checked to see if Aitken extrapolation provides and reduction of iterations on CPU only (as the same effect would be observed on the GPU, only timings change).
This brief work is aimed in the direction of basics of data sciences and model building with focus on implementation on fairly sizable dataset. It focuses on cleaning the data, visualization, EDA, feature scaling, feature normalization, k-nearest neighbor, logistic regression, random forests, cross validation without delving too deep into any of them but giving a start to a new learner.
Factors affecting Design of Experiment (DOE) and softwares of DOED.R. Chandravanshi
What is an experiment ?
An experiment refers to any process that generates a set of data.
An experiment involves a test or series of test in which purposeful changes are made to the input variables of a process or system so that changes in the output responses can be observed and identified.
One of the best ways to analyze any process is to plot the data. Different graphs can reveal different characteristics of your data such as the central tendency, the dispersion and the general shape for thedistribution.
SPSS is widely used program for statistical analysis in social sciences, particularly in education and research. However, because of its potential, it is also widely used by market researchers, health-care researchers, survey organizations, governments and, most notably, data miners and big data professionals.
School of Computing, Science & EngineeringAssessment Briefin.docxanhlodge
School of Computing, Science & Engineering
Assessment Briefing to Students
Learning Outcomes of this Assessment
A2 - show awareness of a variety of graphics toolkits and select an appropriate one for a given task
A3 - discuss the capabilities of various input and output devices and their relationship to graphics programming
A4 - use appropriate mathematics to perform standard graphical transformations
A5 - application of graphics programming skills in a real-world application
Key Skills to be Assessed
C/C++ programming
Use of OpenGL API
Application of low level graphics principles & data management techniques for developing interactive graphics application
Critical Evaluation of tools used
The Assessment Task
Your task is to demonstrate your newly acquired skills in C and OpenGL programming. This will be achieved by producing a
demonstration application that will offer a simple visualisation comprising a collection of discrete objects located in a navigable
space. Fundamental to the successful completion of this assignment is careful consideration of the management of scene data,
using resizable dynamic memory structures, and the application of appropriate mathematical models for simulation, navigation and
interaction.
The form of this assignment will be a basic solar system simulation in which a dynamic collection of planetary bodies will be
simulated. These bodies will be represented by simple graphical forms and have the ability to show a historical trail of their
movement. The bodies motion should be defined by a simple gravitational system simulation which calculates forces based on the
masses of the bodies and uses this to derive discrete step changes to acceleration and velocity.Inital starting conditions for the
planetary bodies should be random (mass, position, starting velocity and material (colour)). Advanced solutions should consider the
actions taking place when collisions between bodies occur. In these cases the collision should be detected. The mass and
velocities of the bodies should be combined (thereby removing one of the bodies from the data structure) with the major body
taking priority. Ideally the size of the resultant body should be changed to reflect the enhanced mass. You should also provide
mechanisms to add bodies during the runtime of the simulation (based on random data) both at user request and to maintain a set
number of bodies in the system.
Assessment Title : Computer Graphics Assignment 1: OpenGL Programming - Solar System
Module Title : Computer Graphics
You are provided with an example solution to evaluate and a template project, including a maths library, camera model and basic
utilities as a starting point.
The implementation of the assignment problem will be assessed in the following areas
1. Design and implementation of a suitable dynamic data structure that will maintain an ordered list of the render-able objects with
facilities to add and remove entit.
This is an elaborate presentation on how to predict employee attrition using various machine learning models. This presentation will take you through the process of statistical model building using Python.
The French Revolution, which began in 1789, was a period of radical social and political upheaval in France. It marked the decline of absolute monarchies, the rise of secular and democratic republics, and the eventual rise of Napoleon Bonaparte. This revolutionary period is crucial in understanding the transition from feudalism to modernity in Europe.
For more information, visit-www.vavaclasses.com
A Strategic Approach: GenAI in EducationPeter Windle
Artificial Intelligence (AI) technologies such as Generative AI, Image Generators and Large Language Models have had a dramatic impact on teaching, learning and assessment over the past 18 months. The most immediate threat AI posed was to Academic Integrity with Higher Education Institutes (HEIs) focusing their efforts on combating the use of GenAI in assessment. Guidelines were developed for staff and students, policies put in place too. Innovative educators have forged paths in the use of Generative AI for teaching, learning and assessments leading to pockets of transformation springing up across HEIs, often with little or no top-down guidance, support or direction.
This Gasta posits a strategic approach to integrating AI into HEIs to prepare staff, students and the curriculum for an evolving world and workplace. We will highlight the advantages of working with these technologies beyond the realm of teaching, learning and assessment by considering prompt engineering skills, industry impact, curriculum changes, and the need for staff upskilling. In contrast, not engaging strategically with Generative AI poses risks, including falling behind peers, missed opportunities and failing to ensure our graduates remain employable. The rapid evolution of AI technologies necessitates a proactive and strategic approach if we are to remain relevant.
How to Make a Field invisible in Odoo 17Celine George
It is possible to hide or invisible some fields in odoo. Commonly using “invisible” attribute in the field definition to invisible the fields. This slide will show how to make a field invisible in odoo 17.
Operation “Blue Star” is the only event in the history of Independent India where the state went into war with its own people. Even after about 40 years it is not clear if it was culmination of states anger over people of the region, a political game of power or start of dictatorial chapter in the democratic setup.
The people of Punjab felt alienated from main stream due to denial of their just demands during a long democratic struggle since independence. As it happen all over the word, it led to militant struggle with great loss of lives of military, police and civilian personnel. Killing of Indira Gandhi and massacre of innocent Sikhs in Delhi and other India cities was also associated with this movement.
The Roman Empire A Historical Colossus.pdfkaushalkr1407
The Roman Empire, a vast and enduring power, stands as one of history's most remarkable civilizations, leaving an indelible imprint on the world. It emerged from the Roman Republic, transitioning into an imperial powerhouse under the leadership of Augustus Caesar in 27 BCE. This transformation marked the beginning of an era defined by unprecedented territorial expansion, architectural marvels, and profound cultural influence.
The empire's roots lie in the city of Rome, founded, according to legend, by Romulus in 753 BCE. Over centuries, Rome evolved from a small settlement to a formidable republic, characterized by a complex political system with elected officials and checks on power. However, internal strife, class conflicts, and military ambitions paved the way for the end of the Republic. Julius Caesar’s dictatorship and subsequent assassination in 44 BCE created a power vacuum, leading to a civil war. Octavian, later Augustus, emerged victorious, heralding the Roman Empire’s birth.
Under Augustus, the empire experienced the Pax Romana, a 200-year period of relative peace and stability. Augustus reformed the military, established efficient administrative systems, and initiated grand construction projects. The empire's borders expanded, encompassing territories from Britain to Egypt and from Spain to the Euphrates. Roman legions, renowned for their discipline and engineering prowess, secured and maintained these vast territories, building roads, fortifications, and cities that facilitated control and integration.
The Roman Empire’s society was hierarchical, with a rigid class system. At the top were the patricians, wealthy elites who held significant political power. Below them were the plebeians, free citizens with limited political influence, and the vast numbers of slaves who formed the backbone of the economy. The family unit was central, governed by the paterfamilias, the male head who held absolute authority.
Culturally, the Romans were eclectic, absorbing and adapting elements from the civilizations they encountered, particularly the Greeks. Roman art, literature, and philosophy reflected this synthesis, creating a rich cultural tapestry. Latin, the Roman language, became the lingua franca of the Western world, influencing numerous modern languages.
Roman architecture and engineering achievements were monumental. They perfected the arch, vault, and dome, constructing enduring structures like the Colosseum, Pantheon, and aqueducts. These engineering marvels not only showcased Roman ingenuity but also served practical purposes, from public entertainment to water supply.
Synthetic Fiber Construction in lab .pptxPavel ( NSTU)
Synthetic fiber production is a fascinating and complex field that blends chemistry, engineering, and environmental science. By understanding these aspects, students can gain a comprehensive view of synthetic fiber production, its impact on society and the environment, and the potential for future innovations. Synthetic fibers play a crucial role in modern society, impacting various aspects of daily life, industry, and the environment. ynthetic fibers are integral to modern life, offering a range of benefits from cost-effectiveness and versatility to innovative applications and performance characteristics. While they pose environmental challenges, ongoing research and development aim to create more sustainable and eco-friendly alternatives. Understanding the importance of synthetic fibers helps in appreciating their role in the economy, industry, and daily life, while also emphasizing the need for sustainable practices and innovation.
2024.06.01 Introducing a competency framework for languag learning materials ...Sandy Millin
http://sandymillin.wordpress.com/iateflwebinar2024
Published classroom materials form the basis of syllabuses, drive teacher professional development, and have a potentially huge influence on learners, teachers and education systems. All teachers also create their own materials, whether a few sentences on a blackboard, a highly-structured fully-realised online course, or anything in between. Despite this, the knowledge and skills needed to create effective language learning materials are rarely part of teacher training, and are mostly learnt by trial and error.
Knowledge and skills frameworks, generally called competency frameworks, for ELT teachers, trainers and managers have existed for a few years now. However, until I created one for my MA dissertation, there wasn’t one drawing together what we need to know and do to be able to effectively produce language learning materials.
This webinar will introduce you to my framework, highlighting the key competencies I identified from my research. It will also show how anybody involved in language teaching (any language, not just English!), teacher training, managing schools or developing language learning materials can benefit from using the framework.
Francesca Gottschalk - How can education support child empowerment.pptxEduSkills OECD
Francesca Gottschalk from the OECD’s Centre for Educational Research and Innovation presents at the Ask an Expert Webinar: How can education support child empowerment?
Unit 8 - Information and Communication Technology (Paper I).pdfThiyagu K
This slides describes the basic concepts of ICT, basics of Email, Emerging Technology and Digital Initiatives in Education. This presentations aligns with the UGC Paper I syllabus.
Macroeconomics- Movie Location
This will be used as part of your Personal Professional Portfolio once graded.
Objective:
Prepare a presentation or a paper using research, basic comparative analysis, data organization and application of economic information. You will make an informed assessment of an economic climate outside of the United States to accomplish an entertainment industry objective.
Model Attribute Check Company Auto PropertyCeline George
In Odoo, the multi-company feature allows you to manage multiple companies within a single Odoo database instance. Each company can have its own configurations while still sharing common resources such as products, customers, and suppliers.
2. Principal Components Analysis
Principal component analysis (PCA) is a technique for reducing the complexity of high-
dimensional data by approximating the data with fewer dimensions. Each new dimension is
called a principal component and represents a linear combination of the original variables. The
first principal component accounts for as much variation in the data as possible. Each
subsequent principal component accounts for as much of the remaining variation as possible
and is orthogonal to all of the previous principal components.
You can examine principal components to understand the sources of variation in your data. You
can also use them in forming predictive models. If most of the variation in your data exists in a
low-dimensional subset, you might be able to model your response variable in terms of the
principal components. You can use principal components to reduce the number of variables in
regression, clustering, and other statistical techniques.
Analysis of Covariance
ANCOVA (Analysis of Covariance) is an extension of ANOVA (Analysis of Variance) obtained by
specifying one or more covariates as additional variables in the model. If you arrange ANCOVA data
in a SigmaPlot worksheet using the indexed data format, one column will represent the factor and
one column will represent the dependent variable (the observations) as in an ANOVA design. In
addition, you will have one column for each covariate. When using a model that includes the effects
of covariates, there is more explained variability in the value of the dependent variable. This
generally reduces the unexplained variance that is attributed to random sampling variability, which
increases the sensitivity of the ANCOVA as compared to the same model without covariates (the
ANOVA model). Higher test sensitivity means that smaller mean differences between treatments will
become significant as compared to a standard ANOVA model, thereby increasing statistical power.
Akaike Information Criterion (AICc)
The Akaike Information Criterion is now available in nonlinear regression
reports. It is a goodness of fit criterion that also accounts for the
number of parameters in the equation. It also is valid for non-nested equations that occur, for example,
in enzyme kinetics analyses. Smaller AICc values are better and negative values will occur. The
difference between the AICc values for two different equations is what is of interest. If you find a
difference of 7 or more then the equations are significantly different. If the difference
is greater than 2 then the equation with the smaller AICc value should be considered as a candidate for
the best equation.
New Probability Functions for Curve Fitting
A total of 24 probability functions have been added to the curve fit library. These functions will augment
the variety of fit models that already exist. They also previously existed in the transform language where
they can be used for computing the values of probability density functions, cumulative distribution functions and their inverses. They
can be used to compute and verify a number of statistical measures such as significant probabilities, critical values of statistics,
confidence intervals, histogram comparisons, et cetera. Graphs of these functions will be easily
obtained using the Plot Equation facility. Equations involving these functions can be solved using
the Solver facility that is available from both the macro language and the Plot Equation dialog.
Nonlinear Regression Weighting
There are now seven different weighting functions built into each nonlinear regression equation
(3D are slightly different). As shown in one regression equation these functions are reciprocal y,
reciprocal y squared, reciprocal x, reciprocal x squared, reciprocal predicteds, reciprocal predicteds squared and Cauchy. The
iteratively reweighted least squares algorithm is used to allow the weights to change during each nonlinear regression iteration. In
this way “weighting by predicteds”, a commonly used method, can be obtained by selecting the
reciprocal_pred weighting option. Also, Cauchy weighting (select weight_Cauchy) can be used to fit an
equation to data that contains outliers and the effect of the outliers will be minimized. Users can create
their own weighting methods in terms of residuals and/or parameters to implement other robust fitting
methods.
Multiple Comparison Test Improvements
Two important improvements have been made. P values for the results of nonparametric ANOVA have
been added. These did not exist before. Also, multiple comparison P values were limited to discrete choices (0.05, 0.01, etc.). This
limitation no longer exists and any valid P value may be used.
Increase SigmaPlot's Power
with New Analysis Features
3. Analyze and Graph your Data with
Unparalleled Ease and Precision
Create Your Exact Graph in No Time
Create compelling graphs for publications,
presentations and reports.
Let the Interactive Graph Wizard lead you
through every step of graph creation
Choose from over 100 different 2D and 3D
graph types.
Control and customize the properties of
every graph element.
Use Dynamic Update to draw your graph
immediately after a property change.
Make graph changes in Graph Properties,
and on the graph page without closing
the Graph Properties dialog box.
Data Analysis Methods to Uncover
Information in your Data
Over 50 of the most frequently used
statistical tests with step-by-step
directions that do not require you to be a
statistician.
Now with ANCOVA and Principal
Components Analysis (PCA).
Fit your data easily and accurately with the
Regression Wizard, Dynamic Fit Wizard and
Global Fit Wizard. And now fit implicit
functions.
Plot mathematical functions with the
Function Plotter.
Use the Macro Recorder to automate
repetitive and complex tasks.
Fine Tune Every Graph Detail
The beauty and utility of SigmaPlot is its
ability to modify each graph object to
produce a graph that in total “tells the
story” of your research.
Numerous import/export capabilities for worksheets
and graphs.
Create the Exact Graph
for your research
Over 100 different 2D and
3D graph types with new
Forest and Kernel Density Plots.
Advanced Analysis Methods
Bland-Altman,
Dot-Density,
Enzyme Kinetics.
Tabbed Groups
Collect related graphs
in a tabbed group for easy
relationship to a worksheet.
Properties and Graph Interaction
Select Items on the page
without leaving the Graph Properties
dialog box.
Work Directly on the Page
Almost every object is selectable
Mini-toolbars allow direct
modification. Horizontal,
vertical and rectangular
legend shapes.
Simple Direct Labeling
New Color Schemes
Line Thickness from column
Put legend labels immediately next to
plots with flexible colors and
precise line thickness.
Rearrange Notebook and
Legend Items by Dragging
Put notebook and legend
items in a natural order.
Reverse legend item order.
Graph Properties
New Graph Properties Panel with
all graph categories displayed in a tree
The associated properties are
displayed on the right.
Multiple Methods for Zoom,
Pan and Drag
Select or modify objects on the graph,
or functions like zoom, while simultaneously
using Graph Properties.
Notebook Manager
Save multiple notebooks,
worksheets, graphs, reports,
transforms, equations and
macros.
Interactive Graph Wizard
A step-by-step graph
creation process.
Over 50 tests with complete
background statistical assumption
testing and appropriate
test suggestion.
Complete Advisory Statistics
with new ANCOVA and
Principal Components Analysis
Analyze and Create the Graph which Presents the Best Visual Representation of your
Research
SigmaPlot® is a scientific data analysis and graphing software package with advanced curve fitting, a vector-based programming
language, macro capability and over 50 frequently used statistical tests. SigmaPlot has the analytical features necessary to extract the
important information from your research data. With over 100 graph types and a user interface which allows detailed manipulation of
every graph object, you can create the exact graph to present your results.
Huge Worksheet and Associated
Programming Language
32,000,000 rows and 32,000 columns.
Vector Based computations.
Powerful Curve Fitting
Nonlinear - 155 built-in functions.
Dynamic – is your fit the best fit?
Global – fit shared data sets.
New Akaike Information Criterion
and weighting functions.
4. Generate the Graphs Quickly and Easily
with the New Interface Features
For more information and to download a trial version, visit us at www.sigmaplot.com
Rearrange items in your notebook by dragging.
Objects in a notebook section are not necessarily created in a
logical order. You can now drag items within a section to new
positions to place them more logically. A new SigmaPlot tutorial
The new tutorial makes creating graphs for the first time easy.
It starts with simple examples and gradually becomes more
complex.
Specify plot line widths from a worksheet column.
Line width values can now be entered in a worksheet column.
These values may be used within a graph or across
multiple graphs on the page.
New Vector Export File Formats
SVG (Scalable Vector Graphics), SWF (Adobe Flash Player) and Vector PDF file formats have been added. These are scalable formats
where no resolution is lost when zooming to different levels. SVG is the standard graphics format for the web and SWF can be used
with Adobe Flash Player. Because pdf is used so frequently, the vector PDF format is now attached to the Create PDF button on the
Home ribbon.
Updated Application File Formats
File import and export support has been updated to Versions 13 and 14 of Minitab, Version 9 of SAS and Version 19 of SPSS
> PDF Vector (Portable Document Format, *.pdf)
> SVG (Scalable Vector Graphics, *.svg)
> SWF (Adobe Flash Player, *.swf)
EXPORT TO >>
5. Legend Improvements
Legend Shapes
Vertical, horizontal and
rectangular legend shapes are
now available.
Reverse Legend Order
You can now select to reverse the legend item order.
This provides a more logical order for some graph types.
Mini-Toolbar Editing of Legend Items
Legend items may now be edited by clicking on the item and using the mini-
toolbar.
Direct Labeling
The legend can now be ungrouped and individual legend items placed adjacent to the
appropriate plots. The labels will move with the graph to maintain position with respect to
the graph. Since the label is adjacent to the plot, visual identification of each plot is now
much easier.
New Graphing Capabilities Enhance
Your Ability to create Publication Quality Graphs
New Graph Features
Forest Plot
A forest plot is one form of “meta-analysis” which is used to combine multiple
analyses addressing the same question. Meta-analysis statistically combines the
samples of each contributing study to create an overall summary statistic that is
more precise than the effect size in the individual studies. Individual study values
and their 95% confidence intervals are shown as square symbols with horizontal
error bars and the overall summary statistic as a diamond with width equal to its
95% confidence interval.
Kernel Density
The kernel density feature will generate an estimate of the underlying data
distribution. This should be compared to the step-like histogram. It has
advantages (no bars) and disadvantages (loss of count information) over a
histogram and should be used in conjunction with the histogram. They can be
created simultaneously.
Dot Density with Mean & Standard Error
Bars
The mean plus standard error bar computation, symbol
plus error bars, has been added to the Dot Density
graph. This enhances the other possible dot density
display statistics – mean, median, percentiles and
boxplot.
New Color Schemes
Ten new color schemes have been implemented.
Three examples are:
6. * New Features added in SigmaPlot 13
SigmaPlot 13 Features
Dot Density - 4 Types
Radar - 5 Types
intervals, tick labels, and more, directly into your worksheet
Kernel Density - 5 Types*
Forest Graphs - 2 Types*
Horizontal, vertical and rectangular legend shapes*
Reverse legend item order*
Simple direct labels that move with the graph*
Rearrange Notebook items by dragging*
New SigmaPlot tutorial PDF file*
Line widths from a worksheet column*
New SVG, SWF and vector PDF graphics export file formats*
File import and export support is added for V 13 and 14 of Minitab,
V 9 of SAS, V 19 of SPSS*
24 probability function fit models*
7 weighting functions for each fit model*
Akaike information criterion computation*
For more information, visit us at www.sigmaplot.com
Windows 7, Windows 8.x, Windows Vista:
· 2 GHz 32-bit (x86) or 64-bit (x64) Processor
· 2 GB of System Memory for 32-bit (x86)
· 4 GB of System Memory for 64-bit (x64)
· 200 MB of Available Hard Disk Space
· CD-ROM Drive
· 800x600 SVGA/256 Color Display or better
· Internet Explorer Version 8 or better
Windows XP:
· 1 GHz 32-bit (x86) or 64-bit (x64) Processor
· 1 GB of System Memory for 32-bit (x86)
· 2 GB of System Memory for 64-bit (x64)
· 200 MB of available Hard Disk Space
· CD-ROM Drive
· 800x600 SVGA/256 Color Display or better
· Internet Explorer Version 6 or better