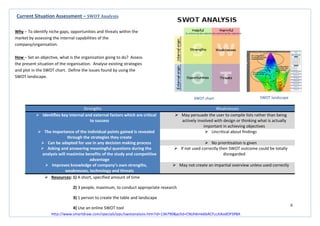
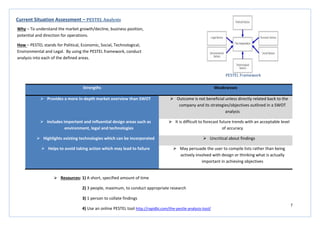
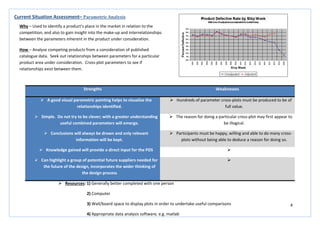
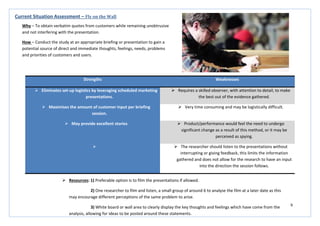
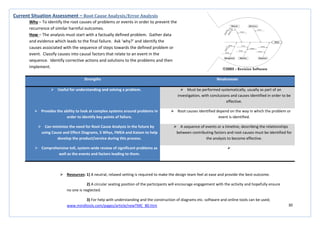
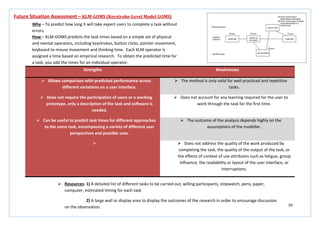
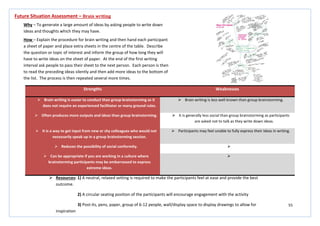
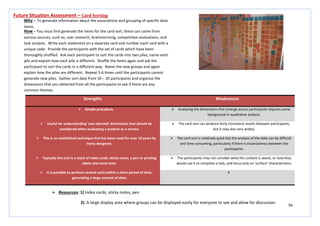
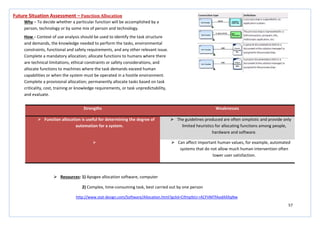
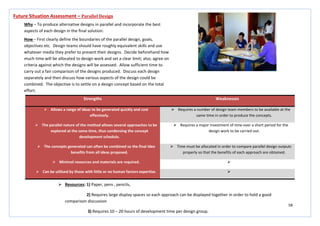
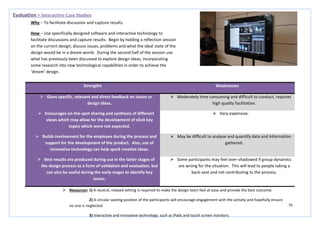
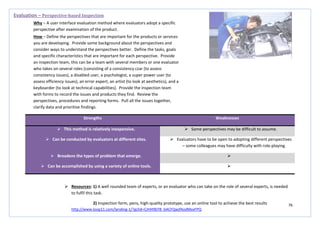
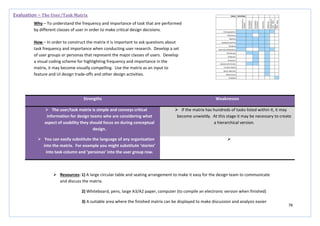
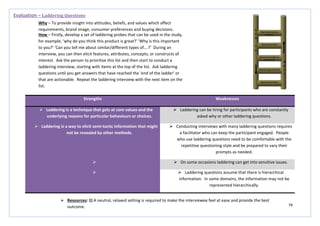
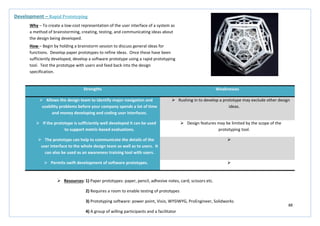
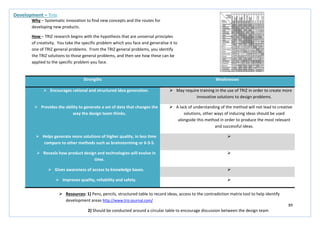
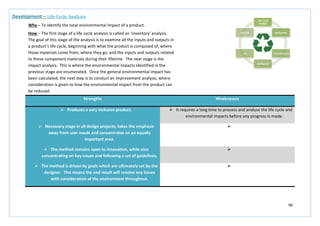
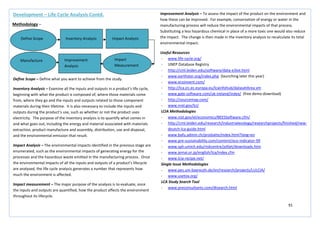
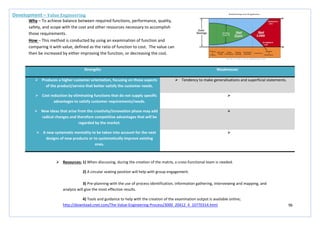
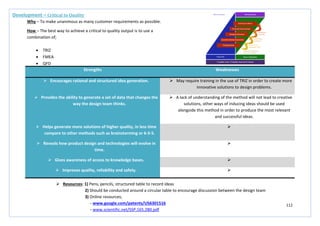
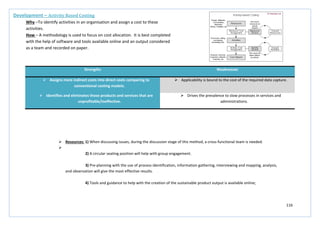
1
THE UNIVERSITY OF STRATHCLYDE, GLASGOW
Review of Design Methods and Tools
Innovative Problem Solving; The use of design methods towards
innovative problem solving and solutions in an engineering context.
Kerrie Noble, 3rd Year, MEng, PDE
Dr. Hilary Grierson, Department of Design Manufacture and Engineering Management
Abstract: This document contains a review of design methods and tools used within the design process. The methods have been grouped depending on the
stage at which they are most suitable used within the design process.
13/11/2012
2
Document 2 Overview ..................................................................................................................................................................................................................... 2
Current Situation Assessment.......................................................................................................................................................................................................... 2
Future Situation Assessment ........................................................................................................................................................................................................... 2
Evaluation ........................................................................................................................................................................................................................................ 2
Development.................................................................................................................................................................................................................................... 2
Implementation ............................................................................................................................................................................................................................... 2
3
Research
DeliverableDocument1
–ThreeDivisions
Research
Deliverable
Document2
Analysis
DeliverableDocument3–3Design
Matrices
Analysis
Company Groupings
Minerals
Division
Oil and Gas
Division
Power and
Industrial
Division
Review of Design Methods
and Tools
4
Report
DeliverableDocument4–Reportand
Appendices
Report
Project Overview Diagram
Document 2 Overview
This document provides a critical overview of available design methods and tools which can be used in the Silver Bullet process. The five stages of the
Silver Bullet process, the current situation, identifying what could be different, evaluation, further development and implementation have been addressed
in this document. The design methods and tools have been categorised into the five Silver Bullet stages and strengths and weaknesses of each method
have been identified. The information has come from many sources, including the web. (See deliverable document 4 for details of sources).
5
Current Situation Assessment
6
Strengths Weaknesses
 Identifies key internal and external factors which are critical
to success
 May persuade the user to compile lists rather than being
actively involved with design or thinking what is actually
important in achieving objectives
 The importance of the individual points gained is revealed
through the strategies they create
 Uncritical about findings
 Can be adapted for use in any decision making process  No prioritisation is given
 Asking and answering meaningful questions during the
analysis will maximise benefits of the study and competitive
advantage
 If not used correctly then SWOT outcome could be totally
disregarded
 Improves knowledge of company’s own strengths,
weaknesses, technology and threats
 May not create an impartial overview unless used correctly
Current Situation Assessment – SWOT Analysis
How – Set an objective, what is the organisation going to do? Assess
the present situation of the organisation. Analyse existing strategies
and plot in the SWOT chart. Define the issues found by using the
SWOT landscape.
 Resources: 1) A short, specified amount of time
2) 3 people, maximum, to conduct appropriate research
3) 1 person to create the table and landscape
4) Use an online SWOT tool
http://www.smartdraw.com/specials/ppc/swotanalysis.htm?id=136790&gclid=CNjJh6mk6bACFccJtAodOFSP8A
SWOT chart SWOT landscape
Why – To identify niche gaps, opportunities and threats within the
market by assessing the internal capabilities of the
company/organisation.
7
Strengths Weaknesses
 Provides a more in-depth market overview than SWOT  Outcome is not beneficial unless directly related back to the
company and its strategies/objectives outlined in a SWOT
analysis
 Includes important and influential design areas such as
environment, legal and technologies
 It is difficult to forecast future trends with an acceptable level
of accuracy
 Highlights existing technologies which can be incorporated  Uncritical about findings
 Helps to avoid taking action which may lead to failure  May persuade the user to compile lists rather than being
actively involved with design or thinking what is actually
important in achieving objectives
Current Situation Assessment – PESTEL Analysis
Why – To understand the market growth/decline, business position,
potential and direction for operations.
How – PESTEL stands for Political, Economic, Social, Technological,
Environmental and Legal. By using the PESTEL framework, conduct
analysis into each of the defined areas.
PESTEL Framework
 Resources: 1) A short, specified amount of time
2) 3 people, maximum, to conduct appropriate research
3) 1 person to collate findings
4) Use an online PESTEL tool http://rapidbi.com/the-pestle-analysis-tool/
8
Strengths Weaknesses
 A good visual parametric painting helps to visualise the
relationships identified.
 Hundreds of parameter cross-plots must be produced to be of
full value.
 Simple. Do not try to be clever; with a greater understanding
useful combined parameters will emerge.
 The reason for doing a particular cross-plot may first appear to
be illogical.
 Conclusions will always be drawn and only relevant
information will be kept.
 Participants must be happy, willing and able to do many cross-
plots without being able to deduce a reason for doing so.
 Knowledge gained will provide a direct input for the PDS 
 Can highlight a group of potential future suppliers needed for
the future of the design, incorporates the wider thinking of
the design process

Current Situation Assessment– Parametric Analysis
Why – Used to identify a product’s place in the market in relation to the
competition, and also to gain insight into the make-up and interrelationships
between the parameters inherent in the product under consideration.
How – Analyse competing products from a consideration of published
catalogue data. Seek out relationships between parameters for a particular
product area under consideration. Cross-plot parameters to see if
relationships exist between them.
 Resources: 1) Generally better completed with one person
2) Computer
3) Wall/board space to display plots in order to undertake useful comparisons
4) Appropriate data analysis software, e.g. matlab
9
Strengths Weaknesses
 Eliminates set-up logistics by leveraging scheduled marketing
presentations.
 Requires a skilled observer, with attention to detail, to make
the best out of the evidence gathered.
 Maximises the amount of customer input per briefing
session.
 Very time consuming and may be logistically difficult.
 May provide excellent stories  Product/performance would feel the need to undergo
significant change as a result of this method, or it may be
perceived as spying.
  The researcher should listen to the presentations without
interrupting or giving feedback, this limits the information
gathered and does not allow for the research to have an input
into the direction the session follows.
Current Situation Assessment – Fly on the Wall
Why – To obtain verbatim quotes from customers while remaining unobtrusive
and not interfering with the presentation.
How – Conduct the study at an appropriate briefing or presentation to gain a
potential source of direct and immediate thoughts, feelings, needs, problems
and priorities of customers and users.
 Resources: 1) Preferable option is to film the presentations if allowed.
2) One researcher to film and listen, a small group of around 6 to analyse the film at a later date as this
may encourage different perceptions of the same problem to arise.
3) White board or wall area to clearly display the key thoughts and feelings which have come from the
analysis, allowing for ideas to be posted around these statements.
10
Strengths Weaknesses
 Builds employee involvement within the project.  Requires a skilled observer with attention to detail to make
the best of the outcome.
 Generates relevant, quantifiable data and may provide
excellent stories.
 Time consuming and may be logistically difficult.
 Provides a deep and relevant understanding of how people
really use your service/product.
 Wider ethnographic research is required to maximise the
output from this particular type of research.
 Provides a more holistic view of how a complex
system/product works, including identifying the interaction
between the user, the product and the organisation.

Current Situation Assessment – Observation and Shadowing
Why – To understand how people behave within a given context.
How – Create a set amount of time to observe or shadow someone of
particular interest in the area of the project. Note observations that are
made, paying particular attention to problems or issues which arise.
 Resources: 1) Photographs and visual aids will help as a reference at a later date. Displaying them in a ‘mood-board’
style may be useful.
2) Access to other forms of ethnographic research, (visual, video etc.)
3) An ‘inclusive’ group discussion of findings may help to spark ideas, may be best to have a circular table
with all the photographic evidence spread in the middle.
11
Strengths Weaknesses
 May be able to provide information on aspirations,
emotional reactions and other hidden/non-spoken
information.
 Expensive in terms of time and travel costs.
 Easier to conduct than group interviews and allows
involvement of the individual to be built within the process.
 Requires good interview skills.
 Provides relevant data and also may uncover information
that wouldn’t be brought up in a group situation.
 Unstructured interviews may lead to inappropriate data being
gathered and result in the interview taking a direction which
was unhelpful and unforeseen. Making it difficult to analyse
and quantify results.
 A one-on-one situation allows for the clarification of points
between the individual and the researcher, this means there
can be no misinterpretation of meaning.
 May make interviewees self-conscious.
Current Situation Assessment – Individual Interviews
Why – To gain a deeper insight into people’s needs and perspectives.
How – Can be organised around structured questions, follow a more open
format through semi-structured questions, or be unstructured with no prior
questions. The interview may take an empathic turn where the exchange of
questions is not just seen as scientifically neutral or objective – instead it is a
process of collaboration.
 Resources: 1) A neutral, relaxed setting is required to make the interviewee feel at ease and provide the best outcome.
2) Early in the design process the structured approach will be more useful; a structured set of questions will be
needed. Could use Survey Monkey to help with this.
12
Strengths Weaknesses
 The time required, the number of people needed to conduct the
questionnaire and the costs are all very low.
 An expertise in questionnaire structuring will be required in order to
achieve the best result from the activity and to ensure the
information collected is relevant.
 A good source for gathering research which is unattainable
through the use of other methods.
 You may incur low response rates or inaccuracies within the
responses which will be of no relevance to the research. There is no
opportunity to clarify responses given.
 Helps to set an early design direction, by canvassing opinion, and
helps to support further investigation.
 The structured format and length of the questionnaire may restrict
the freedom of response given.
 Good ability to reach a large variety of people within a very short
time scale.
 May lead to unrealistic expectations.
 Yields relevant, quantifiable data which is easy to summarise. The
anonymity of the data collected may also encourage honesty.

Current Situation Assessment – Questionnaires and Surveys
Why – Provides qualitative and quantitative information enabling a comparison
of different responses to the same set of structured questions, enabling an
insight into users’ thoughts and concerns.
How – Questionnaires should be as visually clear and as inviting as possible.
Can be structured using three types of questions; open – answers can be
anecdotal or open-ended; structured – requiring fixed answers such as ‘yes’ or
‘no’; and semi structured – containing both open and structured questions.
Normally conducted on a random basis in a public area or on the internet, and
in forums.
 Resources: 1) The use of web forums and user forums will help increase response rates.
2) Use of programmes, such as Survey Monkey, will help to ensure the layout and style of the
questionnaire is correct and easy to use.
13
Strengths Weaknesses
 Provides relevant and quantifiable data.  Does not build employee involvement within the process as
the method is best conducted on an individual basis.
 The ability to search for key components, with easy access
over the internet means the method is fast and easy to use.
 Not necessarily focused on HRD (Human Resource
Development) – more of a technical method which focuses on
numbers and technical data.
 Inexpensive, most information can be gathered for free from
the internet.
 May not identify causes, problems or concerns within the
particular area of interest.
 May build management involvement within the design
process as they may be able to supply original organisational
documents.
 May not provide visibility for the objective of the research or
the direction of the project as a result of the research findings.
Current Situation Assessment – Organisational Documents
Why – To attain an overview of the business and gather technical data on the
product/issues which are being considered.
How – Organisational websites will contain relevant documents which can be
accessed. The Kompass Directory and CBD –Current Business Directories will
provide information for companies from many industrialised countries. For US
companies, the Thomas Directory will provide relevant information for some
companies. Technical Indexes Limited also produces Product Data Books
which can help to provide information.
 Resources: 1) Computer, internet access, access to organisational documents from management
2) Kompass Directory, Engineer Buyers’ Guide, Technical Index Limited, CBD (Current British Directories),
Thomas Directory, specialist libraries, sheets published by the Engineering Science Data Unit
3) One researcher to carry out activity on an individual basis
14
Strengths Weaknesses
 Provides ability to clearly inform the design process by
observing real activities and behaviours.
 Requires a large allocation of time and high expertise in order
to achieve an acceptable output which has been highly
analysed with a high attention to detail.
 Has the ability to verify that a chosen solution is robust
enough to meet the stated requirements, and any
unanticipated changes that it may introduce in use.
 There is a high risk of misunderstanding or misinterpreting an
observation.
 Provides both a quantitative and qualitative analysis of the
data obtained.
 The absence of relevant questions will decrease the suitability
of the information gathered, with a risk the study will no
longer be relevant.
 Allows for first-hand interaction with the user with the ability
to question actions to gain a deep understanding.
 May infringe on the rights of the participant’s privacy.
Current Situation Assessment – Day in the Life
Why – To gain a user insight and an in depth understanding.
How – Undertake a study in which the designer follows the subject through a
typical day, observing and recording events to create an accurate picture of
what is happening throughout the day. This may need to be repeated over
several days in order to gather a balanced perspective. Map the outcome, or
illustrate through a storyboard, to show what happened, in order to identify
problem areas, and to illustrate how time is assigned to various activities.
 Resources: 1) Notebooks, cameras, pens, paper, voice recorders, Skype, sms messaging, software
http://directmailmac.com/
2) A large wall or display area to display the outcomes of the research in order to encourage discussion
on the observation.
15
Strengths Weaknesses
 Allows consideration of sensitive areas of user need that
require private disclosure.
 Requires a large amount of time and expertise in order to
complete a high quality analysis of the results from the probe.
 Enables access to areas of research which the designer
cannot gain through interview or observation.
 The main objective is to activate the user to describe their
insight in a more creative way; if the outcome is not as
anticipated or the user is detached from the process the
outcome will not be relevant.
 Helps to set an early design direction with direct
identification problematic areas and concerns.
 Difficult to get an answer rate which is suitable for
generalisation.
 Only requires input from the design team to analyse the
results and therefore comes at a relatively low cost.
 It is assumed that the participant will have high motivation to
complete the study; this assumed high motivation may give
distorted results.
 High level of user interaction with the design process. 
Current Situation Assessment – Design Probe
Why – To provide a self-disclosed insight into people’s lives.
How – Also known as cultural probes or user diaries, the designer prepares a
research kit which is given to the user to record aspects of their lives
autonomously, independent of the designer. May be prepared for a specific
user, given to many users, or placed in an environment to collect information,
more generally, from users of that space.
 Resources: 1) Notebooks, cameras, pens, scissors, stickers, postcards, diaries, maps, question cards, tools for
mapping and drawing.
2) A large wall or display area to display the outcomes of the research in order to encourage discussion
on the observation.
16
Strengths Weaknesses
 Gives a concise reference of all of the key points found from
research which can be easily shared amongst the design
group and with others involved in the design process.
 Takes time to compile properly and does not add any
development to the product, in terms of design, during this
time.
 Good tool for eliminating unnecessary information and
allows the group to refocus its search after a wide area of
research.
 Needs to be believable in order to work effectively as a tool.
 Allows for reflection and a check-back to the design brief.
Allowing the designer to take back full control of the process.
 Requires a great deal of expertise to ensure valuable
information is included and the persona is believable.
 Can help to both stimulate and evaluate new design
concepts.

 Can help with the justification of new innovations to
stakeholders and the testing of ideas when access to the user
is not available.

Current Situation Assessment – Design Persona
Why – To bring together people’s needs and user data and combine it in such a
way as to bring it to life for the designer.
How – Personas are figurative models, as opposed to abstract models, which
are constructed to resemble real users, right down to photographs,
background information and personal history. The most relevant user, market
and data research will be combined with these areas in order to make a
fictional character which will represent the target consumer within the given
market.
 Resources: 1) A display area for the finished document so the design team have constant and instant access
2) Photographs, previous research, internet, computer
.
17
Strengths Weaknesses
 Enables design teams to analyse tasks and gain a deeper
insight through repetitive viewing.
 Requires moderate expertise, cost and a large number of
people to be involved over a long period of time.
 Produces a good contextual insight, especially when
exploring the effectiveness of new prototypes in the
development stage of the design process.
 Observer bias and emphasis play a role in the outcome of the
activity.
 Provides a much more comprehensive perspective of the user
and their environment then other research methods.
 Information and results are highly dependent on the
researcher’s observations and their interpretations of these.
 Behaviour observations are best understood when observed
within their natural environment and video ethnography
allows for this.
 Quantitative analysis is almost impossible due to the
qualitative nature of the method.
Current Situation Assessment – Video Ethnography
Why – To gather video-based evidence and gain an insight into user behaviour.
How – Use a video camera to capture everyday events as they happen, within
a set context. Capture people’s interactions with one another and the
environment around them.
 Resources: 1) Notebooks, cameras, pens, diaries, maps, question cards, tools for mapping and drawing.
2) A large wall or display area to display the outcomes of the research in order to encourage discussion
on the observation.
18
Strengths Weaknesses
 A very quick method for talking to a wide variety of people
and gaining a contextual view of a particular topic.
 Permission must be sought from forum administrators as the
designer will be joining the forum for a professional purpose.
 The expertise, time, cost and number of people required to
carry-out this method are all very low.
 Involves ‘stories’ about behaviour and do not examine actual
user/stakeholder behaviour.
 It enables the building of a picture on a subject where very
little information is formally available or when access to the
user is limited.
 The data is classed as self-report data and depends on the
participant’s truthfulness and recall accuracy. What people
report may be quite different from what they actually do.
 Has an open-ended quality which focus groups cannot
achieve.
 Dominant participants can skew the results. Conflicts and
power struggles can alter the group dynamics and lead to a
non-creative environment.
 Encourages constructive and on-going discussion. 
Current Situation Assessment – Web Forum
Why – To gain general insights into a specific topic.
How – If a web forum is an online community that focuses on a shared
interest or experience. If a forum exists that is relevant to the interest of the
design/project then specific questions can be posted for the online
community to discuss and respond to. The designer may also find general
insights by reading archived posts. The forum can also be used to post
information on more detailed surveys and questionnaires.
 Resources: 1) Computer, an established forum or the construction of a forum
2) If required seek permission from the administrator and post a pre-planned set of questions.
19
Strengths Weaknesses
 Can help in the exploration of relationships between the
developed product and suppliers with consideration given at
an early stage in the design process.
 Concentrating on only five features may narrow the research
conducted at an early stage, leading to discarding of some
important information.
 Increases ideas and discussion on improving product
differentiation during development.
 A clear market must be known before commencing the study
otherwise the outcome will be vague and of little use to the
product development.
 Can help with further identifying what competitors are doing
and how successful they are.
 The model does not consider non-market changes, such as
political issues, which can be key and highly influential during
the design and launch of a new product.
 Shown in a more visual and succinct way than that of the
PESTEL and SWOT analysis.

Current Situation Assessment – Porter’s Five Forces
Why – To model the industry/business market which the new product/service
will enter and show how five main forces influence that particular market area.
How – Take the five forces – supplier power, threat of new entrants, threat of
substitutes, buyer power and threat of rivalry – and conduct research into
who, what, where, why and when these forces will affect the
industry/business market for the new product/service which is being
developed.
 Resources: 1) post-its (to help brainstorm key issues to include in the model), large A3 paper, markers
2) A circular seating position for a group of around 6 people to encourage discussion during the creation
visual graphic
3) A large wall space to display the outcome and provide a focus point during the rest of the design
process
20
Strengths Weaknesses
 Provides a deep understanding of the theoretical
requirements of the user, something which cannot be tested
during methods such as empathic modelling.
 The outcome is entirely based on designer perceptions and is
estimated through the use of some user input. This may lead
void outcomes and a non-relevant product for the market.
 Quick to complete with clearly visible problematic areas,
meaning there can be little misinterpretation and little
analytical skills are needed.
 It is difficult for the designer to remain objective; there is an
urge to become bias towards one type of result.
 Gives a comprehensive coverage of a wide variety of user
related areas.

Current Situation Assessment – Assessing Capability Levels
Why – To assess the capability a product demands in order to use it.
How – A person’s capability is split into seven main categories; vision, hearing,
thinking, communication, locomotion, reach and stretch, and dexterity. The
ability required by the product during use and the actual ability of the user are
plotted against each other, in all seven categories, allowing comparison and
identification of problem areas.
 Resources: 1) post-its, A3 paper, markers, computer
2) A circular seating position to encourage discussion during, and after, the creation of the visual ability
representation
3) A wall space to display the outcome
21
Strengths Weaknesses
 The method is valuable and powerful in terms of the
outcome it has the potential to produce.
 Requires expertise and intelligent application in order to find
the right ‘why’.
 Can produce corrective and preventative action as it can
produce enormous improvements to the smallest area of the
design.
 There is a want for the designer to stop at the first or second
answer as they become blinded by the symptoms or setting for
the first ‘apparent’ cause.
 Can create a situation where all of the ‘right’ people are
included in the process of sitting in a room and discussing the
possible root causes of a given defect within a design. (By
right people it means a mix of disciplines from across the
design process).
 There is a risk of accepting answers which are too simple due
to ‘kneejerk’ answers given to questions.
Current Situation Assessment – 5 Whys?
Why – To dig below the outward symptoms of a problem in order to find its
real root cause.
How – The method involves asking why five times in succession. The answer
to one question should lead you to asking the next why, although it may not
always be possible to get an immediate answer to the next question.
 Resources: 1) post-its, A3 paper, markers,
2) A circular seating position to encourage discussion during, and after, the creation of the visual ability
representation and a wall space to display the outcome and encourage further discussion and development
3) A group of 6 – 12 people will provide the best and most comprehensive outcome
22
Strengths Weaknesses
 Gathers detailed information about the user over a
prolonged period of time.
 All the information gathered is self-reported, so the outcome
will be highly dependent on the honesty and open-ness of the
person responsible for keeping the diary.
 Feedback is often provided while the user is interacting with
the product so there is less of a lag, which is evident in other
methods.
 Involves ‘stories’ about behaviour and do not examine actual
user/stakeholder behaviour.
 Encourages constructive and on-going discussion.  Dominant participants can skew the results. Conflicts and
power struggles can alter the group dynamics and lead to a
non-creative environment.
 This type of study avoids cohort effects as the study is
conducted on one group of people over time, rather than
studying lots of different groups of people.

Current Situation Assessment – Diary Study
Why – To track specific items, users or behaviour.
How – The study requires users, or observers of users, to keep track of
activities or events in the form of a diary or log for a particular period of time.
Specific items such as mobile device usage, use of personal calendars,
coursework or general activities which can take place in 30 minutes every day
can be tracked. Diary entries can include text accounts of events, pictures,
video, audio, sketches and voice-mail.
 Resources: 1) Notebooks, cameras, pens, diaries, maps, question cards, tools for mapping and drawing.
2) A large wall or display area to display the outcomes of the research in order to encourage discussion
on the observation.
23
Strengths Weaknesses
 Generate effective contextual data which is presented in an
accessible form.
 Is only able to capture impressions of lifestyle rather than full
descriptions.
 Represents a wide sample of users over a short period of
time.
 Users are left unsupervised to carry out the study; therefore
they may not follow the study instructions correctly,
corrupting the result of the study.
 Captures attitudinal and lifestyle data more naturally than
other formal methods.
 Users are free to take pictures of their choice, however this
may lead to accidental or intentional discarding of what may
be important information.
 Enables efficient, visual scanning of the photographs from
several users.

Current Situation Assessment – Photo Study
Why – To report important aspects of the users’ lives and the context
surrounding them.
How – A sample of users are given a set of ‘missions’ to take photographs
which highlight important aspects of their lives and day to day context. These
may be things that they value, cause problems, generate certain feelings etc.
Data from the study will then help to highlight opportunities for new
technologies and possible barriers to their acceptance.
 Resources: 1) Envelopes and paper outlining the required missions, cameras, software to assemble images
2) A large wall or display area to display the outcomes of the research in order to encourage discussion
on the observation.
24
Strengths Weaknesses
 Identifies significant user concerns which may not have been
evident during other research.
 May be hard for the designer to maintain an objective view
with previously established bias towards particular design
ideas and features.
 Builds teamwork across the design team and other business
areas which may be involved.
 Has no direct contact or input from a user’s perspective
meaning the result may be estimated an unreliable.
 Consolidates lots of customer data into meaningful design
criteria.

 Involves the entire design team so that a mutual
understanding of all of the data can be shared.

Current Situation Assessment – Claims Analysis
Why – To examine the positive and negative consequences of design features
that are described in current or future scenarios of use.
How – A ‘claim’ is a statement of the consequences of a specific design
feature or artefact on users and other stakeholders. These ‘claims’ are made
for several design features and are discussed among the design team, with
input from various knowledge areas and business sectors.
 Resources: 1) Post-its, pens, wall/display space
2) Circular seating position to encourage discussion and ensure everyone feels included
25
Strengths Weaknesses
 Generates detailed, precise information on the nature of
expert performance in a specific task of interest.
 Analysis of the information gathered during the task can be
very time-intensive.
 When implemented correctly the analysis can be a highly
valid source of information on expert cognitive processes.
 The task analysis does not always capture other non-cognitive
attributes necessary for accomplishing results.
 Provides systematic procedures for ascertaining expert
cognitive processes.
 The results of the task analysis can be misleading when expert
users have performance capabilities above that of others.
Current Situation Assessment – Cognitive Task Analysis
Why – To deeper understand activities which require a lot of cognitive activity
from the user.
How – The steps contained within a cognitive task analysis are; mapping the
task to be analysed, identifying the critical decision points within the task,
clustering, linking, and prioritising them, and characterising the strategies
used.
 Resources: 1) Make use of a wide range of available methods for help with conducting a cognitive task analysis such
as; applied cognitive task analysis (ACTA), critical decision method (CDM), skill-based CTA framework, task knowledge
structures (TKS) and the cognitive function model (CFM)
2) A large wall or display area to display the outcomes of the research in order to encourage discussion
on the observation.
3) Circular seating position to encourage discussion and ensure everyone feels included
4) A defined list of tasks, frameworks to help conduct the analysis, willing participants, pens, paper,
computer, a mixed group of expertise to help with analysis and outcome, group of 6-12 people
26
Strengths Weaknesses
 The approach is very simplistic to understand and conduct.  The method is not highly structured.
 The method can highlight concepts which are hard to
understand.
 The expert needs to have an awareness of concepts for a
particular design project in order to relay relevant information.
  The non-expert may feel intimidated if the expert’s corrections
are too harsh.
Current Situation Assessment – Teach back
Why – To extract information from experts that would be useful for gathering
requirements, learning about work flow and understanding mental models.
How – A subject matter expert is asked to describe a concept, task or
something else related to a particular domain or product. The non-expert
listens carefully to the expert. The non-expert is then asked to ‘tech back’
what the expert had previously explained. When the non-expert is teaching
back what they have learned, the expert corrects any misinterpretations,
errors or simplifications. The session is then repeated with another expert
who teaches the non-expert. The transcripts from all sessions are then
examined for common misinterpretations, errors or simplifications.
 Resources: 1) A quiet room in which a conversation can be held without interruptions, with a relaxed setting and
atmosphere
2) Pens, paper (to record what is said and any misinterpretations, errors or simplifications)
27
Strengths Weaknesses
 More meaningful then flow charts or other technical
diagrams for conveying the user experience.
 Interaction between the storyboard and the user is limited.
 Does not require programming skills.  Project team members may be reluctant to hand draw if they
feel they are bad at it.
 Does not require artistic skills.  There are few data on the effectiveness of storyboards for
user interface design.
 Provides a quick way to sketch ideas.  Interactive, non-linear storyboards are more desirable but take
more time to develop.
 Complements verbal scenarios.  Not practical for detail design or covering all use cases.
 Provides a way to organise use cases into a coherent
description of users’ actions.

Future Situation Assessment – Storyboard
Why – To illustrate the interaction between a person and a product in a
narrative format.
How – Firstly, you need to decide what to include. Understand the users, their
backgrounds and goals, the system and its features. Put together a design
team and brainstorm about the storyboard. Identify people and artefacts in
the storyboard and develop the storyboard scenarios. Identify key frames
within the storyboard and develop the storyboard around these.
 Resources: 1) Paper, pens, pencils, large whiteboard (to brainstorm ideas), software tools (such as power point, Photoshop
and Illustrator.
2) Requires large display spaces so each approach can be displayed together in order to hold a good discussion
28
Strengths Weaknesses
 Requires almost no facilitation or moderation, like a
conventional brainstorm, the group can feel free to
contribute at their own free will, more formal discussions will
take place once the brainstorming has finished.
 Requires a robust dedication to quantity and not quality.
 It is a useful way to get over ‘design blocks’ that are slowing
development.
 Can, at times, seem chaotic and intimidating.
 More active and engaging than traditional brainstorming,
activity is seen to increase creativity.
 May not be appropriate for some business or international
cultures.
Current Situation Assessment – Postcard Portraits
Why – To gain familiarisation with users’ needs and problem areas in order to
generate ideas.
How – Draw a quick sketch/portrait of potential users and problems within
the design project area. Use these pictorial descriptions to spark discussion.
Hold a short brainstorming session on each postcard to generate potential
solutions. The idea is to develop a spider-web of problems and solutions.
 Resources: 1) A neutral, relaxed setting is required to make the participants feel at ease and provide the best
outcome.
2) A large room, with a clear space to enable the design team to move around freely, in order to place
sticky notes on large wall spaces with ease.
3) Post-its, pens, paper, group of 6-12 people
29
Strengths Weaknesses
 The basic method does not require a lot of training.  The method can quickly get out of control and intervention
may be needed to take control of the group and direct them
away from the ridiculous without seeming like a dictator. A
focus which has gone outside the bounds of usefulness or
appropriateness needs to be changed.
Current Situation Assessment – ‘Yes, and….’
Why – To explore possible user scenarios, generate requirements, brainstorm,
or envision future concepts.
How – This technique is borrowed from improvisational theatre. The basic
method is to assemble a group and provide a starting statement or scenario.
Consider if there are props you could use to trigger ideas, for example an iPad.
Ask someone to write the ideas where they are visible to the group or video
the session to capture all the information. Have the leader of the group start
with the introductory statement. Encourage someone to say, ‘Yes, and’ and
then add something new. Continue with the activity until the group slows
down.
 Resources: 1) A room with a large empty space, all chairs and tables will need to be cleared out of the way for the
duration of the exercise.
2) Participants need to stand in a circular formation to encourage engagement
3) Props (if necessary), whiteboard, pens, paper, video recorder
30
Strengths Weaknesses
 Useful for understanding and solving a problem.  Must be performed systematically, usually as part of an
investigation, with conclusions and causes identified in order to be
effective.
 Provides the ability to look at complex systems around problems in
order to identify key points of failure.
 Root causes identified depend on the way in which the problem or
event is identified.
 Can minimize the need for Root Cause Analysis in the future by
using Cause and Effect Diagrams, 5 Whys, FMEA and Kaizen to help
develop the product/service during this process.
 A sequence of events or a timeline, describing the relationships
between contributing factors and root causes must be identified for
the analysis to become effective.
 Comprehensive toll, system-wide review of significant problems as
well as the events and factors leading to them.

Current Situation Assessment – Root Cause Analysis/Error Analysis
Why – To identify the root causes of problems or events in order to prevent the
recurrence of similar harmful outcomes.
How – The analysis must start with a factually defined problem. Gather data
and evidence which leads to the final failure. Ask ‘why?’ and identify the
causes associated with the sequence of steps towards the defined problem or
event. Classify causes into causal factors that relate to an event in the
sequence. Identify corrective actions and solutions to the problems and then
implement.
 Resources: 1) A neutral, relaxed setting is required to make the design team feel at ease and provide the best outcome.
2) A circular seating position of the participants will encourage engagement with the activity and hopefully ensure
no one is neglected.
3) For help with understanding and the construction of diagrams etc. software and online tools can be used;
www.mindtools.com/pages/article/newTMC_80.htm
31
Strengths Weaknesses
 Allows a direction to be agreed on before committing large
amounts of time and money.
 Depending on the project, sketching will have different advantages,
fitting well with some and less so with others.
 Allows for a visual exploration in multiple fields of design, in
multiple product/service areas.

 Can identify bottlenecks in existing processes/products/services,
as well as visually defining solutions for improvements/new
products.

Current Situation Assessment – Process Sketches
Why – To help visualise the process in which the product/service is used.
How – First define the process to be considered. Identify each of the stages
involved in the process and where and when the product/service is used
within these and how it is used. Sketch a representation of each of the stages
to help the entire design team visualise what is happening during the process.
 Resources: 1) Easy access to documentation for all those involved throughout the design and manufacture of the
product/service is essential for this method to work.
2) When developing sketches, a cross-functional team is needed; using large sheets of paper around a large table
will help with inclusivity and interaction.
3) For help with understanding sketching tutorials, online resources are available;
http://psd.tutsplus.com/tutorials/drawing/the-role-of-sketching-in-the-design-process/
32
Future Situation Assessment
33
Strengths Weaknesses
 Suitably structured questionnaires can give a powerful
insight into customer needs.
 A random approach to this method will leave fundamental
gaps in the information gathered.
 Structuring interview schedules or questionnaires around
elements of the PDS provides relevant information.
 Using inappropriate information gathering methods will lead
to unjustified conclusions.
 Fast and inexpensive  Failure to develop a coherent, logical and integrated plan for
conducting the needs analysis will lead to the failure to gather
appropriate information.
 May build management involvement within the design
process.
 May not identify causes of problems or failures, only suggests
what the customer wants to see within the product.
Future Situation Assessment – Needs Analysis
Why – To establish the true needs of the customer – the ‘voice of the
customer’- VOC.
How – Obtained by extensive examination of the views and reports of
representative bodies, market data publications (buying habits), reports giving
official opinions and reactions to products in use and also by structured
interviews or customer questionnaires.
 Resources: 1) Generally better completed with one person
2) Computer
3) Wall/board space to display plots in order to undertake useful comparisons
4) Use an appropriate needs analysis template http://www.buzzle.com/articles/needs-analysis-template.html
34
Strengths Weaknesses
 Comprehensive analysis provides a greater insight into the
product area and its domains.
 Requires handling and obtaining of large amounts of
information from a wide variety of sources.
 Leads to the preparation of a PDS.  Ideas and solutions will start to be generated, however this is
not the purpose of this activity, and ideas should be recorded
but not acted upon.
 Builds involvement from a wide variety of business sectors. 
 The procedures of this activity will trigger a creative impulse,
allowing creative energies to be channelled in the most
productive way from the beginning.

Future Situation Assessment – Attribute Listing/Matrix Analysis
Why – To focus on the attributes of an object and see how each attribute could
be improved.
How – A matrix with all features of comparable competitor products on the
vertical axis and the model types on the horizontal axis. The matrix is
completed to show which models incorporate which features.
 Resources: 1) Requires cooperation between different sectors of the business
2) Computer
3) Computer based template to make compilation easier
35
Strengths Weaknesses
 Learning from industry leaders and competitors can spark
ideas and help increase your credibility.
 Does not actively build involvement between people or
different sectors of the business.
 Availability of free data on the internet provides an extensive
and fast resource.
 Research may develop into tangents which are not directly
related to the problem and will not identify appropriate and
relevant information.
 You avoid rediscovering what is already known in regards to
problems and their solutions.
 Data from different organisations may be misleading.
 Better at highlighting the main problem areas than some
other methods.
 Requires a significant amount of time and analysis.
 Relevant information develops a list of product requirements
which can be used for evaluation at a later stage.

Future Situation Assessment – Benchmarking
Why – Identifying the ‘best practice’ in relation to both products and the
processes by which these products are created and delivered.
How – Look outward, (outside a particular business, organisation, industry,
region or country), to examine how other businesses, organisations,
industries, regions and countries achieve their performance levels.
 Resources: 1) Completed best with one person
2) Requires a very clear, set objective to allow gathering of appropriate information
3) Computer based template to make compilation easier
36
Strengths Weaknesses
 Gives specific, relevant and direct feedback on issues or
design ideas.
 Moderately time consuming, but less so than individual
interviews, and is difficult to conduct.
 Encourages on-the-spot sharing and synthesis of different
views which may allow for the development of elicit key
topics which were not expected.
 Moderately expensive.
 Builds involvement for the employee during the process and
support for the development of the product.
 May be difficult to analyse and quantify data and information
gathered.
 Best results are produced during use in the latter stages of
the design process as a form of validation and evaluation, but
can also be useful during the early stages to identify key
issues.
 Some participants may feel over-shadowed if group dynamics
are wrong for the situation. This will lead to people taking a
back-seat and not contributing to the process.
Future Situation Assessment – Focus Group (Group Interviews)
Why – To gain user opinions and attitudes on specific issues and ideas.
How – Uses an interview style to allow each group member the chance to
contribute, in a coherent and ordered way, to the group session. Group
dynamics play a key role, some participants may be empowered, and others
may be intimidated. The session should solicit feedback on specific issues or
design ideas.
 Resources: 1) A neutral, relaxed setting is required to make the interviewees feel at ease and provide the best outcome.
2) A circular seating position of the participants will encourage engagement with the activity and hopefully ensure
no one is neglected.
3) Pen and paper to record comments and thoughts.
37
Strengths Weaknesses
 Provides a very practical insight into situations which the
design would not normally have the opportunity to
experience and would rely on user descriptions for insights.
 As this method is just a simulation the outcome cannot be
100% accurate and should be combined with other resources
to ensure reliability.
 Provides a deep understanding of how your product can be
used within a real world context.
 It is almost impossible to simulate all details of sensory loss or
motor impairment and residual capacities may vary
considerably.
 Tests initial concepts over a wide spectrum of abilities.  Requires expertise in analysis and observation over a long
period of time.
 Can provide a benefit to the client as well as the designer,
therefore incorporating a wider variety of people within the
design process.
 The absence of theoretical rules to govern the use of the
method may lead to corrupt results if it is not carried out
methodically.
Future Situation Assessment – Empathic Modelling
Why – To gain direct experience of reduced ability and user needs.
How – The designer uses a simulation device to gain a first-hand insight into
what it is like to live with particular impairments or disabilities while carrying
out a particular task. The task is defined as a flow chart and during the
simulation the difficulties arising during the task are described by the
designer. The difficulties are marked as bottlenecks within the flow chart
giving a direct indication of problem areas and concerns for the user.
 Resources: 1) Pen, paper, camera, video camera, lenses, Vaseline, ear plugs, blindfolds, tape, coins/buttons, gloves,
elastic bands, texts constructed to emulate reading problems,
2) Devising a number of tasks to be performed at the same time can emulate problems with cognitive
functioning.
3) A large wall display area to display the outcomes/photographs etc. to encourage discussion.
38
Strengths Weaknesses
 Gives specific, relevant and direct feedback on issues or
design ideas.
 Moderately time consuming, but less so than individual
interviews, and is difficult to conduct.
 Encourages on-the-spot sharing and synthesis of different
views which may allow for the development of elicit key
topics which were not expected.
 Moderately expensive.
 Builds involvement for a variety of different people, with
different skills, perspectives and opinions within the design
process.
 May be difficult to analyse and quantify data and information
gathered.
 Best results are produced during use in the latter stages of
the design process as a form of validation and evaluation, but
can also be useful during the early stages to identify key
issues.
 Some participants may feel over-shadowed if group dynamics
are wrong for the situation. This will lead to people taking a
back-seat and not contributing to the process.
Future Situation Assessment – Immersive Workshop
Why – To allow users to visualise design ideas, design scenarios and simple
prototypes in order to express their thoughts, ideas and concerns.
How – A variation of a focus group, concentrating on the design development
process. It can be tailored to meet specific aims of its organisers through the
setting of the brief and the participants selected. Participants may include
designers, engineers, specialists in the area of the theme of the workshop and
end users.
 Resources: 1) A neutral, relaxed setting is required to make the interviewees feel at ease and provide the best outcome.
2) A circular seating position of the participants will encourage engagement with the activity and hopefully ensure
no one is neglected.
3) Pen and paper to record comments and thoughts.
39
Strengths Weaknesses
 This method engages a person’s imagination and encourages
a fully response in ways that more formal interview or
questionnaire techniques cannot achieve.
 Requires a high level of expertise in order to achieve a useful
outcome.
 Good for exploring subject areas or topics that could be
sensitive.
 Requires a significant amount of time, cost and people to run
the activity.
 Speculative design concepts can be tested with early
intervention from the user, saving money and development
time.
 May be difficult to analyse and quantify data and information
gathered.
 Encourages on-the-spot sharing and synthesis of different
views which may allow for the development of elicit key
topics which were not expected.

Future Situation Assessment – Intervention/Provocation
Why – To develop a greater engagement with the user and a better
understanding of their motivation.
How – The designer will place 2D graphic visualisations or 3D objects within an
environment in order to stimulate a discussion and elicit a response from the
user. Interventions can include futuristic prototypes that express new ideas;
provocations can include shock imagery or incongruous juxtapositions.
 Resources: 1) A neutral, relaxed setting is required to make the interviewees feel at ease and provide the best
outcome.
2) 2D graphics, 3D futuristic objects, creative and inspiring surrounding environment
3) Pen and paper to record comments and thoughts.
40
Strengths Weaknesses
 Enables people to share in the exploration of imagined or
speculative outcomes.
 Requires a high level of expertise being used over a long
period of time.
 Supports design scenarios with a compelling narrative and
allows engagement with future outcomes.
 Involves a large number of people with a large cost being
incurred.
 Able to practically demonstrate the potential of a highly
speculative idea, gathering support and evidence for
presenting to stakeholders and investors.
 As the film is entirely speculative, outcomes will have to be
verified against real-life situations to ensure reliability.
 The visual resource brings to life ideas which are hard to
understand when using other, conventional, methods.

Future Situation Assessment – Pseudo-Documentary
Why – To provide the designer with a realistic representation of an imagined
scenario.
How – Present a design scenario in the form of a film that has a documentary
format but which is actually staged. Real users of a future product or service
can participate in the pseudo-documentary working as actors with the aid of a
script. Events and characters are fictitious but can be based on real user
insight.
 Resources: 1) A detailed script for the film, a large number a variety of users to become actors, a film set, camera, a
detailed potential concept, a well-researched market area and potential use
2) A large room where the pseudo-documentary can be screened, inviting multi-disciplinary experts, end
users, designers, stakeholders and investors
3) Computer, pen, paper to record comments and thoughts during discussion after film screening.
41
Strengths Weaknesses
 Scenarios can open-up discussion around broader social
challenges and provoke discussion in order to help develop
or evaluate ideas.
 Requires a considerable number of people, with high expertise
to work for a long period of time.
 Generates low costs.  Often not based on actual user data which can lead to
incorrect assumptions.
 Takes a critical and speculative design approach in order to
challenge assumptions and preconceptions.
 It is often left to the interpretation of the designer to judge
how to integrate scenarios into the overall development
process.
 Creates clear visuals to aid in communication with end users. 
 Allows testing of large-scale or abstract concepts. 
Future Situation Assessment – Scenario
Why – To gain an insight in future uses of products and services.
How – Scenarios are imaginative, can be presented through a variety of media
including texts, illustrated storyboards or films, and can feature multiple
characters to describe multiple product or service interactions. Create a
storyline which explores how people might interact with a particular design or
context of use. By provoking discussion they may help evaluate or test ideas
from a human experiential point of view. You may also include scenarios
about misuse, outlining how people may interact with the product in an
incorrect and damaging way.
 Resources: 1) A detailed script for scenario, pens, paper, post-its (to note problem areas and thoughts)
2) A large wall space for display of a storyboard to showcase scenario and to encourage discussion
42
Strengths Weaknesses
 Does not require a trained moderator and can therefore be
designer led, extending the boundaries of the traditional
focus group format.
 Requires the input of moderate expertise, time, cost and a
number of people.
 Encourages constructive and on-going discussion.  Involves ‘stories’ about behaviour and do not examine actual
user/stakeholder behaviour.
 Provides a space where users can interact with the design
process throughout the duration of a project.
 The data is classed as self-report data and depends on the
participant’s truthfulness and recall accuracy. What people
report may be quite different from what they actually do.
 Has an open-ended quality which focus groups cannot
achieve.
 Dominant participants can skew the results. Conflicts and
power struggles can alter the group dynamics and lead to a
non-creative environment.
Future Situation Assessment – User Forum
Why – To encourage rich, creative and divergent contributions from potential
users.
How – Hold an interactive session between designers and users where all
attendees contribute to the dialogue and express their own opinion. Forums
can be used to explore more open-ended questions rather than just focusing
on one main issue.
 Resources: 1) A neutral, relaxed setting is required to make the participants feel at ease and provide the best
outcome.
2) A circular seating position of the participants will encourage engagement with the activity and
hopefully ensure no one is neglected.
3) Pen and paper to record comments and thoughts.
43
Strengths Weaknesses
 This task makes it possible to combine the needs of the user
with the actual constraints surrounding the use of the
product.
 The data collected through this method study will not be
indicative of every user.
 Helps the designer to visualise how and when the product
will be used in a real-world context.
 The method requires a long time for completion, to allow
several studies to be conducted in order to obtain a fuller
understanding of use.
 Helps to establish a better understanding of the size and
shape of the product.

 Allows ideas to be eliminated or developed on the basis of
sound and scientific research rather than the personal
preference of the designer.

Future Situation Assessment – Ergonomic Analysis
Why – To understand and detail the likely nature of the interaction between
the user and the product.
How – Use an ergonomic analysis tool in order to identify areas of stress
during the use of the product which may require additional attention in order
to reduce the possibility of injury. All activities will be documented for each
task and act as a resource which can be referred to throughout the design
process.
 Resources: 1) Use an ergonomic analysis tool to help with the study - http://www.acsco.com/Ergonomic%20Analysis.htm
2) Visual representations and outputs from the study will enable the designer to visual the context and
may aid in the evaluation process later in the design project.
44
Strengths Weaknesses
 Good method for taking suggestions which were made during
research and highlighting which are viable suggestions and
which were not.
 The tool is based on predicting the users’ reaction and
therefore the outcome cannot be guaranteed to be 100%
accurate.
 Enables the voice of the customer to be translated into
critical and quality characteristics.
 Asking the correct questions during the process of this task can
be difficult and can have an adverse effect on the outcome of
the design.
 Helps within the structuring of other methods such as Quality
Function Deployment.
 Requires a large amount of research and time given to
implementation.
 Provides a good visual and comparative aid for evaluation at
a later stage of the process.

Future Situation Assessment – Kano Model
Why – To help design teams uncover, classify and integrate three categories of
customer needs and attributes into the products or services they are
developing.
How – The simple approach is to ask customers two questions for each of the
three types of attributes (threshold, performance and excitement) – 1) Rate
your satisfaction if the product had this feature and 2) Rate your satisfaction if
the product did not have this feature. The customer should be asked to
answer with satisfied, neutral, dissatisfied or don’t care responses. Eliminate
or include performance or excitement attributes where their presence or
absence respectively led to customer dissatisfaction. Prioritisation matrices
can help determine which attributes will help provide the greatest return on
customer satisfaction.
 Resources: 1) Use Kano model tool to help establish a suitable questionnaire for the completion of the method -
http://www.kanosurvey.com/
2) Visual representation of the outcome, large wall space to display the outcome and encourage
discussion, previous research, contact with the potential user, Kano graph to plot the user-disclosed outcome
45
Strengths Weaknesses
 Shows a link between the mapping of means and parts within
the product.
 Can be quite vague if not completed to a high enough level.
 Results provide detailed functions which are directly related
to the design of the potential product.
 Outcome can be complex and requires a long time given to
compilation of a diagram providing information, the majority
of which has previously been gathered from other research
methods.
 Helps to clarify design objectives and sub-objectives and
refocus the mind of the designer on the design task.
 Can be complex and difficult to produce correctly.
 Can be beneficial in the creation and further development of
a design proposal.
 Can lead to frustration when the design outcome is not as
expected.
Future Situation Assessment – Function-Means Tree
Why – Prepared for the major system, subsystems of components of a product
to establish the key functional aspects of the users’ needs.
How – The tool is for listing primary functions of a design and various means
of achieving those functions. Functions are what the product must do and
means are how the product will achieve the functions. Start with high-level
product functional expectations and as you move to the right ask how each of
the previous functions can be achieved.
 Resources: 1) post-its (to help plan the tree before completing it), large A3 paper, markers
2) A circular seating position for a group of around 6 people to encourage discussion during the creation
of the tree
3) A large wall space to display the outcome and provide a focus point during the rest of the design
process
46
Strengths Weaknesses
 Empowers the design, and the designers, to exceed normal
expectations which in turn provide a level of unanticipated
excitement which generates value.
 The process of creating the ‘House of Quality’ outcome is long
and complex and will require a large amount of time.
 Identifies true customer needs instead of listing the
customers’ perspective.
 As this is a tool with origins from the Japanese Management
sector, problems can occur when the approach is tried within a
western business environment.
 Maximises the positive quality which can be added to a
product which adds value also.
 As user inputs are found by surveys, and other information
collection methods, if this is done poorly then the result of the
QFD analysis will also be poor.
 Provides a closer link between the end user and the
development of a design.
 Needs and wants of the customer can change in a very short
time period and so the outcome of QFD may be rendered
irrelevant by the end of the design process.
 Keeps a customer focus within the design process. 
Future Situation Assessment – Quality Function Deployment
Why – To manage the process of conversion of customer requirements into
process controls.
How – QFD links the needs of the customer with various product functions by
seeking both spoken and unspoken user needs, identifying positive quality and
business opportunities, and translating these into actions and designs by using
transparent analytical and prioritisation methods.
 Resources: 1) post-its, A3 paper, markers, computer
2) A circular seating position to encourage discussion during, and after, the creation of the visual ability
representation and a wall space to display the outcome and encourage further discussion and development
47
Strengths Weaknesses
 Improves safety, productivity and efficiency within the
design.
 The sizes highlighted and chosen by the method will not be
suitable for everyone within the targeted user group.
 Improves the competitive advantage the product may have
when released to market.

 Improves product quality, work process and quality of work
life.

 Allows for the input of real-world contextual issues to be
linked with the developing design.

Future Situation Assessment – Anthropometric Analysis
Why – To provide quantitative data related to the measurement of various
parts of the human body.
How – The analysis is based on a list of dimension definitions of the human
body, encompassing different genders and age ranges. By analysing the
measurements the designer can use the quantitative data to see variances
between the dimensions of any given human being in relation to the general
population. This will help illustrate the challenges which will occur when
trying to accommodate for a wide spectrum of human measurements and
body types within a design.
 Resources: 1) Computer, clear idea of target end user, a clear visual image of the proposed design
2) Access to verified information source - http://msis.jsc.nasa.gov/sections/section03.htm
48
Strengths Weaknesses
 As the same participants are studied over a long period of
time then consistency of research in habits and movements
can be achieved.
 Inconsistent variables over the duration of the study will mean
all that is tested in the study is the learnability of the system.
 Allows the researcher/designer to identify developmental
trends by looking for common attributes the subjects of the
study share.
 The inability to study the entire population, and the need to
focus on a specific subset, may result in discrepancies within
the study results.
 This type of study avoids cohort effects as the study is
conducted on one group of people over time, rather than
studying lots of different groups of people.

 Combines both qualitative and quantitative data to give a
more comprehensive study of behaviour.

Future Situation Assessment – Longitudinal Study
Why – To understand the long-tern effect of changes in products, processes or
environment.
How – Repeat observations or examination of a group of users over a
prolonged time period, at regular intervals, with respect one or more study
variables. Can be conducted over the duration of anywhere from a few days
to several decades.
 Resources: 1) Notebooks, cameras, pens, diaries, maps, question cards, tools for mapping and drawing.
2) A large wall or display area to display the outcomes of the research in order to encourage discussion
on the observation.
49
Strengths Weaknesses
 Involves the entire design team so that a mutual
understanding of all of the data can be shared.
 Requires expertise and knowledge within the group and
subgroup categories.
 Builds teamwork across the design team and other business
areas which may be involved.
 Can be very time consuming and requires the participation of a
large number of people.
 Consolidates lots of customer data into meaningful design
criteria.
 Can become exhausting due to the constant discussion and it
may seem to the design team that the discussion is leading
nowhere.
 Identifies customer work practice. 
Future Situation Assessment – Affinity Diagramming
Why – To consolidate ideas from a group and obtain consensus on how
information should be structured.
How – Concepts, which are written on cards, are sorted into groups and
subgroups. The groups and subgroups which have been identified can then be
used to analyse findings from field studies, identify group user functions as
part of the design, and analyse findings from a usability evaluation. The
designer can interpret the data in order to show the range of a problem,
uncover similarities among problems from multiple customers, and give
boundaries to the problem while also identifying areas for future study.
 Resources: 1) Post-its, pens, A3 paper, relevant research information
2) A large wall or display area to display the outcomes of the research in order to encourage discussion
on the observation.
3) Circular seating position to encourage discussion and ensure everyone feels included
50
Strengths Weaknesses
 Allows comparison with predicted performance across
different variations on a user interface.
 The method is only valid for well-practiced and repetitive
tasks.
 Does not require the participation of users or a working
prototype, only a description of the task and software is
needed.
 Does not account for any learning required for the user to
work through the task for the first time.
 Can be useful to predict task times for different approaches
to the same task, encompassing a variety of different user
perspectives and possible uses.
 The outcome of the analysis depends highly on the
assumptions of the modeller.
  Does not address the quality of the work produced by
completing the task, the quality of the output of the task, or
the effects of context of use attributes such as fatigue, group
influence, the readability or layout of the user interface, or
interruptions.
Future Situation Assessment – KLM-GOMS (Keystroke-Level Model GOMS)
Why – To predict how long it will take expert users to complete a task without
errors.
How – KLM-GOMS predicts the task times based on a simple set of physical
and mental operators, including keystrokes, button clicks, pointer movement,
keyboard to mouse movement and thinking time. Each KLM operator is
assigned a time based on empirical research. To obtain the predicted time for
a task, you add the times for an individual operator.
 Resources: 1) A detailed list of different tasks to be carried out, willing participants, stopwatch, pens, paper,
computer, estimated timing for each task
2) A large wall or display area to display the outcomes of the research in order to encourage discussion
on the observation.
51
Strengths Weaknesses
 Assuming there is a good facilitator/moderator then this
method is a very ‘democratic’ way of generating ideas.
 Requires an experienced and sensitive facilitator who
understands the social psychology of small groups.
 It is a useful way to get over ‘design blocks’ that are slowing
development.
 Requires a robust dedication to quantity and not quality.
 The concept and completion of brainstorming is very easy to
understand.
 Can, at times, seem chaotic and intimidating.
  May not be appropriate for some business or international
cultures.
Future Situation Assessment - Brainstorming
Why – To inspire the free-flowing sharing of thoughts by an individual or group
of people.
How – A question or topic will be posed for the group to focus on during the
brainstorming session. Rules for the session must be established before
choosing participants with whom to include in the brainstorming session with.
Each participant will be given post-its to record their ideas during the session
and the group will review each idea at the end of a set time. The focus should
be on the quantity of ideas produced and not the quality, at this stage of the
process there should be no judgement or discarding of ideas.
 Resources: 1) A neutral, relaxed setting is required to make the participants feel at ease and provide the best
outcome.
2) A circular seating position of the participants will encourage engagement with the activity and
hopefully ensure no one is neglected during the discussion phase of the exercise
3) Post-its, pens, paper, group of 6-12 people
52
Strengths Weaknesses
 This is a highly cost effective method.  Can be laborious to analyse for patterns within large sample
groups.
 Provides a very large amount and wide range of data within a
very short period of time.
 Requires a robust dedication to quantity and not quality.
 Does not require trained facilitators or special materials,
software or hardware.

 Provides frequency, salience and consistency data. 
 Can be used to compare different groups or cultures. 
Future Situation Assessment – Free Listing
Why – To gather data about a specific domain or topic.
How – Quite useful for understanding users, tasks terminology and other
issues such as idea generation. Ask the participants, for example, to ‘list all
the things which frustrate you about our product’. You can plot the frequency
and position of the responses and use that as an input to your requirements
and design activities. It is better when used in large group settings to
generate a large quantity of responses.
 Resources: 1) A neutral, relaxed setting is required to make the participants feel at ease and provide the best
outcome.
2) A circular seating position of the participants will encourage engagement with the activity and
hopefully ensure no one is neglected during the discussion phase of the exercise
3) Post-its, pens, paper, group of 6-12 people, use of excel spread sheet to compile comments and help
look for patterns.
53
Strengths Weaknesses
 Metaphor brainstorming is a variation on group
brainstorming so participants grasp the general procedures
very quickly.
 This method is relatively unused and undocumented by
industry and other related sources.
 Participants can express ideas from areas of interest and
other work areas.
 There is some mental inertia when people first try to use this
method. Because of this fact it can be helpful to show the
results of metaphor brainstorming and then the metaphor
deconstruction before trying this method for the first time.
 Can be used to generate organising metaphors for a product,
images for icons, requirements, and features.

Future Situation Assessment – Metaphor Brainstorming
Why – To generate metaphors and extract aspects of those metaphors which
can be applied to design.
How – Start by choosing a topic for the metaphor brainstorming session.
Provide a short briefing about the use of metaphor in design and assign
‘homework’ related to the topic area. Brainstorm a set of metaphors where
the basic question is; ‘what metaphors might give us ideas about…..?’ Choose
a set of metaphors from the brainstorming session and then conduct a
deconstruction session where you begin to break the metaphors into objects,
attributes, processes or tasks. From the list created, take the most promising
concepts and see if they prompt ideas.
 Resources: 1) A neutral, relaxed setting is required to make the participants feel at ease and provide the best
outcome.
2) A circular seating position of the participants will encourage engagement with the activity and
hopefully ensure no one is neglected during the discussion phase of the exercise
3) Post-its, pens, paper, group of 6-12 people
54
Strengths Weaknesses
 Many design ideas can be generated in a very short space of time.  Some individuals may be intimidated by being asked to draw.
 In addition to the ideas which the method creates for visual
designs, it can also elicit requirements that traditional
brainstorming may have missed.
 It is very possible that the group will not converge on a good
solution to the design problem.
 The method is very low cost and requires few resources.  There is no definitive technique for analysing the drawings.
 Ideas are elaborated and refined by a large, diverse group of users.
It is an inclusive method that allows many people to contribute to
the design.
 Managers may consider the activity to be frivolous.
 Themes, good ideas and best practices can emerge from the
results.

Future Situation Assessment – Brain drawing
Why – To visualise brainstorming ideas and concepts in a more visual and easy
to understand method.
How – This method involves drawing quickly and sharing the results with
other participants in the group. Like many other ideation methods, the focus
is on the quantity of ideas generated rather than the quality. The process
operates in rounds with participants beginning with a blank page and then
using others’ sketches for inspiration in subsequent rounds. This creates a set
of sketches which combines ideas of everyone within the group.
 Resources: 1) A neutral, relaxed setting is required to make the participants feel at ease and provide the best outcome.
2) A circular seating position of the participants will encourage engagement with the activity and hopefully ensure
no one is neglected during the discussion phase of the exercise
3) Post-its, pens, paper, group of 6-12 people, wall/display space to display drawings to allow for inspiration
55
Strengths Weaknesses
 Brain writing is easier to conduct than group brainstorming as it
does not require an experienced facilitator or many ground rules.
 Brain writing is less well known than group brainstorming.
 Often produces more outputs and ideas than group brainstorming.  It is generally less social than group brainstorming as participants
are asked not to talk as they write down ideas.
 It is a way to get input from new or shy colleagues who would not
necessarily speak up in a group brainstorming session.
 Participants may feel unable to fully express their ideas in writing.
 Reduces the possibility of social conformity. 
 Can be appropriate if you are working in a culture where
brainstorming participants may be embarrassed to express
extreme ideas.

Future Situation Assessment – Brain writing
Why – To generate a large amount of ideas by asking people to write down
ideas and thoughts which they may have.
How – Explain the procedure for brain writing and then hand each participant
a sheet of paper and place extra sheets in the centre of the table. Describe
the question or topic of interest and inform the group of how long they will
have to write ideas on the sheet of paper. At the end of the first writing
interval ask people to pass their sheet to the next person. Each person is then
to read the preceding ideas silently and then add more ideas to the bottom of
the list. The process is then repeated several more times.
 Resources: 1) A neutral, relaxed setting is required to make the participants feel at ease and provide the best
outcome.
2) A circular seating position of the participants will encourage engagement with the activity
3) Post-its, pens, paper, group of 6-12 people, wall/display space to display drawings to allow for
inspiration
56
Strengths Weaknesses
 Simple procedure.  Analysing the dimensions that emerge across participants requires some
background in qualitative analysis.
 Useful for understanding ‘user-derived’ dimensions that should be
considered when evaluating a product or a service.
 The card sort can produce fairly consistent results between participants,
but it may also vary widely.
 This is an established technique that has been used for over 10 years by
many designers.
 The card sort is relatively quick but the analysis of the data can be difficult
and time consuming, particularly if there is inconsistency between the
participants.
 Typically the cost is a stack of index cards, sticky notes, a pen or printing
labels and some time.
 The participants may not consider what the content is about, or how they
would use it to complete a task, and focus only on ‘surface’ characteristics.
 It is possible to perform several sorts within a short period of time,
generating a large amount of data.

Future Situation Assessment – Card Sorting
Why – To generate information about the associations and grouping of specific data
items.
How – You must first generate the items for the card sort, these can come from
various sources, such as; user research, brainstorming, competitive evaluations, and
task analysis. Write each statement on a separate card and number each card with a
unique code. Provide the participants with the set of cards which have been
thoroughly shuffled. Ask each participant to sort the cards into two piles, name each
pile and explain how each pile is different. Shuffle the items again and ask the
participant to sort the cards in a different way. Name the new groups and again
explain how the piles are different. Repeat 5-6 times until the participants cannot
generate new piles. Gather sort data from 10 – 20 participants and organise the
dimensions that you obtained from all the participants to see if there are any
common themes.
 Resources: 1) Index cards, sticky notes, pen
2) A large display area where groups can be displayed easily for everyone to see and allow for discussion.
57
Strengths Weaknesses
 Function allocation is useful for determining the degree of
automation for a system.
 The guidelines produced are often simplistic and provide only
limited heuristics for allocating functions among people,
hardware and software.
  Can affect important human values, for example, automated
systems that do not allow much human intervention often
lower user satisfaction.
Future Situation Assessment – Function Allocation
Why – To decide whether a particular function will be accomplished by a
person, technology or by some mix of person and technology.
How – Context of use analysis should be used to identify the task structure
and demands, the knowledge needed to perform the tasks, environmental
constraints, functional and safety requirements, and any other relevant issue.
Complete a mandatory allocation; allocate functions to humans where there
are technical limitations, ethical constraints or safety considerations, and
allocate functions to machines where the task demands exceed human
capabilities or when the system must be operated in a hostile environment.
Complete a provisional allocation; permanently allocate tasks based on task
criticality, cost, training or knowledge requirements, or task unpredictability,
and evaluate.
 Resources: 1) Apogee allocation software, computer
2) Complex, time-consuming task, best carried out by one person
http://www.stat-design.com/Software/Allocation.html?gclid=CIfmp9zU-rACFVMTfAodAXXqNw
58
Strengths Weaknesses
 Allows a range of ideas to be generated quickly and cost
effectively.
 Requires a number of design team members to be available at the
same time in order to produce the concepts.
 The parallel nature of the method allows several approaches to be
explored at the same time, thus condensing the concept
development schedule.
 Requires a major investment of time over a short period for the
design work to be carried out.
 The concepts generated can often be combined so the final idea
benefits from all ideas proposed.
 Time must be allocated in order to compare parallel design outputs
properly so that the benefits of each approach are obtained.
 Minimal resources and materials are required. 
 Can be utilised by those with little or no human factors expertise. 
Future Situation Assessment – Parallel Design
Why – To produce alternative designs in parallel and incorporate the best
aspects of each design in the final solution.
How – First clearly define the boundaries of the parallel design, goals,
objectives etc. Design teams should have roughly equivalent skills and use
whatever media they prefer to present their designs. Decide beforehand how
much time will be allocated to design work and set a clear limit; also, agree on
criteria against which the designs will be assessed. Allow sufficient time to
carry out a fair comparison of the designs produced. Discuss each design
separately and then discuss how various aspects of the design could be
combined. The objective is to settle on a design concept based on the total
effort.
 Resources: 1) Paper, pens , pencils,
2) Requires large display spaces so each approach can be displayed together in order to hold a good
comparison discussion
3) Requires 10 – 20 hours of development time per design group.
59
Strengths Weaknesses
 Gives users a voice in the design process.  Requires a significant allocation of time to prepare, run and
evaluate the outcome of the workshop.
 Involves developers, business representatives and users
working together to develop a solution.

 Enables technical and non-technical participants to
contribute equally.

 Shifts the focus from purely technical requirements and
issues towards the needs of the business and users.

 Enables a team to rapidly design, evaluate and iterate their
design approaches.

Future Situation Assessment – Participatory Design
Why – To involve users in the design process and help ensure that the product
designed meets their needs and is useable in the process.
How – Hold a workshop for the duration of a day. Define a clear set of
objective and aim for including no more than 10 people. Set goals, objectives
and expectations. At the close of the workshop, summarise what you have
achieved, document the design and determine the next steps to be taken.
 Resources: 1) Paper, pens , pencils, large whiteboard (to brainstorm ideas), software tools (such as power point, Photoshop
and Illustrator, stationary to prototype with
2) Requires large display spaces so each approach can be displayed together in order to hold a good discussion
60
Strengths Weaknesses
 Enhances flexibility within the creative process.  Requires an experienced and sensitive facilitator who
understands the social psychology of small groups.
 Yields new points of view and therefore leads to innovation.  Requires a robust dedication to quantity and not quality.
 Assuming there is a good facilitator/moderator then this
method is a very ‘democratic’ way of generating ideas.
 May not be appropriate for some business or international
cultures.
 It is a useful way to get over ‘design blocks’ that are slowing
development.

Future Situation Assessment – SCAMPER (Osborn’s Checklist)
Why – To generate ideas for new products or services by encouraging you to
think of how you could improve existing ones.
How – The mnemonic stands for; substitute, combine, adapt, modify, put to
another use, eliminate and reverse. You use the tool by asking questions
about existing products using the seven prompts listed above. These
questions help you to come up with creative ideas for developing new
products, or improving current products.
 Resources: 1) A neutral, relaxed setting is required to make the participants feel at ease and provide the best
outcome.
2) A circular seating position of the participants will encourage engagement with the activity and
hopefully ensure no one is neglected during the discussion phase of the exercise
3) Post-its, pens, paper, group of 6-12 people
61
Strengths Weaknesses
 Helps respondents to project their own attitudes and feelings
in an unconscious on the subject under study.
 Highly trained interviewers and skilled interpreters are
needed.
 Allows for urges or responses to emerge which would not be
revealed through direct questioning.
 Interpreters’ bias can exist or develop throughout the process.
 Allows for many interpretations of the same thing.  It can be a costly method.
 Quick and easy in terms of completion.  The respondent selected may not be representative of the
entire nation or targeted group of users.
  Care needs to be taken so as not to generate too much noise
that the value of the exercise becomes lost.
Future Situation Assessment – Word Association
Why – To explore ideas, define, and investigate general issues.
How – This well established method can take place as a group or individual
process. Start with a word which is related to the project in some way, it can
be a need, a problem, issue etc. Then begin listing, or exchanging words
within the group, that are associated with the previous/or beginning word.
This will help to generate creativity.
 Resources: 1) Index cards, sticky notes, pen, if conducting this on an individual basis websites/forums can be useful
http://www.wordassociation.org/
2) A large display area where words and associated words can be displayed to allow discussion with the
design team on completion of the method
3) A neutral and relaxing atmosphere where participants are seated in a circular format in order to make
them feel comfortable and encourage participation
62
Strengths Weaknesses
 Generates a broad range of concepts for further
development.
 Expertise and time required are significant.
 Builds empathy with the users.  The quick rejection of ideas should be avoided as this will
result in the immediate application of real-world constraints.
 Tackles a problem in a new way, if thinking becomes
stagnated.
 Constraints should be used to ‘shape’ the idea into a more
suitable form; the idea should not fit the ‘mould’ laid out by
requirements and constraints.
 The staffing required and the cost of running this method is
low.

Future Situation Assessment – Lateral Thinking
Why – To generate a range of ideas and concepts at an early stage.
How – Involve designers and users in a series of shared mental activities to
provoke new ideas. A useful starting point for this method is to list the
sequence of actions in a particular process, then play around with them by
removing, reversing or distorting some of them to promote lateral thinking.
Concepts that are generated may be sketched or written by the designer or
the user.
 Resources: 1) Index cards, sticky notes, pen
2) A large display area where ideas can be displayed to provoke thought and refinement
3) A neutral and relaxing atmosphere where designers can relax and induce creativity
63
Strengths Weaknesses
 The method is very easy to use.  Some participants may have problems describing their ideas
concisely, so the idea may not be clear enough to other participants.
 Does not require a trained/experienced moderator.  The time limit of 5 minutes may make participants feel pressured
and restricted in their thinking.
 By using participants with different fields of knowledge, the
innovative potential of the group can be exploited.
 May generate less creative solutions because the individual nature
of the contributions does not take advantage of group discussions.
 All participants are active, which may not occur in traditional
brainstorming.

 No premature discussion – useful for addressing conflicts in the
group as they could have a negative effect.

 A useful idea is systematically developed further. 
 The ‘author’ of a creative idea can be identified; this can be an
important motivational factor.

Future Situation Assessment – 6-3-5 Brainstorming
Why – To address the potential deficiencies of brainstorming by encouraging
participation by all, with an emphasis on sketching ideas.
How – Establish a good size team and clearly define the scope and purpose of the
activity. Each team member should write, describe or sketch 3 ideas on a piece of
paper. (Participants at this stage should be encouraged to sketch ideas). This stage
should last for around 5 minutes and concepts should be passed to the next person
around the table. It is recommended that this process is repeated 5 times to
encourage combination, development and refinement of ideas.
 Resources: 1) Pens, structured table to record ideas (one for each participant), stopwatch
2) A large display area where ideas can be displayed to provoke thought and refinement
3) A neutral and relaxing atmosphere where participants can relax and induce creativity
64
Strengths Weaknesses
 You may be tempted to use safe combinations, but
challenging yourself can lead to innovative, counter-intuitive
component combinations.
 The combination of components can yield conflicts, with two
separate component ideas which cannot physically be put
together in the final solution.
 The ‘random’ nature of combining components to create an
overall solution allows no bias or personal preference to
become involved with selection.
 Can be difficult and time consuming defining the parameters
on which to generate ideas, this will require the use of the PDS
and possibly a function-means tree to aid this process,
however this will require a large time specification.
 Can repeat the process of generating a morphological chart
several times in order to create a large number of different
ideas in a very short space of time.

Future Situation Assessment – Morphological chart
Why – To generate ideas in an analytical and systematic manner.
How – Possible components are listed on the basis of their functions. The
components are concrete and specific, specifying the parameter of that
category. Parameters are identified by focusing on commonalities of the
components. The morphological chart splits the product’s purpose into a set
of sub-functions. For each sub-function, ideas are generated and combined
into an overall solution. The carefully chosen combination of components
forms a conceptual solution.
 Resources: 1) Pens, pencils, structured table to record ideas, PDS, function-means tree
2) A large display area where ideas can be displayed to provoke thought and refinement of ideas after
generation of morphological chart and enable identification of areas on which to generate subsequent morphological
charts
3) Should be conducted around a circular table to encourage discussion between the design team
65
Strengths Weaknesses
 Generates very random ideas which would normally not
come to the fore during any other more traditional creative
method.
 Results in producing a lot of ideas which may not be feasible,
relevant or technically or physically achievable.
 Can be applied quickly.  Becomes difficult to narrow ideas and evaluate which ideas
are best for further development and which will not succeed
and in the long run become irrelevant.
 Encourages the design team to think ‘outside of the box’. 
 The method has an infinite nature. The process can be
repeated as many times as is deemed necessary with as
many different everyday items as is required.

Future Situation Assessment – Force Fitting
Why – To generate options and ideas, using characteristics of other unrelated
items, to help develop a new product.
How – Find everyday items which can be gathered and brought to a design
team meeting to be used as visual and physical aids during the process. Use
every item systematically and methodically and try and generate ideas for the
new product by taking characteristics and features from the existing product
and trying to fit them together. Ideas should be ideally be sketched.
 Resources: 1) A collection of everyday items (advisable to have them entirely unrelated to the project), paper, pens
2) A large display area where ideas can be displayed to provoke thought and refinement of ideas and
highlight areas which can be taken further within the design.
3) Should be conducted around a circular table to encourage discussion between the design team and
enable the team to touch and become familiar with the objects being used.
66
Strengths Weaknesses
 The method is useful for generating empathy for users.  Involves role playing and improvisation which may be difficult
for some members of a product team.
 Provides clues about the impact of the environment on the
user.

 Gets the design team more active and involved, activities
requiring a lot of participation lead to more innovation and
emergence of creative ideas.

Future Situation Assessment – Body storming
Why – An immersive ideation method for exploring ideas through role-playing
and physical interaction with props, prototypes, actual products and physical
spaces.
How – Gather a small group and define the locations where the product or
service will be used. Visit these locations and observe how people interact
with each other and with other artefacts in the environment. Develop
prototypes and props that you will need to explore an idea. Identify the
personas and roles that are important for understanding your product, service
or environment. Role play different scenarios, feel free to improvise and role
play new situations and scenarios that emerge from your initial round of body
storming. Reflect on the body storming experience, what did you learn? what
new questions emerged? You are likely to find new possibilities as well as
gnarly problems.
 Resources: 1) Prototypes, listed scenarios, pens, paper (to record and sketch ideas)
2) A large display area where ideas can be displayed to provoke thought and refinement of ideas and
highlight areas which can be taken further within the design.
3) A team of 6 or more will provide the best outcome, especially with a mix of knowledge areas. The
activity should be conducted in a large, open space to enable movement and to provide adequate space for role plays.
67
Strengths Weaknesses
 Reverse brainstorming can be easier to conduct and generate
more ideas than traditional positive brainstorming.
 Requires the input of a good facilitator to keep the ideas
flowing.
 Criticism is sometimes easier than positive idea generation.  Requires time allocation to convert negative ideas into positive
ideas.
 Does not require a lot of training. 
 Can be fun and helps to motivate teams that are tired,
cynical, or hostile.

 Can be used within face-to-face brainstorming. 
Future Situation Assessment – Reversal
Why – To bring a new perspective to idea generation which can be especially
helpful when a team is cynical about a project or lacking energy.
How – Generate a question for brainstorming and then convert it to a
negative question. Write the questions on a board or post it on an online
brainstorming tool. Begin the reverse brainstorming. After you generate the
negative ideas, schedule a conversation meeting where you convert the
negative ideas into positive ideas. Each negative idea may yield more than
one positive solution. Prioritise ideas and decide which ideas will be taken
forward for further development. Archive the negative and positive ideas for
future use.
 Resources: 1) A neutral, relaxed setting is required to make the participants feel at ease and provide the best
outcome.
2) A circular seating position of the participants will encourage engagement with the activity and
hopefully ensure no one is neglected during the discussion phase of the exercise
3) Post-its, pens, paper, group of 6-12 people
68
Strengths Weaknesses
 Encourages the design team to work collectively instead of
on an individual basis.
 The number of ideas generated is relatively small compared to
that of brainstorming.
 Expresses the problem in terms of something more familiar,
but perhaps rather distant.
 A synectics session is much longer than brainstorming, and
much more demanding.
 Leads to conceptualisation of the ‘problem as understood’ –
key factors or elements of the problem that need to be
resolved, or perhaps a complete reformulation of the
problem.

 Unusual creative analogies are sought, which may lead to
novel solutions.

 Analogies are used to open up lines of development which
are pursued as hard and as imaginatively as possible by the
group.

Future Situation Assessment – Synectics
Why – To build, combine and develop ideas towards a creative solution.
How – The group works collectively towards a particular solution using
different types of analogy. There are four different types of analogy; direct
analogies, personal analogies, symbolic analogies and fantasy analogies.
Direct analogies are usually found by seeking a biological solution to a similar
problem, e.g. ‘Velcro’ was designed on an analogy of plant burrs. Personal
analogies occur when team members imagine what it would be like to use
oneself as the system or component that is being designed. Symbolic
analogies use poetic metaphors and similes to relate an aspect of one thing to
another. Fantasy analogies are the impossible wishes of things to be achieved
in some ‘magical’ way.
 Resources: 1) A circular seating position of the design team will encourage engagement with the activity and hopefully ensure
no one is neglected during the discussion phase of the exercise
2) Post-its, pens, paper, group of 6-12 people, whiteboard, display area for outcomes
69
Strengths Weaknesses
 Working under time pressure and without much structure
can produce interesting and useful outcomes.
 There aren’t many cases noted in literature about user
interface races, so some practice may be needed before
deciding to run an event. Consider doing a trial run with
friendly colleagues.
 User interface races can be fun and used to promote
usability.
 Some people may not like the competitive aspect of the race
method and some colleagues may not accept the idea of a
race.
Future Situation Assessment – The User Interface Race
Why – A challenge to solve a problem under time pressure and scrutiny.
How – Planning is essential, and criteria for judgement, time and design
challenge must be decided carefully in preparation for the race. Give the race
participants the task and ask them to read and ask any questions they feel are
necessary. When the participants are ready, give them the signal to begin.
When the time is up, or the participants have finished give the signal for the
race to stop. The aim of the race for a design based task is to generate several
detailed concepts which can be analysed and further developed, or combined
to produce an overall solution.
 Resources: 1) A large room where things can be stuck to walls, with a space for people to work on an individual basis
2) Sticky notes, whiteboard, pens, paper, prototyping equipment (paper, card etc.), glue, pencils, note
cards (one for each participant to explain the task), tape, cardboard, computers with CAD software (if necessary)
70
Strengths Weaknesses
 Provides the ability to take in a broad picture of an area/problem.  Not necessarily neat or clear for people, not involved in its creation,
to read.
 Can be used to organise reference information.  This is a very personal tool because its takes force and sense from a
design culture which needs to be decoded in order to share ideas
with co-workers or customers.
 Avoids the strict hierarchy which you are forced to adopt with
traditional mind mapping.

 The method shows you a broad landscape of your reference
material, which allows you to fly through the landscape and go
straight to the item sought.

Future Situation Assessment – 3D Concept Mapping/Multi-Dimensional Mapping
Why – To identify problems, key areas for improvement, solutions and
resources.
How – This can be completed using software or by using a physical 3D model.
The base layer for both should be the problems identified with the
product/service. The second layer should consist of reasons as to why these
problems occur. The third, and final layer, must state possible solutions to
these problems.
 Resources: 1) Easy access to documentation for all those involved throughout the design and manufacture of the
product/service is essential for this method to work.
2) When developing sketches/diagrams/models, a cross-functional team is needed.
3) For help with understanding and creation of diagrams, online resources are available;
• www.topicscape.com/3d-mindmapping.html
• www.instantshift.com/2011/04/26/mind-mapping-scheme-to-improve-the-creative-process/
4) Pre-planning with the use of process identification, information gathering, interviewing and mapping, and
analysis will give the most effective results
71
Strengths Weaknesses
 Allows for good knowledge exchange to occur.  There is the potential for a large disruption of flow to work.
 A successful and productive method when conducted in an
effective manner.
 Can lead to the exclusion of quieter members of a group.
 Has the ability to lift the group contribution. 
 Induces the power of thinking in terms of interaction and
experience rather than on outcomes.

Future Situation Assessment – Physical Problem Solving
Why – To see and physically understand a particular problem identified in a
product/service.
How – Organise a group to investigate a particular problem with a
product/service. Take the problem and physically investigate the operation
components responsible for causing the problem. Physically touch and move
the parts involved to try and understand the reasons for the failure to occur.
 Resources: 1) Easy access to the physical product, and documentation or an illustration of how a service works, is essential for
this method to work.
2) When developing sketches/diagrams/models, a cross-functional team is needed.
3) An empty room with no seats will allow participants to be active in order to interact with the method. Results
should be recorded on A3 paper and displayed on a large wall in order to allow for discussion afterwards.
4) Pre-planning with the use of process identification, information gathering, interviewing and mapping, and
analysis will give the most effective results.
72
Strengths Weaknesses
 Encourages good knowledge exchange.  Experience of producing this type of map is needed to provide the
best outcome.
 Has the potential to provide the key to a raft of innovative means
of information representation through the use of interactive
spatial visualizations.

 Encourages the sharing of ‘best practice’ from across the globe. 
 Provides a good visual reference – maps ideas according to their
geographical effect.

Future Situation Assessment – Geographic Ideation/Visualizations
Why – To identify solutions which are suited to particular global locations.
How – Using a map of the world and post-it notes, identify problems and
possible solutions for specific areas and regions. The idea is that some ‘best
practices’ will emerge and be shared across global operations.
 Resources: 1) When developing sketches/diagrams/models, a cross-functional team is needed.
2) An empty room with no seats will allow participants to be active in order to interact with the method. Results
should be recorded on A3 paper and displayed on a large wall in order to allow for discussion afterwards.
3) Pre-planning with the use of process identification, information gathering, interviewing and mapping, and
analysis will give the most effective results.
4) Guidance for producing this type of map is available online;
http://media.wiley.com/product_data/excerpt/12/04705151/0470515112.pdf
73
Evaluation
74
Strengths Weaknesses
 The method is extremely simple but very powerful in its
ability to change thinking patterns.
 Requires each individual to look at all sides of an issue, this can
be difficult to become accustomed to.
 Helps actualise the full thinking potential of teams.  May cause some participants to become defensive or they
may fail to look at decisions calmly or rationally.
 Provides the disciplined process for individuals to be focused
and to the point.

 Neutralises employee rank and puts those who are quiet and
tentative on a level playing field with those who are talkative
and may tend to monopolise a meeting.

 Mixes ambition, skill in execution, public sensitivity,
creativity and good contingency planning.

Evaluation – De Bono’s Six Thinking Hats
Why – An effective parallel thinking process that helps people be more productive,
focused and mindfully involved.
How – Team members can separate thinking into six clear functions and roles. Each
thinking role is identified with a coloured symbolic ‘thinking hat’. By mentally
wearing and switching hats, you can easily focus or redirect thoughts, the
conversation or meeting. The white hat calls for information known or needed – the
facts. The yellow hat symbolises brightness and optimise – explore the positives and
probe for value and benefit. The black hat is judgement – why something may not
work. The red hat signifies feelings, hunches and intuitions – express emotions and
feelings. The green hat focuses on creativity – possibilities, alternatives and new
ideas. The blue hat is used to manage the thinking process – control.
 Resources: 1) Pens, pencils, a defined display area for each ‘hat’ to display outcomes or possibilities for each
2) Should be conducted around a circular table to encourage discussion between the design team
75
Strengths Weaknesses
 Gives specific, relevant and direct feedback on issues or
design ideas.
 Moderately time consuming and difficult to conduct, requires
high quality facilitation.
 Encourages on-the-spot sharing and synthesis of different
views which may allow for the development of elicit key
topics which were not expected.
 Very expensive.
 Builds involvement for the employee during the process and
support for the development of the product. Also, use of
innovative technology can help spark creative ideas.
 May be difficult to analyse and quantify data and information
gathered.
 Best results are produced during use in the latter stages of
the design process as a form of validation and evaluation, but
can also be useful during the early stages to identify key
issues.
 Some participants may feel over-shadowed if group dynamics
are wrong for the situation. This will lead to people taking a
back-seat and not contributing to the process.
Evaluation – Interactive Case Studies
Why – To facilitate discussion and capture results.
How – Use specifically designed software and interactive technology to
facilitate discussions and capture results. Begin by holding a reflection session
on the current design; discuss issues, problems and what the ideal state of the
design would be in a dream world. During the second half of the session use
what has previously been discussed to explore design ideas, incorporating
some research into new technological capabilities in order to achieve the
‘dream’ design.
 Resources: 1) A neutral, relaxed setting is required to make the design team feel at ease and provide the best outcome.
2) A circular seating position of the participants will encourage engagement with the activity and hopefully ensure
no one is neglected.
3) Interactive and innovative technology, such as iPads and touch screen monitors.
76
Strengths Weaknesses
 This method is relatively inexpensive.  Some perspectives may be difficult to assume.
 Can be conducted by evaluators at different sites.  Evaluators have to be open to adopting different perspectives
– some colleagues may have difficulty with role-playing.
 Broadens the types of problem that emerge. 
 Can be accomplished by using a variety of online tools. 
Evaluation – Perspective-based Inspection
Why – A user interface evaluation method where evaluators adopt a specific
perspective after examination of the product.
How – Define the perspectives that are important for the products or services
you are developing. Provide some background about the perspectives and
consider ways to understand the perspectives better. Define the tasks, goals
and specific characteristics that are important for each perspective. Provide
an inspection team, this can be a team with several members or one evaluator
who takes on several roles (consisting of a consistency czar (to assess
consistency issues), a disabled user, a psychologist, a super power user (to
assess efficiency issues), an error expert, an artist (to look at aesthetics), and a
keyboarder (to look at technical capabilities). Provide the inspection team
with forms to record the issues and products they find. Review the
perspectives, procedures and reporting forms. Pull all the issues together,
clarify data and prioritise findings.
 Resources: 1) A well rounded team of experts, or an evaluator who can take on the role of several experts, is needed
to fulfil this task.
2) Inspection form, pens, high-quality prototype, use an online tool to achieve the best results
http://www.loop11.com/landing-1/?gclid=CJHH9bTB_bACFQwjfAodMxxFPQ
77
Strengths Weaknesses
 Simplified backcasting can be done cheaply, in a one or two
day workshop using sticky notes, pens, paper and string.
 Requires a strong facilitator and solid preparation.
 It is a way of reaching a common understanding of successful
futures and the steps required to achieve them.
 Valuable backcasting results can be lost easily, unless there is
an on-going campaign to keep the results in the eyes of the
stakeholders.
 Provides actionable information. 
Evaluation – Backcasting/Future Landscape
Why – To define what is needed to get to the ideal state from the current
system.
How – Assemble a group of stakeholders and define how far into the future
you will start from, this is most typically five years. Establish a set of questions
about the time frame, current state, future ideal states, actions, indicators,
risks and opportunities that the facilitator will use during the backcasting
exercise. Conduct ideation workshops to clarify the current state and the
future ideal state or scenarios. Consider each future state and work
backwards to identify actions, assumptions, risks, benefits, and other
indicators which may lead to these future states. Publish the results using
charts, maps, stories, list of actions required, risk/benefit trade-offs, and
photographs of the actual items produced during the actual backcasting
session.
 Resources: 1) A large room where things can be stuck to walls, or a large, long table
2) Sticky notes, whiteboard, pens, paper, string, computer, stationary required for mapping and charting,
camera
3) Software needed for producing maps and charts, such as excel, will be needed
78
Strengths Weaknesses
 The user/task matrix is simple and conveys critical
information for design teams who are considering what
aspect of usability they should focus on during conceptual
design.
 If the matrix has hundreds of tasks listed within it, it may
become unwieldy. At this stage it may be necessary to create
a hierarchical version.
 You can easily substitute the language of any organisation
into the matrix. For example you might substitute ‘stories’
into task column and ‘personas’ into the user group row.

Evaluation – The User/Task Matrix
Why – To understand the frequency and importance of task that are performed
by different classes of user in order to make critical design decisions.
How – In order to construct the matrix it is important to ask questions about
task frequency and importance when conducting user research. Develop a set
of user groups or personas that represent the major classes of users. Develop
a visual coding scheme for highlighting frequency and importance in the
matrix, it may become visually compelling. Use the matrix as an input to
feature and UI design trade-offs and other design activities.
 Resources: 1) A large circular table and seating arrangement to make it easy for the design team to communicate
and discuss the matrix.
2) Whiteboard, pens, large A3/A2 paper, computer (to compile an electronic version when finished)
3) A suitable area where the finished matrix can be displayed to make discussion and analysis easier
79
Strengths Weaknesses
 Laddering is a technique that gets at core values and the
underlying reasons for particular behaviours or choices.
 Laddering can be tiring for participants who are constantly
asked why or other laddering questions.
 Laddering is a way to elicit semi-tactic information that might
not be revealed by other methods.
 Conducting interviews with many laddering questions requires
a facilitator who can keep the participant engaged. People
who use laddering questions need to be comfortable with the
repetitive questioning style and be prepared to vary their
prompts as needed.
  On some occasions laddering can get into sensitive issues.
  Laddering questions assume that there is hierarchical
information. In some domains, the information may not be
represented hierarchically.
Evaluation – Laddering Questions
Why – To provide insight into attitudes, beliefs, and values which affect
requirements, brand image, consumer preferences and buying decisions.
How – Firstly, develop a set of laddering probes that can be used in the study,
for example, ‘why do you think this product is great?’ ‘Why is this important
to you?’ ‘Can you tell me about similar/different types of….?’ During an
interview, you can then elicit features, attributes, concepts, or constructs of
interest. Ask the person to prioritise this list and then start to conduct a
laddering interview, starting with items at the top of the list. Ask laddering
questions until you get answers that have reached the ‘end of the ladder’ or
that are actionable. Repeat the laddering interview with the next item on the
list.
 Resources: 1) A neutral, relaxed setting is required to make the interviewee feel at ease and provide the best
outcome.
80
Strengths Weaknesses
 Compliments scenario creation exercises.  The role-play can become chaotic very quickly and will need to
design team to be able to regain the focus of the group and set
them on the right direction again.
 Adds some fun and minimal constraints to role-playing
studies.

 Provides a lively triggering function for creative ideas. 
 The use of a prop can provoke some novel ideas that would
not emerge gathered around a table while conducting a
traditional group brainstorming session.

Evaluation – The Magic Thing
Why – To serve as an ideation tool in the design of mobile, ambient, and
ubiquitous systems.
How – The design team introduces participants to a scenario they are to act
out. The participants review the scenario with a member of the design team
and personalise it to their own situation. The participants act out the scenario
without the magic thing. The participants are given, or choose, a prop (their
magic things), and are told what magical powers it has, for example, the magic
thing knows where it is and has information about commercial establishments
and ratings of service for many companies. The participants and design team
then engage in participatory role-play where the magic thing can gain new
powers and loose old ones, for example, you may start with a magic thing that
is location aware and then acquire a magic power like augmented reality
where you visualise information as an overlay over camera images. The
sessions are recorded and the ideas that emerge are captured and applied to a
new round of role-playing that expands on promising ideas.
 Resources: 1) A large open space to allow the role-play to evolve without any restrictions.
2) Props, video camera, pens, paper, whiteboard, variety of participants from different classes of user group
81
Strengths Weaknesses
 Has the ability to be used in both a narrow and a more general
sense.
 If not considered alongside customer viewpoints then all
judgements may become based on the personal preference of the
designer.
 Effective when completed among multiple agents, viewpoints,
data sources etc.
 To be completed well, significant time and discussions need to be
taken on decisions.
 Adaptable, can be applied to many different kinds of data in many
different design areas.

 Best used in conjunction with a collection of customers’ preference
or taste information.

Evaluation – Collective Filtering
Why – To collectively identify the best possible solutions to implement.
How – Each proposed solution needs to be fully considered in turn. The group
should concentrate on each of them individually and discuss the positive and
negative aspects of each. The object of this method is to be open and non-
judgemental before having a vote on which solution is the best.
 Resources: 1) When discussing and voting, a cross-functional team is needed.
2) A circular seating position will help with group engagement.
3) Pre-planning with the use of process identification, information gathering, interviewing and mapping, and
analysis will give the most effective results.
4) Guidance for this type of discussion is provided online, it should be conducted with the Delphi Method in mind,
this is a structured communication technique to help with ensuring the that the method is conducted in an effective manner.
82
Strengths Weaknesses
 Easy, quick and inexpensive.  Can provide incomplete or inaccurate results.
 Useful throughout various stages of the design process.  Can cause a challenge in determining which functional limitations to
include in the process.
 Can identify potential design problems early, to help avoid
significant redesign costs and delays later in the process.
 It cannot provide accurate information on how suitable the
customer will find the product, it is best to combine screening
techniques with using potential customer feedback, including
customers/users with any disability.
Evaluation – Screening and Scoring
Why – To understand how concept designs fit with the PDS.
How – This method involves interacting with, or fully understanding, concept
designs and trying to visualise how this fits alongside the PDS. This involves
using a scoring system to identify how well specific elements perform in
relation to targets set by the PDS. This information is set out in a matrix.
 Resources: 1) When discussing, during the creation of the matrix, a cross-functional team is needed.
2) A circular seating position will help with group engagement.
3) Pre-planning with the use of process identification, information gathering, interviewing and mapping, and
analysis will give the most effective results.
4) Guidance for this type matrix is available online; www.viaccess.com/accessucd/screening.html
83
Strengths Weaknesses
 Has the ability to be used in both a narrow and a more general
sense.
 If not considered alongside customer viewpoints then all
judgements may become based on the personal preference of the
designer.
 Effective when completed among multiple agents, viewpoints,
data sources etc.
 To be completed well, significant time and discussions need to be
taken on decisions.
 Adaptable, can be applied to many different kinds of data in many
different design areas.

 Best used in conjunction with a collection of customers’ preference
or taste information.

Evaluation – Dot Sticking/Personal/Anonymous Voting
Why – To collectively identify the best possible solutions to implement.
How – Each proposed solution needs to be fully considered in turn. The
individuals should concentrate on each of them individually and vote for the
solution/solutions they think best fit the purpose of the design. The object of
this method is to be open and non-judgemental before having a vote on which
solution is the best. It can be done by a simple show of hands vote, by dot
sticking or anonymous ballot voting.
 Resources: 1) When discussing and voting, a cross-functional team is needed.
2) A circular seating position will help with group engagement; this will be needed to discuss the outcome of votes.
3) Pre-planning with the use of process identification, information gathering, interviewing and mapping, and
analysis will give the most effective results.
4) Guidance for this type of discussion is provided online, it should be conducted with the Delphi Method in mind,
this is a structured communication technique to help with ensuring the that the method is conducted in an effective manner.
84
Strengths Weaknesses
 This is a non-numeric, iterative tool.  Without reflection after completion of the matrix, inaccurate results
can be achieved. The team need to identify if the outcome truly
makes sense, and if the whole team agree on the outcome.
 Allows for joint goals of both improving and narrowing the choice
of concepts available.
 The matrix is only as effective as the team input, the choice of
selection criteria and the quality of the basic concepts.
 It encourages team involvement in concept selection. 
Evaluation – Controlled Convergence Matrix
Why – To understand how concept designs fit with the PDS.
How – This method involves interacting with, or fully understanding, concept
designs and trying to visualise how this fits alongside the PDS. This involves
using a DATUM; this can be the current product which is in operation. The
design concepts are then assessed against the targets identified within the
PDS and whether the concept design reaches this target in a better, similar or
worse manner than the original DATUM product.
 Resources: 1) When discussing, during the creation of the matrix, a cross-functional team is needed.
2) A circular seating position will help with group engagement.
3) Pre-planning with the use of process identification, information gathering, interviewing and mapping, and
analysis will give the most effective results.
4) Tools and guidance to help with the creation of this type matrix is available online;
www.ifm.eng.cam.ac.uk/dmg/tools/concept/convergence.html
85
Strengths Weaknesses
 A great decision making tool for evaluating and prioritizing among
the PDS and selection criteria.
 Results achieved can be based on designer preferences and personal
opinion; choices can be made to modify the options and/or the
ranking to make them more acceptable.
 You can quickly sort through options by identifying their relative
strengths and weaknesses.
 Selecting appropriate criteria and weightings can take time and
prove to be very difficult.
 When completed to a high level, it can be a powerfully effective
tool in creative problem solving.

Evaluation – Weighting and Rating Matrix
Why – To understand how concept designs fit with the PDS.
How – This method involves interacting with, or fully understanding, concept
designs and trying to visualise how this fits alongside the PDS. This involves
using a scoring system to identify how well specific elements perform in
relation to targets set by the PDS. The elements identified from the PDS are
ranked from values of 1 – 5 according to their perceived importance in the
design and use of the product. The concept designs are then also scored from
1 – 5 depending on how well they fulfil the PDS targets. This information is set
out in a matrix.
 Resources: 1) When discussing, during the creation of the matrix, a cross-functional team is needed.
2) A circular seating position will help with group engagement.
3) Pre-planning with the use of process identification, information gathering, interviewing and mapping, and
analysis will give the most effective results.
4) Tools and guidance to help with the creation of this type matrix is available online; www.positive-
way.com/business/evauali.htm
86
Development
87
Strengths Weaknesses
 Good for getting feedback early in the design process, can
help to confirm if the project is going in the right direction.
 Participants may be less likely to realistically engage with
something that is on paper; however, they may be more likely
to provide feedback as it is clear the design is in the early
stages.
 You can determine the appropriateness of concept design
before too much work has been done and before the project
team becomes tied to a particular design.
 May be difficult to simulate complex interactions on paper.
 Prevent costly mistakes once development has begun. 
Development – Paper Prototyping
Why – To enable design feedback early in the design process.
How – Create the interface using paper or printed from low-fidelity
wireframes. Plan the study like any other usability study. You may need
someone to pretend they are the computer to simulate some interactions.
 Resources: 1) Paper, pens, pencils, post-its, anything which will help simulate interactions between the user and the
product
2) Requires one-to-one interaction between designer and user, or a circular seating set-up for a group to
encourage engagement and discussion
88
Strengths Weaknesses
 Allows the design team to identify major navigation and
usability problems before your company spends a lot of time
and money developing and coding user interfaces.
 Rushing in to develop a prototype may exclude other design
ideas.
 If the prototype is sufficiently well developed it can be used
to support metric-based evaluations.
 Design features may be limited by the scope of the
prototyping tool.
 The prototype can help to communicate the details of the
user interface to the whole design team as well as to users. It
can also be used as an awareness training tool with users.

 Permits swift development of software prototypes. 
Development – Rapid Prototyping
Why – To create a low-cost representation of the user interface of a system as
a method of brainstorming, creating, testing, and communicating ideas about
the design being developed.
How – Begin by holding a brainstorm session to discuss general ideas for
functions. Develop paper prototypes to refine ideas. Once these have been
sufficiently developed, develop a software prototype using a rapid prototyping
tool. Test the prototype with users and feed back into the design
specification.
 Resources: 1) Paper prototypes: paper, pencil, adhesive notes, card, scissors etc.
2) Requires a room to enable testing of prototypes
3) Prototyping software: power point, Visio, WYSIWYG, ProEngineer, Solidworks
4) A group of willing participants and a facilitator
89
Strengths Weaknesses
 Encourages rational and structured idea generation.  May require training in the use of TRIZ in order to create more
innovative solutions to design problems.
 Provides the ability to generate a set of data that changes the
way the design team thinks.
 A lack of understanding of the method will not lead to creative
solutions, other ways of inducing ideas should be used
alongside this method in order to produce the most relevant
and successful ideas.
 Helps generate more solutions of higher quality, in less time
compare to other methods such as brainstorming or 6-3-5.

 Reveals how product design and technologies will evolve in
time.

 Gives awareness of access to knowledge bases. 
 Improves quality, reliability and safety. 
Development – Triz
Why – Systematic innovation to find new concepts and the routes for
developing new products.
How – TRIZ research begins with the hypothesis that are universal principles
of creativity. You take the specific problem which you face and generalise it to
one of TRIZ general problems. From the TRIZ general problems, you identify
the TRIZ solutions to those general problems, and then see how these can be
applied to the specific problem you face.
 Resources: 1) Pens, pencils, structured table to record ideas, access to the contradiction matrix tool to help identify
development areas http://www.triz-journal.com/
2) Should be conducted around a circular table to encourage discussion between the design team
90
Strengths Weaknesses
 Produces a very inclusive product.  It requires a long time to process and analyse the life cycle and
environmental impacts before any progress is made.
 Necessary stage in all design projects; takes the emphasis
away from user needs and concentrates on an equally
important area.

 The method remains open to innovation, while also
concentrating on key issues and following a set of guidelines.

 The method is driven by goals which are ultimately set by the
designer. This means the end result will resolve any issues
with consideration of the environment throughout.

Development – Life Cycle Analysis
Why – To identify the total environmental impact of a product.
How – The first stage of a life cycle analysis is called an ‘inventory’ analysis.
The goal of this stage of the analysis is to examine all the inputs and outputs in
a product’s life cycle, beginning with what the product is composed of, where
those materials come from, where they go, and the inputs and outputs related
to those component materials during their lifetime. The next stage is the
impact analysis. This is where the environmental impacts identified in the
previous stage are enumerated. Once the general environmental impact has
been calculated, the next step is to conduct an improvement analysis, where
consideration is given to how the environmental impact from the product can
be reduced.
91
Improvement Analysis – To assess the impact of the product on the environment and
how these can be improved. For example, conservation of energy or water in the
manufacturing process will reduce the environmental impacts of that process.
Substituting a less hazardous chemical in place of a more toxic one would also reduce
the impact. The change is then made in the inventory analysis to recalculate its total
environmental impact.
Useful Resources
- www.life-cycle.org/
- UNEP Database Registry
- http://cml.leiden.edu/software/data-e3iot.html
- www.earthster.org/index.php (launching later this year)
- www.ecoinvent.com/
- http://lca.jrc.ec.europa.eu/lcainfohub/datasetArea.vm
- www.gabi-software.com/uk-ireland/index/ (free demo download)
- http://sourcemap.com/
- www.nrel.gov/lci/
LCIA Methodologies
- www.nist.gov/el/economics/BEESSoftware.cfm/
- http://cml.leiden.edu/research/industrialecology/researchprojects/finished/new-
deutch-lca-guide.html
- www.bafu.admin.ch/produkte/index.html?lang=en
- www.pre-sustainability.com/content/eco-indicator-99
- www.sph.umich.edu/riskcentre/jolliet/downloads.htm
- www.jemai.or.jp/english/lca/index.cfm
- www.lcia-recipe.net/
Single Issue Methodologies
- www.pes.uni-bayreuth.de/en/research/projects/LULCIA/
- www.usetox.org/
LCA Study Search Tool
- www.preconsultants.com/dtsearch.html
Development – Life Cycle Analysis Contd.
Methodology –
Define Scope Inventory Analysis
Impact
Measurement
Improvement
Analysis
Manufacture
Impact Analysis
Define Scope – Define what you want to achieve from the study.
Inventory Analysis – Examine all the inputs and outputs in a product’s life cycle,
beginning with what the product is composed of, where those materials come
from, where they go and the inputs and outputs related to those component
materials during their lifetime. It is also necessary to include the inputs and
outputs during the product’s use, such as whether or not the product uses
electricity. The purpose of the inventory analysis is to quantify what comes in
and what goes out, including the energy and material associated with materials
extraction, product manufacture and assembly, distribution, use and disposal,
and the environmental emission that result.
Impact Analysis – The environmental impacts identified in the previous stage are
enumerated, such as the environmental impacts of generating energy for the
processes and the hazardous waste emitted in the manufacturing process. Once
the environmental impacts of all the inputs and outputs of a product’s lifecycle
are analysed, the life cycle analysis generates a number that represents how
much the environment is affected.
Impact measurement – The major purpose of the analysis is to evaluate, once
the inputs and outputs are quantified, how the product affects the environment
throughout its lifecycle.
92
Development – Life Cycle Analysis Contd.
Software
- www.nist.gov/el/economics/BEESSoftware.cfm/
- The Boustead Model 5.0
- www.cmlca.eu/
- www.pre-sustainability.com/content/eco-it-ecodesign-software
- www.eiolca.net/
- www.athenasmi.ca/our-software-data/overview/
- www.gabi-software.com/uk-ireland/index/
- http://greet.es.anl.gov/
- GEMIS (Global Emission Model For Integrated Systems)
- www.llamasoft.com/products-overview/
- www.lcait.com/
- www.kmlmtd.com/index.html
- www.openlca.org/index.html
- www.ptc.com/WCMS/files/125263/en/6278_Windchill_LCA_DS_EN.pdf
- www.quantis-intl.com/software.php
- www.pre-sustainability.com/content/simapro-lca-software
- www.solidworks.com/sustainability/sustainability-software.htm
- www.ecoinvent.org/ecoinvent-v3/ecospold-v2/
- http://ecobilan.pwc.fr/uk_team.php
- www.umberto.de/en/
- http://ecobilan.pwc.fr/uk_wisard.php
93
Strengths Weaknesses
 Simple prototypes to visualize how something might work or look.  Costly in time.
 Done at a very early stage for visualization, feel, and to allow for
adjustments to save time and cost in later stages of the process.
 Can be quite complex and require several iterations of design,
redesign and testing.
 Very beneficial when combined with Production Quotation, where
manufacturer input is requested, both for cost to produce as well
as for ways the product can be made cheaper, easier, lighter,
faster, stronger and better.

 Can highlight need for minor changes before going into production. 
Development – Spatial Prototyping
Why – To allow collaborative, physical prototyping of solutions.
How – A collaborative group work together in a specified prototyping space to
create physical models of possible solutions to help understand the solution
and visualise the layout and space required for individual components etc.
 Resources: 1) When discussing, during the creation of the matrix, a cross-functional team is needed.
2) A room specifically set-up for prototyping with all relevant materials for building will be required to produce the
best prototypes, and allow for good team cooperation.
3) Pre-planning with the use of process identification, information gathering, interviewing and mapping, and
analysis will give the most effective results.
94
Strengths Weaknesses
 Products produced using this method should have higher quality
and reliability.
 Takes a considerable amount of time to get right.
 Products designed using DFMA will be easily and efficiently
manufactured and assembled with a minimum effort, time, and
cost.
 The only effective and efficient way of carrying out a DFMA analysis
is through the use of a trusted software package.
 Ensures the transition from the design phase to the production
phase is as smooth and rapid as possible.

Development – DFMA
Why – To balance cost, quality and performance.
How – The group take a primary focus on meeting customer requirements.
The idea is to balance among cost, quality and performance. A concurrent
engineering team approach, that involves engineering, manufacturing and
supplies early in the design cycle, will produce the best team results. The
team will work towards minimizing the number of components,
manufacturing steps and operations. This involves using optimal thinking and
the design simplification rules.
 Resources: 1) When discussing, during the creation of
the matrix, a cross-functional team is needed.
2) A circular seating position will help with
group engagement.
3) Pre-planning with the use of process
identification, information gathering, interviewing and
mapping, and analysis will give the most effective
results.
4) Tools and guidance to help with the
creation of this type matrix is available online;
http://smaplab.ri.uah.edu/ipd/2_1.pdf
Software
- www.dfma.net
- www.reliasoft.com/xfmea/features1.htm
- www.dfma.com/software/index.html
- www.discussoftware.com/solutions/prod
uctibility_analysis.html?gclid=CNConOrBy
LECFY2bfAodFQ4A2Q
- http://torrentz.eu/df/dfma+software-q
- www.dl4all.com/oot/tag/Boothroyd+DFM
A+Software.html
- www.ecodesign.at/methodik/software/in
dex.en.html
- www.soflist.net/search/dfma-software/
- www.rocketdownload.com/query.php?q
=dfma+software+cost
- http://shareme.com/programs/boothroy
d/dewhurst-dfma-software
95
Strengths Weaknesses
 Produces a higher customer orientation, focusing on those aspects
of the product/service that better satisfy the customer needs.
 Tendency to make generalisations and superficial statements.
 Cost reduction by eliminating functions that do not supply specific
advantages to satisfy customer requirements/needs.

 New ideas that arise from the creativity/innovation phase may add
radical changes and therefore competitive advantages that will be
regarded by the market.

 A new systematic mentality to be taken into account for the next
designs of new products or to systematically improve existing
ones.

Development – Value Analysis
Why – To improve the value of a product or a process by understanding its
constituent components and their associated costs.
How – The design team must seek to find improvements to the components
by either reducing their cost or increasing the value of the functions. There is
a specific technique to be applied in value analysis and this is shown opposite.
The design team will need to create a function/component hierarchy.
Value Analysis Step Specific Technique
Orientation/Preparation
Basic Techniques
Information
Analysis Functional Analysis, Basic
Techniques
Innovation Creativity
Basic TechniquesEvaluation
Implementation and Monitoring
Resources
- www.managing-innovation.com/tools/value%20Analysis.pdf
Software
- www.vamssolution.com/index.htm
96
Strengths Weaknesses
 Produces a higher customer orientation, focusing on those aspects
of the product/service that better satisfy the customer needs.
 Tendency to make generalisations and superficial statements.
 Cost reduction by eliminating functions that do not supply specific
advantages to satisfy customer requirements/needs.

 New ideas that arise from the creativity/innovation phase may add
radical changes and therefore competitive advantages that will be
regarded by the market.

 A new systematic mentality to be taken into account for the next
designs of new products or to systematically improve existing
ones.

Development – Value Engineering
Why – To achieve balance between required functions, performance, quality,
safety, and scope with the cost and other resources necessary to accomplish
those requirements.
How – This method is conducted by using an examination of function and
comparing it with value, defined as the ratio of function to cost. The value can
then be increased by either improving the function, or decreasing the cost.
 Resources: 1) When discussing, during the creation of the matrix, a cross-functional team is needed.
2) A circular seating position will help with group engagement.
3) Pre-planning with the use of process identification, information gathering, interviewing and mapping, and
analysis will give the most effective results.
4) Tools and guidance to help with the creation of the examination output is available online;
http://download.cnet.com/The-Value-Engineering-Process/3000_20412_4_10770314.html
97
Strengths Weaknesses
 Develops a more rigorous understanding of the relationship
between product and process parameters.
 Requires a lot of initial effort.
 Maximises the achievement of performance characteristics and
minimises the effect of noise, thereby achieving a more robust
design.
 Requires a significant amount of time.
 Identifies parameters which have no significant effect on
performance. In these cases, tolerances can be relaxed and cost
reduced.

 Identifies parameter values which reduce cost without affecting
performance or variation.

Development – Experimental Analysis
Why – To study or evaluate the performance of the system.
How – The design team need to visualise the system as a combination of
components, materials, people, equipment, processes and other resources
that function collectively to transform a set of inputs into outputs described
by one or more response variables.
 Resources: 1) When discussing, during the definition of
the experiment, a cross-functional group is needed.
2) Pre-planning with the use of process
identification, information gathering, interviewing and
mapping, and analysis will give the most effective
results.
3) Tools and guidance to help with the
creation of this type matrix is available online;
http://yalma.fime.uanl.mx/~mauricio/montgomery.pdf ,
www.npd-solutions.com/robust.html
Software
- www.camline.com/index.php?id=175&gcli
d=CMu_uoDXyLECFUcKtAodZk4AMQ
- www.statease.com/software.html
- www.camo.com/rt/Resources/design_of_
experiment.html
- www.jmp.com/applications/doe/
- www.reliasoft.com/doe/features1.htm
- www.statcon.de/statconshop/default.htm
?cPath=9_12&language=en
- www.statease.com/dx7trail.html
- www.nutek-us.com/wp-q4w.html
- www.softpedia.com/get/Others/Finance
s-Business/The-Unscrambler.shtml
- www.brothersoft.com/downloads/experi
mental-design.html
98
Strengths Weaknesses
 Helps an engineered system reach its ‘ideal function’ when all of its
applied energy is transformed efficiently into creating desired
output energy.
 In reality nothing functions like this so a significant amount of time
may be spent trying to achieve something which is impossible.
 Effective when performed alongside FMEA. 
Development – P-Diagram
Why – To relate inputs to the desired output.
How – This is a useful tool in brainstorming and documenting; Signal Factors,
Response variable or Ideal Function, Control Factors, Noise Factors or Error
States (failure modes). The idea is to take inputs from a system/customer and
relate these to desired outputs of a design that the engineer is creating also
considering non-controllable outside influences.
 Resources: 1) When discussing issues, during the creation of the diagram, a cross-functional team is needed.
2) A circular seating position will help with group engagement.
3) Pre-planning with the use of process identification, information gathering, interviewing and mapping, and
analysis will give the most effective results.
4) Tools and guidance to help with the creation of the examination output is available online;
http://thequalityportal.com/p_diagram.htm
5) Software
- www.systems2win.com/solutions/P-Diagram.htm
- http://creately.com/diagram/ghieehtr1/P+DIAGRAM
99
Strengths Weaknesses
 Provides a very good overview and reference for the project.  Requires time to be taken to learn more about standards and
specific methods within specific organisations and industry areas
through other references and training.
 Encourages good, cross-functional, team work. 
Development – FMEA
Why – To identify all possible failures in a design.
How – This is a step-by-step approach to identifying all possible failures in a
design, a manufacturing or assembly process, or a product or service. This is
best completed as a matrix and should include all failures which have
previously happened to designs and those which have not happened but could
feasibly happen in the future. The best results will come with using software
and tools to help with the creation of the matrix.
 Resources: 1) When discussing issues, during the creation of the diagram, a cross-functional team is needed.
2) A circular seating position will help with group engagement.
3) Pre-planning with the use of process identification, information gathering, interviewing and mapping, and
analysis will give the most effective results.
4) Tools and guidance to help with the creation of the examination output is available online; http://asq.org/learn-
about-quality/process-analysis-tools/overview/fmea.html
5) Software
- www.ptc.com/product/windchill/fmea?gchild=CJv9ibG0ybECFUcKtAodZk4AMQ
- www.ptc.com/wqs/failure-mode-effects-analysis-1/free-trial-3.html
- www.quality-management-infosource.com/directory/free-fmea-software.html
- www.aldservice.com/en/fmea/design-process-fmea.html
- www.sigmazone.com/snapsheetsxl.htm
- www.fmea.co.uk/FMEA_downloads.html
- www.fmeainfocentre.com/tools.htm
- www.filestube.com/f/fmea+software
- www.sourceforge.net/projects/opemfmea/
100
Strengths Weaknesses
 Ensures that the money spent on the developed product is well
spent, with the developed product being more likely to infiltrate
the market and have an immediate impact and effect.
 This method is in its infancy and therefore standards do not exist.
 Encourages great, cross-functional team work.  Involves much complex trade-offs with steadfast rules hard to find.
Development – Sustainable Consumption
Why – To ensure the product has an impact within the market.
How – The aim is to ensure the product design penetrates the market,
replacing products with poor design to have an impact. The design team must
take into consideration many product development aspects; material
selection, energy use, extended component life cycles, disassembly, reuse,
recycling, reprocessing/remanufacturing, and packaging.
 Resources: 1) When discussing issues, during the creation of the diagram, a cross-functional team is needed.

2) A circular seating position will help with group engagement.
3) Pre-planning with the use of process identification, information gathering, interviewing and mapping, and
analysis will give the most effective results.
4) Tools and guidance to help with the creation of the sustainable product output is available online;
- http://indeco.com/Files.nsf/Lookup/dfs/$file/Dfs.pdf
- www.sustainableminds.com/industry-blog/how-product-design-can-promote-sustainable-consumption
- www.score-network.org/files//1223_SCORE-Launch-Conf_Proceedings-Refereed-Papers-II_Post-Conf.pdf
101
Development – Sustainable Consumption Contd.
Guidelines for Sustainable Consumption
Guidelines normally contain long checklists which include;
Material Recovery and Reuse
Avoid composite materials, standardise materials and fasteners,
specify recyclable materials.
Disassembly
Facilitate means of component separation; avoid permanent
attachments of dissimilar materials such as welds.
Simplicity
Develop common designs for multi-functional parts.
Waste Minimisation
Reduce product size and weight, reduce packaging.
Energy Conservation
Reduce energy used in production and product power consumption.
Material Conservation
Design multi-functional products and parts, specify recycled and
renewable materials, use remanufactured components, design for
product longevity and performance, design for closed loop recycling.
Software/Tools
- www.pwc.com/us/en/technology-
forecast/2011/issue4/features/feature-technology-enabling-
sustainability.jhtml
- Solidworks Sustainability Software
- http://usa.autodesk.com/sustainable-design/
- www.lcacalculator.com
- www.dexinger.com/directory/cat/Sustainable-
Design/Software.html
- www.etool.net.au
102
Strengths Weaknesses
 Produces a higher efficiency orientation product/service that
better satisfy the customer needs the growing need to consider
material usage and recycling, reusing and carbon footprint issues.
 Tendency to make generalisations and superficial statements.
 Cost reduction by eliminating functions/material that does not
supply specific advantages to satisfy efficiency requirements of the
product.

 New ideas that arise from the creativity/innovation phase may add
radical changes and therefore competitive advantages that will be
regarded by the market.

 A new systematic mentality to be taken into account for the next
designs of new products or to systematically improve existing
ones.

Development – Dematerialisation
Why – To ensure the most efficient design is reached.
How – This method considers, beside waste, natural resources involved in the
products’ life cycle. It literally means the use of less material. The method is
closely linked with improving products’ efficiency and with saving, reusing or
recycling materials and products. It entails actions at every stage of the
production and consumption chain.
 Resources: 1) When discussing issues, during the creation of the diagram, a cross-functional team is needed.
2) A circular seating position will help with group engagement.
3) Pre-planning with the use of process identification, information gathering, interviewing and mapping, and
analysis will give the most effective results.
4) Tools and guidance to help with the creation of the sustainable product output is available online;
- www.alastairhudson.com/wordsandconcepts/Dematerialisation.doc
- www.chvlankwak.com/files/Kwak_Materializing%20Dematerialization.pdf
- http://dl.acm.org/citation.cfm?id=1949522.1949539
- http://phe.rockefeller.edu/Daedalus/Demat/
103
Strengths Weaknesses
 Ensures that the product is innovative and uses ‘best practice’ in
order to further the development of the product. Many products
have subliminally used inspiration from nature in their
development.
 This method is in its infancy and therefore standards do not exist.
 Encourages great, cross-functional team work.  Involves much complex trade-offs with steadfast rules hard to find.
Development – Biomimicry
Why – To create innovative designs using examples from nature.
How – This method examines nature, its models, systems, processes and
elements to emulate or take inspiration from in order to solve human
problems. This is done mainly through the use of observation and group
discussion after the observation stage.
 Resources: 1) When discussing issues, during the discussion stage of this method, a cross-functional team is needed.

2) A circular seating position will help with group engagement.
3) Pre-planning with the use of process identification, information gathering, interviewing and mapping, analysis,
and observation will give the most effective results.
4) Tools and guidance to help with the creation of the sustainable product output is available online;
- http://biomimicry.net
- www.asknature.org
- http://usa.autodesk.com/adsk/servlet/index?siteID=123112&id=12089947
- http://oregon.biomimics.net/terms-conditions/
104
Strengths Weaknesses
 Produces a higher efficiency orientation product/service that
better satisfy the customer needs the growing need to consider
material usage and recycling, reusing and carbon footprint issues,
alongside environmental and health and safety impact.
 Tendency to make generalisations and superficial statements.
 Cost reduction by eliminating functions/material that does not
supply specific advantages to satisfy efficiency requirements of the
product.

 New ideas that arise from the creativity/innovation phase may add
radical changes and therefore competitive advantages that will be
regarded by the market.

 A new systematic mentality to be taken into account for the next
designs of new products or to systematically improve existing
ones.

Development – Cradle to Cradle
Why – To ensure the full life cycle of the product has been prioritised and
included during the development of the design.
How – For the best results using this method then the framework and
implementation guidelines should be followed. Using a cross-functional team
during these stages and discussing possible ideas will help ensure the end
result is the ‘ideal state’.
 Resources: 1) When discussing issues, during the creation of the documentation output of this method, a cross-functional team
is needed.
2) A circular seating position will help with group engagement.
3) Pre-planning with the use of process identification, information gathering, interviewing and mapping, and
analysis will give the most effective results.
4) Tools and guidance to help with the creation of the sustainable product output is available online;
- www.mbdc.com/detail.aspx?linkid=l&sublink=6
105
Development – Cradle to Cradle Contd.
Cradle to Cradle Framework
Eliminate the concept of waste. “Waste equals food,” Design products and materials
with life cycles that are safe for human health and the environment and that can be
reused perpetually through biological and technical metabolisms. Create and participate
in systems to collect and recover the value of these materials following their use.
Power with renewable energy. “Use current solar income.” Maximise the use of
renewable energy.
Respect human and natural systems. “Celebrate diversity.” Manage waste water use to
maximise quality, promote healthy ecosystems and respect local impacts. Guide
operations and stakeholder relationships using social responsibility.
Implementation
• Start at the bottom
• Break down each material into its individual ingredient chemicals
• Collaboration with, and education of, the supply chain is critical to the inventory
effort, in order to fill in the proprietary gaps not covered by Material Safety Data
Sheets
• Evaluate each ingredient for its known or suspected human and environmental
health hazards throughout the product’s life cycle
• Third, the chemical ‘profile’ as a pure chemical then is placed into the context of
the chemical’s use within a material application. This ‘in-situ’ assessment may
alleviate some of the eco-toxicity concerns associated only with the pure
chemical
• Finally, the ‘in-situ’ chemical assessments are combined together to develop an
assessment of human and environmental health characteristics for a complete
material and/or finished product, across their entire life cycles. In addition, the
material’s recyclability/compostability is evaluated, based on its own physical
properties, irrespective of the relative availability of infrastructure for closing
the loop or the Federal Trade Commission definition of ‘recyclable’.
Tools/Free E-books
- www.product-life.org/en/cradle-to-cradle
- http://ebookee.org/Cradle-to-Cradle-Remaking-the-Way-We-Make-
Things_549375.html
- www.ebooksdownbadfree.com/download/download-cradle-to-
cradle-1.html
- http://torrentz.eu/cr/cradle+to+cradle+ebook-q
106
Strengths Weaknesses
 Produces a higher efficiency orientation product/service that
better satisfy the customer needs the growing need to consider
material usage and recycling, reusing and carbon footprint issues,
alongside environmental and health and safety impact.
 Tendency to make generalisations and superficial statements.
 Cost reduction by eliminating functions/material that does not
supply specific advantages to satisfy efficiency requirements of the
product.

 New ideas that arise from the creativity/innovation phase may add
radical changes and therefore competitive advantages that will be
regarded by the market.

 A new systematic mentality to be taken into account for the next
designs of new products or to systematically improve existing
ones.

Development – Environmental Impact Assessment
Why – To assess the impact of the product on the environment.
How – This method assesses the possible positive or negative impact that a
proposed project may have on the environment. This is achieved through a
coordinated relationship between project design, EIA and management. This
is intended to be an iterative process rather than an assessment of end state.
 Resources: 1) When discussing issues, during the creation of the documentation
output of this method, a cross-functional team is needed.
2) A circular seating position will help with group engagement.
3) Pre-planning with the use of process identification, information
gathering, interviewing and mapping, and analysis will give the most effective results.
4) Tools and guidance to help with the creation of the sustainable product
output is available online;
- http://cadlab.mit.edu/publications/abstract.shtml?98-borland-asme-dt-conference
- http://environmentalassessment.eu/methodology.html
Software
- http://sdo.ew.eea.europa.eu/tools/design-environment-dfe-
environmental-impact
- www.sustainableminds.com/software/
- www.umberto.de/en/
- www.dhigroup.com/SolutionSoftware/RIAM.aspx
- www.epa.gov/nrmrl/std/traci/traci.html
107
Strengths Weaknesses
 Decreases waste.  Requires a new way of thinking about processes and products.
 Allows the recovery of valuable by-products.  Successful implementation relies on effective communication within
the organisation.
 Improves environmental performance. 
 Increases resource productivity. 
 Increases efficiency. 
 Lowers energy consumption. 
 Overall reduction in cost. 
Development – Cleaner Production
Why – To protect human and environmental health while supporting the goal
of sustainable development.
How – This method should be used in conjunction with other elements of
environmental management. It is a practical method for protecting human
and environmental health, and for supporting the goal of sustainable
development. Cleaner production questions the need for a particular product,
and looks at other ways to satisfy the demand.
 Resources: 1) When discussing issues, during the discussion stage of this method, a cross-functional team is needed.

2) A circular seating position will help with group engagement.
3) Pre-planning with the use of process identification, information gathering, interviewing and mapping, analysis,
and observation will give the most effective results.
108
Development – Cleaner Production Contd.
Cleaner Production
Cleaner production activities include;
• Pollution prevention
• Source Reduction
• Waste Minimisation
• Eco-efficiency
The four elements of cleaner production are;
• The precautionary approach – potential polluters must prove that a
substance or activity will do no harm.
• The preventative approach – preventing pollution at the source rather than
after it has been created.
• Democratic control – workers, consumers, and communities all have access
to information and are involved in decision-making.
• Integrated and holistic approach – addressing all material, energy and
water flows using life-cycle analysis.
Guideline to Use
1) Identify the hazardous substance to be phased out, on the basis of the
precautionary principle.
2) Undertake a chemical/material flow analysis.
3) Establish a time schedule for the phase-out of the hazardous substance in
the production process, as well as its accompanying waste management
technology.
4) Implement and further develop cleaner production processes and products.
5) Provide training and technical and financial support.
6) Actively disseminate information to the public and ensure their
participation in decision-making.
7) Facilitate substance phase-out with regulatory and economic incentives.
8) Facilitate the transition to cleaner production with social planning,
involving workers and communities affected.
Resources
- www.iisd.org/business/tools/bt_cp.aspx
- www.iisd.ca/consume/unep.html
- www.journalamme.org/papers_vol20/14875.pdf
- http://designcalls.wordpress.com/2012/07/14/special-issue-of-j-cleaner-
production-why-have-sustainable-product-service-systems-not-widely-
implemented-sep-2012/
- www.fhnw.ch/lifesciences/iec/forschungsfelder-und-projekte-
en/resourcemanagement-und-cleaner-production/cleaner-production-en
- http://gulib.georgetown.edu/newjour/j/msg02815.html
- www.researchgate.net/journal/0959-
6526_Journal_of_Cleaner_Production
- http://sdsap.ord/data/TanArt_W11.pdf
- www.ecoefficiency.com.au/Portals/56/factsheet/foundry/ecofndy_guide.
pdf
109
Strengths Weaknesses
 Decreases waste.  Requires a new way of thinking about processes and products.
 Allows the recovery of valuable by-products.  Successful implementation relies on effective communication within
the organisation.
 Improves environmental performance. 
 Increases resource productivity. 
 Increases efficiency. 
 Lowers energy consumption. 
 Overall reduction in cost. 
Development – Design for Environment
How – Systematic consideration of design performance with respect to
environmental, health and safety objectives over the full product and process
life cycle.
Resources
- http://www8.hp.com/us/en/hp-information/environment/design-for-
environment.html
- www.epa.gov/dfe/
- www.bombardier.com/en/transportation/sustainability?docID=09012
60d80008eac
- www.pe-international.com/services-solutions/product-
sustainability/design-for-environment-ecodesign/
- http://awr-design-environment.software.informer.com
- www.dfma.com/software/dfe.htm
- www.methodproducts.co.uk/behind-the-bottle/dfe.aspx
- www.seas.columbia.edu/earth/RRC/documents/2000.dfe.diss.rase.pdf
Tools
- http://lcacentre.org/in/ca/pdf/4cLandfield.pdf
- http://source.theengineer.co.uk/software-and-communications/design-
software/simulation/dfma-2009-features-design-for-environment-
tools/334070.article
- www.enme.umd.edu/ESCML/Papers/beyond.pdf
- http://dl.acm.org/citation.cfm?id=1242343
- www.dfma.com/
- www.gabi-software.com/
110
Strengths Weaknesses
 Provides a better insight of all the costs in the programme and
identifying the key cost drivers for potential cost savings.
 Successful implementation relies on effective communication within
the organisation.
 A realistic planning programme and budgeting through a
methodical and consistent estimating approach.
 Tendency to make generalisations and superficial statements.
 Provides the basis for measurement of effective organisational and
logistic scenarios and provisions.

 Provides a measure to evaluate two or more technically different
solutions to assist the decision making process.

Development – Life Cycle Cost
Why – To calculate the whole cost of a system from inception to disposal.
How – Costs are calculated at user defined time points within the life cycle of
the system. Each set of time points is called a time sequence and has a unique
name. Define more than one set of time points so that you can investigate
the effects of variations in the time point dates and the values of variations at
those times.
111
Development – Life Cycle Cost Contd.
Can be broken down in a number of ways;
 By time (year, month, or life cycle stages)
 By type of costs (direct, indirect, linked, variable or fixed)
 By product (systems, subsystems, components)
 By process/activity (management, engineering, maintenance, etc.)
 By resources (personnel, equipment, consumables)
 By organisation
 Resources: 1) When discussing issues, during the discussion stage of
this method, a cross-functional team is needed.

2) A circular seating position will help with group
engagement.
3) Pre-planning with the use of process identification,
information gathering, interviewing and mapping, analysis, and
observation will give the most effective results.
Resources
- http://fire.nist.gov/bfrlpubs/build96/PDF/b96121.pdf
- http://www1.eere.energy.gov/femp/pdfs/lcc_guide_05.pdf
- http://isddc.dot.gov/OLPFiles/FHWA/010621.pdf
- http://ec.europa.eu/enterprise/secters/construction/files/compet/files/co
mpet/life_cycle_costing/guideance__case_study_en.pdf
- www.bcis.co.uk/downloads/SMLCC_conference__belfast_2-09.ppt
- http://eprints.utm.my/12222/
Tools
- www.wbdg.org/tools/tools_cat.php?c=3
- www.blpinsurance.com/sustainability/life-cycle-costing/
- http://acc.dau.mil/CommunityBrowser.aspx?id=22509
- www.toolkit.bc.ca/tool/life-cycle-costing
- www.rics.org/site/scripts/download_info.aspx?fileID=5512&categoryID=52
3
- www.isograph-software.com/lcwover.htm
- http://ftp.rta.nato.int/public//PubFullText/RTO/TR/RTO-TR-SAS-069//TR-
SAS-069-ALL.pdf
112
Strengths Weaknesses
 Encourages rational and structured idea generation.  May require training in the use of TRIZ in order to create more
innovative solutions to design problems.
 Provides the ability to generate a set of data that changes the
way the design team thinks.
 A lack of understanding of the method will not lead to creative
solutions, other ways of inducing ideas should be used
alongside this method in order to produce the most relevant
and successful ideas.
 Helps generate more solutions of higher quality, in less time
compare to other methods such as brainstorming or 6-3-5.

 Reveals how product design and technologies will evolve in
time.

 Gives awareness of access to knowledge bases. 
 Improves quality, reliability and safety. 
Development – Critical to Quality
Why – To make unanimous as many customer requirements as possible.
How – The best way to achieve a critical to quality output is to use a
combination of;
• TRIZ
• FMEA
• QFD
 Resources: 1) Pens, pencils, structured table to record ideas
2) Should be conducted around a circular table to encourage discussion between the design team
3) Online resources;
- www.google.com/patents/US6301516
- www.scientific.net/SSP.165.280.pdf
113
Strengths Weaknesses
 Decreases waste.  Requires a new way of thinking about processes and products.
 Allows the size, cost and performance of the product/service to be
optimised.
 Successful implementation relies on effective communication within
the organisation.
 Improves environmental performance. 
 Increases resource productivity. 
 Increases efficiency. 
 Lowers energy consumption. 
 Overall reduction in cost. 
Development – Dewhurst and Boothroyd (Design for Assembly)
Why – To evaluate the necessity of a component/part.
How – There are two different methodologies involved in design for assembly,
the Lucas Method and the Dewhurst Boothroyd Method. There are many
guidelines, principles and worksheets to consider when trying to follow either
method.
 Resources: 1) When discussing issues, during the
discussion stage of this method, a cross-functional
team is needed.

2) A circular seating position will help
with group engagement.
3) Pre-planning with the use of process
identification, information gathering, interviewing
and mapping, analysis, and observation will give
the most effective results.
Resources
- http://deed.ryerson.ca/~fil/t/dfma.html
- www.dfma.com/
- www.ami.ac.uk/courses/ami4945_dpb/restricted/u
08/supplementary/sup_04.html
- http://leva.leeds.ac.uk/www/5330/STOLLW-
18.HTML
- http://deed.ryerson.ca/~fil/t/dfmlucas.html
Software/Tools
- www.design-iv.com
- www.dfma.com/software/dfa.htm
- www.alibaba.com/showroom/design-for-
assembly-software.html
114
Development – Dewhurst and Boothroyd (Design for Assembly) Contd.
Dewhurst and Boothroyd
Dewhurst and Boothroyd is based on two principles;
• The application of criteria to each part to determine if it should be separate
from all other parts.
• Estimation of the handling and assembly costs for each part using the
appropriate assembly process.
Generally the process follows three steps;
1) Select an assembly method for each part
2) Analyse the parts for the given assembly methods
3) Refine the design in response to short comings identified by the analysis
4) Loop to step 2 until the analysis yields a sufficient design
Help here can be given by using the Dewhurst Boothroyd DFA Worksheet. Parts are
evaluated as the whether they are really necessary by asking three questions;
1) Does the part move relative to another part?
2) Are the material properties of the part necessary?
3) Does the part need to be a separate entity for the sake of assembly?
DFA General Guidelines
• Minimise part count by incorporating multiple functions into single parts
• Modularise multiple parts into single subassemblies
• Assemble in open space, not in confined spaces; never bury important
components
• Make parts such that it is easy to identify how they should be oriented for
insertion
• Prefer self-locating parts
• Standardise to reduce part variety
• Maximise part symmetry
• Design-in geometric or weight polar properties if non-symmetric
• Eliminate tangley parts
• Colour code parts that are different but shaped similarly
• Prevent nesting of parts; prefer stacked assemblies
• Provide orienting features on non-symmetries
• Design the mating features for easy insertion
• Provide alignment features
• Insert new parts into an assembly from above
• Eliminate re-orientation of both parts and assemblies
• Eliminate fasteners
• Place fasteners away from obstructions; design in fastener access
• Deep channels should be sufficiently wide to provide access to fastening
tools; eliminate channels if possible
• Provide flats for uniform fastening and fastening ease
• Ensure sufficient space between fasteners and other features for a
fastening tool
• Prefer easily handled parts
The Lucas Method
The Lucas Method is based on a points scale which gives a relative measure of
assembly difficulty. It is based on three sequential analyses; (best described as an
assembly sequence flowchart);
1) Specification
2) Design
3) Functional Analysis (1st
Lucas Analysis)
- Possibly loop back to step 2 if the analysis yields problems
4) Feeding Analysis (2nd
Lucas Analysis)
5) Fitting Analysis (3rd
Lucas Analysis)
6) Assessment
7) Possible return to step 2 if the analyses identify problems
115
Strengths Weaknesses
 Decreases waste.  Requires a new way of thinking about processes and products.
 Allows the size, cost and performance of the product/service to be
optimised.
 Successful implementation relies on effective communication within
the organisation.
 Improves environmental performance. 
 Increases resource productivity. 
 Increases efficiency. 
 Lowers energy consumption. 
 Overall reduction in cost. 
Development – Design for Maintenance
Why – To evaluate the necessity of a component/part in order to ensure the
suitability of the design for maintenance, and to allow for easy replacement of
component parts.
How – Similar guidelines and principles to the design for assembly are
available, however it is easier to complete this method using online resources
and tools.
 Resources: 1) When discussing issues, during the
discussion stage of this method, a cross-functional
team is needed.

2) A circular seating position will help
with group engagement.
3) Pre-planning with the use of process
identification, information gathering, interviewing
and mapping, analysis, and observation will give
the most effective results.
Resources
- www.dft.gov.uk/ha/standards/ians/pdfs/ian69.pdf
- www.usace-
isc.org/presentation/BIM%20CAD/BIM%20NEXT%2
0GEN%FM%20-
Design%20for%20Maintenance%20-
%20%202011%20Approved%20version.pdf
- www.nmmu.ac.za/documents/theses/MSyce.pdf
Software/Tools
- http://reversingproject.info/wp-
content/uploads/2009/05/design_recove
ry_for_maintenance_and_reuse.pdf
- www.slideshare.net/sylvain/ux-design-
service-design-design-thinking
116
Strengths Weaknesses
 Assigns more indirect costs into direct costs comparing to
conventional costing models.
 Applicability is bound to the cost of the required data capture.
 Identifies and eliminates those products and services that are
unprofitable/ineffective.
 Drives the prevalence to slow processes in services and
administrations.
Development – Activity Based Costing
Why –To identify activities in an organisation and assign a cost to these
activities.
How – A methodology is used to focus on cost allocation. It is best completed
with the help of software and tools available online and an output considered
as a team and recorded on paper.
 Resources: 1) When discussing issues, during the discussion stage of this method, a cross-functional team is needed.

2) A circular seating position will help with group engagement.
3) Pre-planning with the use of process identification, information gathering, interviewing and mapping, analysis,
and observation will give the most effective results.
4) Tools and guidance to help with the creation of the sustainable product output is available online;
117
Methodology
This is a costing methodology that identifies activities in an organisation and
assigns the cost of each activity with resources to all products and services
according to the actual consumption by each.
The ABC methodology focuses on cost allocations and helps to segregate;
 Fixed costs
 Variable costs
 Overhead costs
Resources
- www.economist.com/node/13933812
- www.accountingcoach.com/online-accounting-course/35Xpg01.html
- www.cimaglobal.com/Documents/ImportedDocuments/cid_tg_activity_bas
ed_costing_nov08.pdf.pdf
- www.emblemsvag.com/abc.htm
- www.sas.com/resources/whitepaper/wp_5073.pdf
- www.cliffsnotes.com/study_guide/Activity-Based-Costing-
Activities.topicArticleId-21248.articleId-21225.html
Tools/Software
- www.kashflow.com/?refsrc=24&code=GLEACCSOFT&gclid=CIvztcXMy7ECFa
4mtAodVEsAYA
- www.xjtek.com/analogic/demo_models/33/
- www.mrdashboard.com/Activity-Based-Costing.html
- http://costperform.co.uk/
- www.business.com>Software
- www.cashfocus.com/abc_software
- www.data-archive.ac.uk/media/257647/ukda_jiscdmcosting.pdf
Development – Activity Based Costing Contd.
118
Strengths Weaknesses
 Prioritizes possible changes by identifying the problems that will
be resolved by making these changes.
 Drives the prevalence to slow processes in services and
administrations.
 You can prioritize the individual changes that will most improve
the situation.
 Applicability is bound to the cost of the required data capture.
Development – Pareto Costing/Pareto Analysis
Why –To identify the cost of problems/failings within the product design.
How – The Pareto chart produced is a bar graph. The bars represent the
frequency or cost, and are arranged with longest bars on the left and the
shortest to the right. In this way the chart visually depicts which situations are
more significant. Works well when the outcomes of the root cause analysis
method are used in conjunction with this method.
Pareto Tool/Methodology
- Identify and list problems
- Identify the root cause of each problem
- Score problems
- Group problems together by root cause
- Add up scores for each group
- Take action
 Resources: 1) When discussing issues, during the discussion stage of
this method, a cross-functional team is needed.

2) A circular seating position will help with group
engagement.
3) Pre-planning with the use of process identification,
information gathering, interviewing and mapping, analysis, and
observation will give the most effective results.
Online Resources
- www.pqsystems.com>QualityAdvisor>DataAnalysisTools
- www.spicecsm.com/understanding-the-common-frequent---is-pareti-
costing-you/
- http://office.microsoft.com/en-us/templates/cost-analysis-with-
pareto-chart-TC006082757.aspx
- http://asq.org/learn-about-quality/cause-analysis-
tools/overview/pareto.html
- www.pareto-ce.com/why.html
- www.mindtools.com/pages/article/newTED_01.htm
119
Implementation
120
Strengths Weaknesses
 A good control document for the design provides a single
reference document for all the research information which
has been transferred into realistic constraints to be imposed
on the design.
 If not constructed correctly it may tend to lead the design and
predict the outcome.
 Includes external sources of information which is essential to
avoid the designer being limited to his/her own knowledge
or experience.
 Takes a long time to construct an effective PDS and will require
input from a large number of people.
 Changes and develops with the progression of the project,
enabling the best outcome to be sought.

Implementation – PDS
Why – To provide the information needed throughout the life of a design
project.
How – Create a document which contains all the facts relating to the product
outcome. It defines elements, factors and boundaries of the artefact to be
designed, not the specification of the artefact as designed. The document
should include an introduction, explaining the scope of the PDS, it should be
clearly laid out using PDS elements as section headings, with all paragraphs
and statements numbered for ease of cross-referencing, and it should end
with a conclusion, indicating the further work/steps/information required to
allow completion of the PDS.
 Resources: 1) Computer, pen, paper, Pugh’s elements of a PDS diagram
2) Made easier if all of the other research findings are summarised with all of the important information
included and irrelevant information discarded, in the form of something like a design persona.
121
Strengths Weaknesses
 Lays a good foundation of research and analysis on which a
comprehensive PDS can be formed.
 Requires a significant amount of research and time in order to
compile a very comprehensive document.
 Covers a large area of information, irrespective of the
product area.

 Delineates all the areas necessary for professional practice. 
 Remains relevant throughout the design process and can be
used to narrow the focus at appropriate times during the
project.

Implementation – Design Brief
Why – To establish the market/user need situation in considerable depth.
How – Common practice is to produce a device or document which can vary
from the simplest statement of the requirement, to a comprehensive
document that aptly describes the true user needs.
 Resources: 1) post-its - to help brainstorm key points to include in the brief, computer
2) A circular seating position (if working in a group situation) to encourage discussion during the creation
of the brief
3) A wall space to display the outcome and provide a focus point during the rest of the design process
122
Strengths Weaknesses
 This method is simple and flexible and does not depend on a
methodological context.
 There are no strict rules for creating and HTA diagram so
different analysts will generate different styles of hierarchy
with varying levels of detail.
 Enables the representation of a task hierarchy which could be
refined and further detailed.
 Requires both training and experience, and cannot be applied
immediately.
 Provides information, inefficiencies in tasks, which can be
used for developing product requirements.
 It is not a predictive tool, so it will not help to create solutions,
as it focuses on existing tasks.
 Although it is task and, to some extent, user oriented it is not
too ‘foreign’ an idea and therefore traditional engineers and
other business sectors can still understand its use and
become involved within the analysis.
 The visual graphic representation can become very complex.
Implementation – Hierarchical Task Analysis
Why – To decompose a high-level task into a hierarchy of subtasks.
How – The representation consists of a hierarchy of tasks, sub-tasks and
actions, together with plans, that describe the ordering and condition of task
performance. The decomposition is done according to the p x c rule that
estimates the efficiency of going on with the analysis based on the probability
of inadequate performance and the cost of the inadequate performance.
 Resources: 1) p x c rule = if the probability of failure (p) times (x) the cost of failure (c) is acceptable, then the analysis
should be stopped, dedicated HTA software http://www.brivers.com/resume/projects/hta-software-inventory.php
2) A large wall or display area to display the outcomes of the analysis, so that all involved in the project
have instant access
123
Strengths Weaknesses
 Good for use within small, to medium sized projects.  Without knowing the process of how product development occurs
within the organisation, then steps and resources will be quite easily
overlooked.
 Useful for identifying a key step which may otherwise be
occasionally overlooked.

 Provide a framework for helping you think about how you will
complete a project efficiently.

 Will help avoid last-minute panic. 
Implementation – Action Plans
Why – To collectively decide on a plan of action for the development of the
product and production implementation.
How – To draw up an action plane, you simply need to identify and list the
tasks which need to be done in order to achieve your objective. The next step
is to analyse and delegate tasks throughout the entire project; this includes
setting timelines and selecting the appropriate person to carry out each task.
The last step is to check with the mnemonic SCHEMES; this stands for space,
cash, helpers/people, equipment, materials, expertise and system, all of these
also need to be identified and delegated within the action plan.
 Resources: 1) When discussing what to include in the action plan, a cross-functional team is needed.
2) A circular seating position will help with group engagement; this will be needed to discuss the outcome of votes.
3) Pre-planning with the use of process identification, information gathering, interviewing and mapping, and
analysis will give the most effective results.
124
Strengths Weaknesses
 Gives a basis for scheduling when the tasks will be carried out.  Can take experience and time to configure an effective Gantt chart.
 Helps to work out a critical path for a project where you must
complete it by a particular date.
 Can be difficult to read and understand the final presentation of the
Gantt chart.
 Helps monitor if a project is on schedule, if it isn’t then it allows
you to pinpoint the remedial action needed to put it back on
schedule.

 Allows you to identify interdependent activities. 
Implementation – Gantt Charts
Why – To help analyse and plan more complex projects.
How – List all the activities needed to complete the project, along with the
earliest start date, the estimated length of time it will take to complete,
whether it is parallel or sequential, if the task is sequential, show which
stage/stages it depends on. Set up a Gantt chart on graph paper, the headings
should be the days or weeks through to task completion. Finally plot the tasks
onto the graph paper. Set it up so that sequential activities are in the order in
which they need to be completed.
 Resources: 1) When discussing what to include in the Gantt chart, a cross-functional team is needed.
2) A circular seating position will help with group engagement; this will be needed to discuss the outcome of votes.
3) Pre-planning with the use of process identification, information gathering, interviewing and mapping, and
analysis will give the most effective results.
4) Online resources for help with development and understanding of this chart are available; Microsoft Project,
http://www.mindtools.com/pages/article/newPPM_03.htm, https://www.smartsheet.com/online-gantt-
chart?s=8&c=3&m=414&a=012g&k=gantt%20charts&gclid=CK2gqpL53L ; http://www.smartdraw.com/specials/ppc/project-
charts.htm?id=45109&gclid=CLrP56L53LECFVMdtAod_0gAUA, http://www.ganttchart.com/, http://office.microsoft.com/en-
us/excel-help/create-a-gantt-chart-in-excel-HA001034605.aspx
125
Strengths Weaknesses
 Adaptable, different style of a bill of materials can be used for
small, medium and large projects.
 Significant errors can occur which can have a negative effect on the
project. These include; parts having the wrong quantity in a bill of
materials and parts being omitted from a bill of materials.
 When conducted efficiently they can prevent errors help in the
accurate tracking of parts through the process.

 Easy to read and helps in the ordering of parts and collating parts
for construction.

 Includes a list of suppliers in order to make ordering easier. 
Implementation – Bill of Materials
Why – Used to estimate costs but also for inventory control and tracking where
parts are used.
How – Can come in the form of single level or multi-level. The single level is a
total count of all parts used in a construction. The parts in this type of bill of
materials are listed in order of the part numbers. A multi-level bill of
materials breaks down a construction into subassemblies and those
subassemblies into smaller subassemblies and so on. Each part number in this
type of bill of materials must have a parent, with the exception of the final
assembly.
 Resources: 1) When discussing which bill of material type to use and the construction of the bill, a cross-functional team is
needed.
2) A circular seating position will help with group engagement; this will be needed to discuss the outcome of votes.
3) Pre-planning with the use of process identification, information gathering, interviewing and mapping, and
analysis will give the most effective results.
4) Online resources for help with development and understanding of the bill are available;
http://www.billofmaterials.net/, http://www.buyplm.com/bill-of-materials/advantages-of-bill-of-materials-software-
tool.aspx?s=adw&g=bomgen&a=mlbcc&d=111125&gclid=COiQ7uiD3bECFfMdtAodxn0AVg,
http://www.plm.automation.siemens.com/en_us/products/teamcenter/bill-of-materials-bom-management/
126
Strengths Weaknesses
 Brings together multiple perspectives and expertise.  Out-of-date information can be a burden to the process.
 Facilitates group problem solving. 
Implementation – Collective Visualisation/Interactive Networks
Why – To co-create solutions and share ideas among departments, businesses
and groups involved in the design process and similar applications.
How – Design is changing from an individual to a collaborative process, from
studio to out in the world, from object to purpose, from application to
implication. Co-creation is taking place throughout all stages of the process
using online and computer based software to help communication.
Who is involved?
- Inside companies and organisations
- Between companies and their business partners
- Between companies and the people they serve
- Within communities
 Resources; 1) Pre-planning with the use of process identification, information gathering, interviewing and mapping, and
analysis will give the most effective results.
2) Tools and guidance to help with the creation of collective visualisation/interactive networks are available online
127
Implemenation – Collective Visualisation/Interactive Networks Contd.
Software for Project Collaboration
- Ace Project – www.aceproject.com/
- Adobe Acrobat
- Agile Zen – www.rallydev.com
- Airset – www.airset.com
- @Mail – www.atmail.com
- Axigen – www.axigen.com/mail-server/
- Basecamp – www.basecamp.com
- Binfire – www.binfire.com
- Blogtronix – www.blogtronix.com
- Box – www.box.com
- Basic Support for Collaborative Work –
http://public.bscw.de/pub/
- Organice –
www.cadac.com/organice/en/solutions/Pages/def
ault.aspx
- Cadweb – www.cadweb.co.uk
- Calliflower – www.calliflower.com
- Cerebro – www.cerebrohq.com
- Clarizen – www.clarizen.com
- Clearspace – www.jivesoftware.com
- Clickhome – www.ClickHome.biz
- Clinked – http://clinked.com/
- CodeBeamer –
www.intland.com/products/codebeamer/overview
/
- Collaba – www.collaba.com
- Collaber – www.collaber.com
- Collabtive – http://collabtive.o-dyn.de/
- Concursive – www.concursive.com/
- Collanos – www.collanos.com
- CoMotion –
www.gdc4s.com/content/detail.cfm?item=323415
61-76f9-40f8-8ad5-0f0d66dd240e
Contactizer – http://objective-
decision.com/en/products/contactizerpro/
Creately – www.creately.com
Debategraph –
http://debategraph.org/home#61932_5_1
E Text Editor – http://e-texteditor.com/
Err-chatbot – http://gbin.github.com/err/
Edit Grid – www.editgrid.com
Documentum –
www.emc.com/products/family/documentum-
standard-family.htm
First Class – www.firstclass.com/
FMYI – www.FMYI.com
GForge – www.gforge.org
Google Apps – www.google.com/apps
Grove Site – www.GroveSite.com
Hall.com – http://hall.com
Huddle – www.huddle.com
Hyperoffice – www.hyperoffice.com/blog/
I-Sense – www.nextgroupware.com
IBM Lotus Notes – www-
01.ibm.com/software/lotus/products/notes/
IBM Lotus Quick Place – www-
01.ibm.com/software/lotus/products/quickr/
Jama – www.jamasoftware.com
Jot Spot – http://sites.google.com
Kerio Connect – http://kerio.com/connect
Knowledge Tree - www.knowledgetree.com
Liferay – www.liferay.com
Liquid Planner – www.liquidplanner.com
Mavenlink – www.mavenlink.com
McClaren Fusion Live – www.mclarensoftware.com/
Mind Meister – www.mindmeister.com
Mixedink – www.mixedink.com/#/_how_it_works
Nefsis – www.nefsis.com
Novell Group Wise – www.novell.com/groupwise
Oracle Beehive –
www.oracle.com/products/middleware/beehive/in
dex.html
Oracle Wecentre
omNovia Technologies – www.omNovia.com
Owis
Pidoco – www.pidoco.com
Pivotal Labs – www.pivotallabs.com
Planbox – www.planbox.com
Protoshare – www.protoshare.com
Qontext – www.qontext.com
Ramius Corporation (community Zero) –
www.ramius.net
Saba Software – www.saba.com
Same Page –
www.etouch.net/products/collaboration/index.html
Saros – www.saros-project.org
Seefile – www.seefile.com
Smart sheet – www.smartsheet.com
Socialtext – www.socialtext.com
SubEthaEdit – www.codingmonkeys.de/subethaedit
Synovel Collabsuite – www.synovel.com
Team Wix – www.teamwox.com/en
Telligent Systems – www.telligent.com
Tms EKP – www.tmsasia.com/cms/index.jsp
Traction Team Page – www.tractionsoftware.com
Teamwork – www.twproject.com
Tonido – www.tondio.com/
Tracker – www.Acentre.com
Ubidesk – www.ubidesk.com
128
Implementation – Collective Visualisation/Interactive Networks Contd.
- Webex – www.webex.com
- Wiggio – www.wiggio.com
- Workspot – www.workspot.com/
- Wrike – www.wrike.com
- Zing Technologies – www.anyzing.com/
129
Strengths Weaknesses
 Can integrate auto network discovery with network mapping.  Can take a large amount of time to set-up a sophisticated and useful
network map.
 Helps to visualise the network and understand relationships
between end devices and the transport layers that provide service.

 Bottlenecks and Root Cause Analysis can be easier to spot using
these tools.

Implementation – Network Mapping
Why – To ensure that a network or service meets the needs of the subscriber
and the operator.
How – Involves five layers of planning; 1) business planning, 2) long-term and
medium-term network planning, 3)short-term network planning, 4) IT asset
sourcing, 5) operations and maintenance. Incorporates plans for different
time horizons. Begins with the acquisition of external information, including;
forecasts of how the network/service will operate, economic consideration
concerning costs, and technical details of the network’s capabilities.
 Resources: 1) Easy access to documentation for all those involved throughout the design and manufacture of the
product/service is essential for this method to work.
2) When developing documents, a cross-functional team is needed, using large sheets of paper around a large table
will help with inclusivity and interaction.
3) For help with understanding and the construction of diagrams etc. software and online tools can be used;
www.spiceworks.com/free-network-mapping-software/
130
Strengths Weaknesses
 Helps bridge the gap between business and IT to allow processes
to be designed and modelled in an effective and collaborative way.
 Involves the identification of all elements of a process to ensure the
outcome is effective.
 Gives the organisation the ability to easily create executable
workflow diagrams of business processes in a graphic
environment.
 Takes a significant amount of time to develop and put in to practice.
 Clear and easy to follow visually. 
 Aligns processes with companies values and capabilities. 
Implementation – Environment Mapping (Business Process and Workflow Modelling)
Why – To give an organisation the ability to easily create executable workflow
diagrams.
How – The final output of this method is an improvement in the way the
business process works. The focus of the improvements is on ‘value added’
actions that make the customer experience and service better. The aim of
modelling is to illustrate a complete process, enabling managers, consultants
and staff to improve the flow and streamline the process.
 Resources: 1) Easy access to documentation for all those involved throughout the design and manufacture of the
product/service is essential for this method to work.
2) When developing sketches/diagrams, a cross-functional team is needed, using large sheets of paper around a
large table will help with inclusivity and interaction.
3) For help with understanding and creation of diagrams, online resources are available;
www.ultimus.com/BusinessProcessModelling/
4) Pre-planning with the use of process identification, information gathering, interviewing and mapping, and
analysis will give the most effective results
131
Strengths Weaknesses
 Can be used as a process documentation guide.  Need to ensure everyone understands the document contents.
 Used for four basic steps in design; process management,
discovery, assessment and redesign and deployment.
 Without clear documentation, a process can quickly fall into
disarray.
 Provides organisation specific information.  A guide for every process is needed.
 A good base for the documentation will mean that it can easily be
added to as time goes by.

Implementation – Community Documentation
Why – To provide a process documentation guide to help with development
and implementation.
How – Having a process and system for keeping documentation for all parts of
the design process can help with the management of the entire process.
These documents also need to be accessible to everyone as it may aid with
discovery and the development process.
 Resources: 1) Easy access to documentation for all those involved throughout the design and manufacture of the
product/service is essential for this method to work.
2) When developing sketches/diagrams, a cross-functional team is needed, best based on a computer system with
easy access across different departments in different geographic locations.
3) For help with understanding and creation of diagrams, online resources are available;
www.ibm.com/developerworks/library/ar-procdoc/
4) Pre-planning with the use of process identification, information gathering, interviewing and mapping, and
analysis will give the most effective results
132

Document 2 - Interns@Strathclyde

  • 1.
    1 THE UNIVERSITY OFSTRATHCLYDE, GLASGOW Review of Design Methods and Tools Innovative Problem Solving; The use of design methods towards innovative problem solving and solutions in an engineering context. Kerrie Noble, 3rd Year, MEng, PDE Dr. Hilary Grierson, Department of Design Manufacture and Engineering Management Abstract: This document contains a review of design methods and tools used within the design process. The methods have been grouped depending on the stage at which they are most suitable used within the design process. 13/11/2012
  • 2.
    2 Document 2 Overview..................................................................................................................................................................................................................... 2 Current Situation Assessment.......................................................................................................................................................................................................... 2 Future Situation Assessment ........................................................................................................................................................................................................... 2 Evaluation ........................................................................................................................................................................................................................................ 2 Development.................................................................................................................................................................................................................................... 2 Implementation ............................................................................................................................................................................................................................... 2
  • 3.
  • 4.
    4 Report DeliverableDocument4–Reportand Appendices Report Project Overview Diagram Document2 Overview This document provides a critical overview of available design methods and tools which can be used in the Silver Bullet process. The five stages of the Silver Bullet process, the current situation, identifying what could be different, evaluation, further development and implementation have been addressed in this document. The design methods and tools have been categorised into the five Silver Bullet stages and strengths and weaknesses of each method have been identified. The information has come from many sources, including the web. (See deliverable document 4 for details of sources).
  • 5.
  • 6.
    6 Strengths Weaknesses  Identifieskey internal and external factors which are critical to success  May persuade the user to compile lists rather than being actively involved with design or thinking what is actually important in achieving objectives  The importance of the individual points gained is revealed through the strategies they create  Uncritical about findings  Can be adapted for use in any decision making process  No prioritisation is given  Asking and answering meaningful questions during the analysis will maximise benefits of the study and competitive advantage  If not used correctly then SWOT outcome could be totally disregarded  Improves knowledge of company’s own strengths, weaknesses, technology and threats  May not create an impartial overview unless used correctly Current Situation Assessment – SWOT Analysis How – Set an objective, what is the organisation going to do? Assess the present situation of the organisation. Analyse existing strategies and plot in the SWOT chart. Define the issues found by using the SWOT landscape.  Resources: 1) A short, specified amount of time 2) 3 people, maximum, to conduct appropriate research 3) 1 person to create the table and landscape 4) Use an online SWOT tool http://www.smartdraw.com/specials/ppc/swotanalysis.htm?id=136790&gclid=CNjJh6mk6bACFccJtAodOFSP8A SWOT chart SWOT landscape Why – To identify niche gaps, opportunities and threats within the market by assessing the internal capabilities of the company/organisation.
  • 7.
    7 Strengths Weaknesses  Providesa more in-depth market overview than SWOT  Outcome is not beneficial unless directly related back to the company and its strategies/objectives outlined in a SWOT analysis  Includes important and influential design areas such as environment, legal and technologies  It is difficult to forecast future trends with an acceptable level of accuracy  Highlights existing technologies which can be incorporated  Uncritical about findings  Helps to avoid taking action which may lead to failure  May persuade the user to compile lists rather than being actively involved with design or thinking what is actually important in achieving objectives Current Situation Assessment – PESTEL Analysis Why – To understand the market growth/decline, business position, potential and direction for operations. How – PESTEL stands for Political, Economic, Social, Technological, Environmental and Legal. By using the PESTEL framework, conduct analysis into each of the defined areas. PESTEL Framework  Resources: 1) A short, specified amount of time 2) 3 people, maximum, to conduct appropriate research 3) 1 person to collate findings 4) Use an online PESTEL tool http://rapidbi.com/the-pestle-analysis-tool/
  • 8.
    8 Strengths Weaknesses  Agood visual parametric painting helps to visualise the relationships identified.  Hundreds of parameter cross-plots must be produced to be of full value.  Simple. Do not try to be clever; with a greater understanding useful combined parameters will emerge.  The reason for doing a particular cross-plot may first appear to be illogical.  Conclusions will always be drawn and only relevant information will be kept.  Participants must be happy, willing and able to do many cross- plots without being able to deduce a reason for doing so.  Knowledge gained will provide a direct input for the PDS   Can highlight a group of potential future suppliers needed for the future of the design, incorporates the wider thinking of the design process  Current Situation Assessment– Parametric Analysis Why – Used to identify a product’s place in the market in relation to the competition, and also to gain insight into the make-up and interrelationships between the parameters inherent in the product under consideration. How – Analyse competing products from a consideration of published catalogue data. Seek out relationships between parameters for a particular product area under consideration. Cross-plot parameters to see if relationships exist between them.  Resources: 1) Generally better completed with one person 2) Computer 3) Wall/board space to display plots in order to undertake useful comparisons 4) Appropriate data analysis software, e.g. matlab
  • 9.
    9 Strengths Weaknesses  Eliminatesset-up logistics by leveraging scheduled marketing presentations.  Requires a skilled observer, with attention to detail, to make the best out of the evidence gathered.  Maximises the amount of customer input per briefing session.  Very time consuming and may be logistically difficult.  May provide excellent stories  Product/performance would feel the need to undergo significant change as a result of this method, or it may be perceived as spying.   The researcher should listen to the presentations without interrupting or giving feedback, this limits the information gathered and does not allow for the research to have an input into the direction the session follows. Current Situation Assessment – Fly on the Wall Why – To obtain verbatim quotes from customers while remaining unobtrusive and not interfering with the presentation. How – Conduct the study at an appropriate briefing or presentation to gain a potential source of direct and immediate thoughts, feelings, needs, problems and priorities of customers and users.  Resources: 1) Preferable option is to film the presentations if allowed. 2) One researcher to film and listen, a small group of around 6 to analyse the film at a later date as this may encourage different perceptions of the same problem to arise. 3) White board or wall area to clearly display the key thoughts and feelings which have come from the analysis, allowing for ideas to be posted around these statements.
  • 10.
    10 Strengths Weaknesses  Buildsemployee involvement within the project.  Requires a skilled observer with attention to detail to make the best of the outcome.  Generates relevant, quantifiable data and may provide excellent stories.  Time consuming and may be logistically difficult.  Provides a deep and relevant understanding of how people really use your service/product.  Wider ethnographic research is required to maximise the output from this particular type of research.  Provides a more holistic view of how a complex system/product works, including identifying the interaction between the user, the product and the organisation.  Current Situation Assessment – Observation and Shadowing Why – To understand how people behave within a given context. How – Create a set amount of time to observe or shadow someone of particular interest in the area of the project. Note observations that are made, paying particular attention to problems or issues which arise.  Resources: 1) Photographs and visual aids will help as a reference at a later date. Displaying them in a ‘mood-board’ style may be useful. 2) Access to other forms of ethnographic research, (visual, video etc.) 3) An ‘inclusive’ group discussion of findings may help to spark ideas, may be best to have a circular table with all the photographic evidence spread in the middle.
  • 11.
    11 Strengths Weaknesses  Maybe able to provide information on aspirations, emotional reactions and other hidden/non-spoken information.  Expensive in terms of time and travel costs.  Easier to conduct than group interviews and allows involvement of the individual to be built within the process.  Requires good interview skills.  Provides relevant data and also may uncover information that wouldn’t be brought up in a group situation.  Unstructured interviews may lead to inappropriate data being gathered and result in the interview taking a direction which was unhelpful and unforeseen. Making it difficult to analyse and quantify results.  A one-on-one situation allows for the clarification of points between the individual and the researcher, this means there can be no misinterpretation of meaning.  May make interviewees self-conscious. Current Situation Assessment – Individual Interviews Why – To gain a deeper insight into people’s needs and perspectives. How – Can be organised around structured questions, follow a more open format through semi-structured questions, or be unstructured with no prior questions. The interview may take an empathic turn where the exchange of questions is not just seen as scientifically neutral or objective – instead it is a process of collaboration.  Resources: 1) A neutral, relaxed setting is required to make the interviewee feel at ease and provide the best outcome. 2) Early in the design process the structured approach will be more useful; a structured set of questions will be needed. Could use Survey Monkey to help with this.
  • 12.
    12 Strengths Weaknesses  Thetime required, the number of people needed to conduct the questionnaire and the costs are all very low.  An expertise in questionnaire structuring will be required in order to achieve the best result from the activity and to ensure the information collected is relevant.  A good source for gathering research which is unattainable through the use of other methods.  You may incur low response rates or inaccuracies within the responses which will be of no relevance to the research. There is no opportunity to clarify responses given.  Helps to set an early design direction, by canvassing opinion, and helps to support further investigation.  The structured format and length of the questionnaire may restrict the freedom of response given.  Good ability to reach a large variety of people within a very short time scale.  May lead to unrealistic expectations.  Yields relevant, quantifiable data which is easy to summarise. The anonymity of the data collected may also encourage honesty.  Current Situation Assessment – Questionnaires and Surveys Why – Provides qualitative and quantitative information enabling a comparison of different responses to the same set of structured questions, enabling an insight into users’ thoughts and concerns. How – Questionnaires should be as visually clear and as inviting as possible. Can be structured using three types of questions; open – answers can be anecdotal or open-ended; structured – requiring fixed answers such as ‘yes’ or ‘no’; and semi structured – containing both open and structured questions. Normally conducted on a random basis in a public area or on the internet, and in forums.  Resources: 1) The use of web forums and user forums will help increase response rates. 2) Use of programmes, such as Survey Monkey, will help to ensure the layout and style of the questionnaire is correct and easy to use.
  • 13.
    13 Strengths Weaknesses  Providesrelevant and quantifiable data.  Does not build employee involvement within the process as the method is best conducted on an individual basis.  The ability to search for key components, with easy access over the internet means the method is fast and easy to use.  Not necessarily focused on HRD (Human Resource Development) – more of a technical method which focuses on numbers and technical data.  Inexpensive, most information can be gathered for free from the internet.  May not identify causes, problems or concerns within the particular area of interest.  May build management involvement within the design process as they may be able to supply original organisational documents.  May not provide visibility for the objective of the research or the direction of the project as a result of the research findings. Current Situation Assessment – Organisational Documents Why – To attain an overview of the business and gather technical data on the product/issues which are being considered. How – Organisational websites will contain relevant documents which can be accessed. The Kompass Directory and CBD –Current Business Directories will provide information for companies from many industrialised countries. For US companies, the Thomas Directory will provide relevant information for some companies. Technical Indexes Limited also produces Product Data Books which can help to provide information.  Resources: 1) Computer, internet access, access to organisational documents from management 2) Kompass Directory, Engineer Buyers’ Guide, Technical Index Limited, CBD (Current British Directories), Thomas Directory, specialist libraries, sheets published by the Engineering Science Data Unit 3) One researcher to carry out activity on an individual basis
  • 14.
    14 Strengths Weaknesses  Providesability to clearly inform the design process by observing real activities and behaviours.  Requires a large allocation of time and high expertise in order to achieve an acceptable output which has been highly analysed with a high attention to detail.  Has the ability to verify that a chosen solution is robust enough to meet the stated requirements, and any unanticipated changes that it may introduce in use.  There is a high risk of misunderstanding or misinterpreting an observation.  Provides both a quantitative and qualitative analysis of the data obtained.  The absence of relevant questions will decrease the suitability of the information gathered, with a risk the study will no longer be relevant.  Allows for first-hand interaction with the user with the ability to question actions to gain a deep understanding.  May infringe on the rights of the participant’s privacy. Current Situation Assessment – Day in the Life Why – To gain a user insight and an in depth understanding. How – Undertake a study in which the designer follows the subject through a typical day, observing and recording events to create an accurate picture of what is happening throughout the day. This may need to be repeated over several days in order to gather a balanced perspective. Map the outcome, or illustrate through a storyboard, to show what happened, in order to identify problem areas, and to illustrate how time is assigned to various activities.  Resources: 1) Notebooks, cameras, pens, paper, voice recorders, Skype, sms messaging, software http://directmailmac.com/ 2) A large wall or display area to display the outcomes of the research in order to encourage discussion on the observation.
  • 15.
    15 Strengths Weaknesses  Allowsconsideration of sensitive areas of user need that require private disclosure.  Requires a large amount of time and expertise in order to complete a high quality analysis of the results from the probe.  Enables access to areas of research which the designer cannot gain through interview or observation.  The main objective is to activate the user to describe their insight in a more creative way; if the outcome is not as anticipated or the user is detached from the process the outcome will not be relevant.  Helps to set an early design direction with direct identification problematic areas and concerns.  Difficult to get an answer rate which is suitable for generalisation.  Only requires input from the design team to analyse the results and therefore comes at a relatively low cost.  It is assumed that the participant will have high motivation to complete the study; this assumed high motivation may give distorted results.  High level of user interaction with the design process.  Current Situation Assessment – Design Probe Why – To provide a self-disclosed insight into people’s lives. How – Also known as cultural probes or user diaries, the designer prepares a research kit which is given to the user to record aspects of their lives autonomously, independent of the designer. May be prepared for a specific user, given to many users, or placed in an environment to collect information, more generally, from users of that space.  Resources: 1) Notebooks, cameras, pens, scissors, stickers, postcards, diaries, maps, question cards, tools for mapping and drawing. 2) A large wall or display area to display the outcomes of the research in order to encourage discussion on the observation.
  • 16.
    16 Strengths Weaknesses  Givesa concise reference of all of the key points found from research which can be easily shared amongst the design group and with others involved in the design process.  Takes time to compile properly and does not add any development to the product, in terms of design, during this time.  Good tool for eliminating unnecessary information and allows the group to refocus its search after a wide area of research.  Needs to be believable in order to work effectively as a tool.  Allows for reflection and a check-back to the design brief. Allowing the designer to take back full control of the process.  Requires a great deal of expertise to ensure valuable information is included and the persona is believable.  Can help to both stimulate and evaluate new design concepts.   Can help with the justification of new innovations to stakeholders and the testing of ideas when access to the user is not available.  Current Situation Assessment – Design Persona Why – To bring together people’s needs and user data and combine it in such a way as to bring it to life for the designer. How – Personas are figurative models, as opposed to abstract models, which are constructed to resemble real users, right down to photographs, background information and personal history. The most relevant user, market and data research will be combined with these areas in order to make a fictional character which will represent the target consumer within the given market.  Resources: 1) A display area for the finished document so the design team have constant and instant access 2) Photographs, previous research, internet, computer .
  • 17.
    17 Strengths Weaknesses  Enablesdesign teams to analyse tasks and gain a deeper insight through repetitive viewing.  Requires moderate expertise, cost and a large number of people to be involved over a long period of time.  Produces a good contextual insight, especially when exploring the effectiveness of new prototypes in the development stage of the design process.  Observer bias and emphasis play a role in the outcome of the activity.  Provides a much more comprehensive perspective of the user and their environment then other research methods.  Information and results are highly dependent on the researcher’s observations and their interpretations of these.  Behaviour observations are best understood when observed within their natural environment and video ethnography allows for this.  Quantitative analysis is almost impossible due to the qualitative nature of the method. Current Situation Assessment – Video Ethnography Why – To gather video-based evidence and gain an insight into user behaviour. How – Use a video camera to capture everyday events as they happen, within a set context. Capture people’s interactions with one another and the environment around them.  Resources: 1) Notebooks, cameras, pens, diaries, maps, question cards, tools for mapping and drawing. 2) A large wall or display area to display the outcomes of the research in order to encourage discussion on the observation.
  • 18.
    18 Strengths Weaknesses  Avery quick method for talking to a wide variety of people and gaining a contextual view of a particular topic.  Permission must be sought from forum administrators as the designer will be joining the forum for a professional purpose.  The expertise, time, cost and number of people required to carry-out this method are all very low.  Involves ‘stories’ about behaviour and do not examine actual user/stakeholder behaviour.  It enables the building of a picture on a subject where very little information is formally available or when access to the user is limited.  The data is classed as self-report data and depends on the participant’s truthfulness and recall accuracy. What people report may be quite different from what they actually do.  Has an open-ended quality which focus groups cannot achieve.  Dominant participants can skew the results. Conflicts and power struggles can alter the group dynamics and lead to a non-creative environment.  Encourages constructive and on-going discussion.  Current Situation Assessment – Web Forum Why – To gain general insights into a specific topic. How – If a web forum is an online community that focuses on a shared interest or experience. If a forum exists that is relevant to the interest of the design/project then specific questions can be posted for the online community to discuss and respond to. The designer may also find general insights by reading archived posts. The forum can also be used to post information on more detailed surveys and questionnaires.  Resources: 1) Computer, an established forum or the construction of a forum 2) If required seek permission from the administrator and post a pre-planned set of questions.
  • 19.
    19 Strengths Weaknesses  Canhelp in the exploration of relationships between the developed product and suppliers with consideration given at an early stage in the design process.  Concentrating on only five features may narrow the research conducted at an early stage, leading to discarding of some important information.  Increases ideas and discussion on improving product differentiation during development.  A clear market must be known before commencing the study otherwise the outcome will be vague and of little use to the product development.  Can help with further identifying what competitors are doing and how successful they are.  The model does not consider non-market changes, such as political issues, which can be key and highly influential during the design and launch of a new product.  Shown in a more visual and succinct way than that of the PESTEL and SWOT analysis.  Current Situation Assessment – Porter’s Five Forces Why – To model the industry/business market which the new product/service will enter and show how five main forces influence that particular market area. How – Take the five forces – supplier power, threat of new entrants, threat of substitutes, buyer power and threat of rivalry – and conduct research into who, what, where, why and when these forces will affect the industry/business market for the new product/service which is being developed.  Resources: 1) post-its (to help brainstorm key issues to include in the model), large A3 paper, markers 2) A circular seating position for a group of around 6 people to encourage discussion during the creation visual graphic 3) A large wall space to display the outcome and provide a focus point during the rest of the design process
  • 20.
    20 Strengths Weaknesses  Providesa deep understanding of the theoretical requirements of the user, something which cannot be tested during methods such as empathic modelling.  The outcome is entirely based on designer perceptions and is estimated through the use of some user input. This may lead void outcomes and a non-relevant product for the market.  Quick to complete with clearly visible problematic areas, meaning there can be little misinterpretation and little analytical skills are needed.  It is difficult for the designer to remain objective; there is an urge to become bias towards one type of result.  Gives a comprehensive coverage of a wide variety of user related areas.  Current Situation Assessment – Assessing Capability Levels Why – To assess the capability a product demands in order to use it. How – A person’s capability is split into seven main categories; vision, hearing, thinking, communication, locomotion, reach and stretch, and dexterity. The ability required by the product during use and the actual ability of the user are plotted against each other, in all seven categories, allowing comparison and identification of problem areas.  Resources: 1) post-its, A3 paper, markers, computer 2) A circular seating position to encourage discussion during, and after, the creation of the visual ability representation 3) A wall space to display the outcome
  • 21.
    21 Strengths Weaknesses  Themethod is valuable and powerful in terms of the outcome it has the potential to produce.  Requires expertise and intelligent application in order to find the right ‘why’.  Can produce corrective and preventative action as it can produce enormous improvements to the smallest area of the design.  There is a want for the designer to stop at the first or second answer as they become blinded by the symptoms or setting for the first ‘apparent’ cause.  Can create a situation where all of the ‘right’ people are included in the process of sitting in a room and discussing the possible root causes of a given defect within a design. (By right people it means a mix of disciplines from across the design process).  There is a risk of accepting answers which are too simple due to ‘kneejerk’ answers given to questions. Current Situation Assessment – 5 Whys? Why – To dig below the outward symptoms of a problem in order to find its real root cause. How – The method involves asking why five times in succession. The answer to one question should lead you to asking the next why, although it may not always be possible to get an immediate answer to the next question.  Resources: 1) post-its, A3 paper, markers, 2) A circular seating position to encourage discussion during, and after, the creation of the visual ability representation and a wall space to display the outcome and encourage further discussion and development 3) A group of 6 – 12 people will provide the best and most comprehensive outcome
  • 22.
    22 Strengths Weaknesses  Gathersdetailed information about the user over a prolonged period of time.  All the information gathered is self-reported, so the outcome will be highly dependent on the honesty and open-ness of the person responsible for keeping the diary.  Feedback is often provided while the user is interacting with the product so there is less of a lag, which is evident in other methods.  Involves ‘stories’ about behaviour and do not examine actual user/stakeholder behaviour.  Encourages constructive and on-going discussion.  Dominant participants can skew the results. Conflicts and power struggles can alter the group dynamics and lead to a non-creative environment.  This type of study avoids cohort effects as the study is conducted on one group of people over time, rather than studying lots of different groups of people.  Current Situation Assessment – Diary Study Why – To track specific items, users or behaviour. How – The study requires users, or observers of users, to keep track of activities or events in the form of a diary or log for a particular period of time. Specific items such as mobile device usage, use of personal calendars, coursework or general activities which can take place in 30 minutes every day can be tracked. Diary entries can include text accounts of events, pictures, video, audio, sketches and voice-mail.  Resources: 1) Notebooks, cameras, pens, diaries, maps, question cards, tools for mapping and drawing. 2) A large wall or display area to display the outcomes of the research in order to encourage discussion on the observation.
  • 23.
    23 Strengths Weaknesses  Generateeffective contextual data which is presented in an accessible form.  Is only able to capture impressions of lifestyle rather than full descriptions.  Represents a wide sample of users over a short period of time.  Users are left unsupervised to carry out the study; therefore they may not follow the study instructions correctly, corrupting the result of the study.  Captures attitudinal and lifestyle data more naturally than other formal methods.  Users are free to take pictures of their choice, however this may lead to accidental or intentional discarding of what may be important information.  Enables efficient, visual scanning of the photographs from several users.  Current Situation Assessment – Photo Study Why – To report important aspects of the users’ lives and the context surrounding them. How – A sample of users are given a set of ‘missions’ to take photographs which highlight important aspects of their lives and day to day context. These may be things that they value, cause problems, generate certain feelings etc. Data from the study will then help to highlight opportunities for new technologies and possible barriers to their acceptance.  Resources: 1) Envelopes and paper outlining the required missions, cameras, software to assemble images 2) A large wall or display area to display the outcomes of the research in order to encourage discussion on the observation.
  • 24.
    24 Strengths Weaknesses  Identifiessignificant user concerns which may not have been evident during other research.  May be hard for the designer to maintain an objective view with previously established bias towards particular design ideas and features.  Builds teamwork across the design team and other business areas which may be involved.  Has no direct contact or input from a user’s perspective meaning the result may be estimated an unreliable.  Consolidates lots of customer data into meaningful design criteria.   Involves the entire design team so that a mutual understanding of all of the data can be shared.  Current Situation Assessment – Claims Analysis Why – To examine the positive and negative consequences of design features that are described in current or future scenarios of use. How – A ‘claim’ is a statement of the consequences of a specific design feature or artefact on users and other stakeholders. These ‘claims’ are made for several design features and are discussed among the design team, with input from various knowledge areas and business sectors.  Resources: 1) Post-its, pens, wall/display space 2) Circular seating position to encourage discussion and ensure everyone feels included
  • 25.
    25 Strengths Weaknesses  Generatesdetailed, precise information on the nature of expert performance in a specific task of interest.  Analysis of the information gathered during the task can be very time-intensive.  When implemented correctly the analysis can be a highly valid source of information on expert cognitive processes.  The task analysis does not always capture other non-cognitive attributes necessary for accomplishing results.  Provides systematic procedures for ascertaining expert cognitive processes.  The results of the task analysis can be misleading when expert users have performance capabilities above that of others. Current Situation Assessment – Cognitive Task Analysis Why – To deeper understand activities which require a lot of cognitive activity from the user. How – The steps contained within a cognitive task analysis are; mapping the task to be analysed, identifying the critical decision points within the task, clustering, linking, and prioritising them, and characterising the strategies used.  Resources: 1) Make use of a wide range of available methods for help with conducting a cognitive task analysis such as; applied cognitive task analysis (ACTA), critical decision method (CDM), skill-based CTA framework, task knowledge structures (TKS) and the cognitive function model (CFM) 2) A large wall or display area to display the outcomes of the research in order to encourage discussion on the observation. 3) Circular seating position to encourage discussion and ensure everyone feels included 4) A defined list of tasks, frameworks to help conduct the analysis, willing participants, pens, paper, computer, a mixed group of expertise to help with analysis and outcome, group of 6-12 people
  • 26.
    26 Strengths Weaknesses  Theapproach is very simplistic to understand and conduct.  The method is not highly structured.  The method can highlight concepts which are hard to understand.  The expert needs to have an awareness of concepts for a particular design project in order to relay relevant information.   The non-expert may feel intimidated if the expert’s corrections are too harsh. Current Situation Assessment – Teach back Why – To extract information from experts that would be useful for gathering requirements, learning about work flow and understanding mental models. How – A subject matter expert is asked to describe a concept, task or something else related to a particular domain or product. The non-expert listens carefully to the expert. The non-expert is then asked to ‘tech back’ what the expert had previously explained. When the non-expert is teaching back what they have learned, the expert corrects any misinterpretations, errors or simplifications. The session is then repeated with another expert who teaches the non-expert. The transcripts from all sessions are then examined for common misinterpretations, errors or simplifications.  Resources: 1) A quiet room in which a conversation can be held without interruptions, with a relaxed setting and atmosphere 2) Pens, paper (to record what is said and any misinterpretations, errors or simplifications)
  • 27.
    27 Strengths Weaknesses  Moremeaningful then flow charts or other technical diagrams for conveying the user experience.  Interaction between the storyboard and the user is limited.  Does not require programming skills.  Project team members may be reluctant to hand draw if they feel they are bad at it.  Does not require artistic skills.  There are few data on the effectiveness of storyboards for user interface design.  Provides a quick way to sketch ideas.  Interactive, non-linear storyboards are more desirable but take more time to develop.  Complements verbal scenarios.  Not practical for detail design or covering all use cases.  Provides a way to organise use cases into a coherent description of users’ actions.  Future Situation Assessment – Storyboard Why – To illustrate the interaction between a person and a product in a narrative format. How – Firstly, you need to decide what to include. Understand the users, their backgrounds and goals, the system and its features. Put together a design team and brainstorm about the storyboard. Identify people and artefacts in the storyboard and develop the storyboard scenarios. Identify key frames within the storyboard and develop the storyboard around these.  Resources: 1) Paper, pens, pencils, large whiteboard (to brainstorm ideas), software tools (such as power point, Photoshop and Illustrator. 2) Requires large display spaces so each approach can be displayed together in order to hold a good discussion
  • 28.
    28 Strengths Weaknesses  Requiresalmost no facilitation or moderation, like a conventional brainstorm, the group can feel free to contribute at their own free will, more formal discussions will take place once the brainstorming has finished.  Requires a robust dedication to quantity and not quality.  It is a useful way to get over ‘design blocks’ that are slowing development.  Can, at times, seem chaotic and intimidating.  More active and engaging than traditional brainstorming, activity is seen to increase creativity.  May not be appropriate for some business or international cultures. Current Situation Assessment – Postcard Portraits Why – To gain familiarisation with users’ needs and problem areas in order to generate ideas. How – Draw a quick sketch/portrait of potential users and problems within the design project area. Use these pictorial descriptions to spark discussion. Hold a short brainstorming session on each postcard to generate potential solutions. The idea is to develop a spider-web of problems and solutions.  Resources: 1) A neutral, relaxed setting is required to make the participants feel at ease and provide the best outcome. 2) A large room, with a clear space to enable the design team to move around freely, in order to place sticky notes on large wall spaces with ease. 3) Post-its, pens, paper, group of 6-12 people
  • 29.
    29 Strengths Weaknesses  Thebasic method does not require a lot of training.  The method can quickly get out of control and intervention may be needed to take control of the group and direct them away from the ridiculous without seeming like a dictator. A focus which has gone outside the bounds of usefulness or appropriateness needs to be changed. Current Situation Assessment – ‘Yes, and….’ Why – To explore possible user scenarios, generate requirements, brainstorm, or envision future concepts. How – This technique is borrowed from improvisational theatre. The basic method is to assemble a group and provide a starting statement or scenario. Consider if there are props you could use to trigger ideas, for example an iPad. Ask someone to write the ideas where they are visible to the group or video the session to capture all the information. Have the leader of the group start with the introductory statement. Encourage someone to say, ‘Yes, and’ and then add something new. Continue with the activity until the group slows down.  Resources: 1) A room with a large empty space, all chairs and tables will need to be cleared out of the way for the duration of the exercise. 2) Participants need to stand in a circular formation to encourage engagement 3) Props (if necessary), whiteboard, pens, paper, video recorder
  • 30.
    30 Strengths Weaknesses  Usefulfor understanding and solving a problem.  Must be performed systematically, usually as part of an investigation, with conclusions and causes identified in order to be effective.  Provides the ability to look at complex systems around problems in order to identify key points of failure.  Root causes identified depend on the way in which the problem or event is identified.  Can minimize the need for Root Cause Analysis in the future by using Cause and Effect Diagrams, 5 Whys, FMEA and Kaizen to help develop the product/service during this process.  A sequence of events or a timeline, describing the relationships between contributing factors and root causes must be identified for the analysis to become effective.  Comprehensive toll, system-wide review of significant problems as well as the events and factors leading to them.  Current Situation Assessment – Root Cause Analysis/Error Analysis Why – To identify the root causes of problems or events in order to prevent the recurrence of similar harmful outcomes. How – The analysis must start with a factually defined problem. Gather data and evidence which leads to the final failure. Ask ‘why?’ and identify the causes associated with the sequence of steps towards the defined problem or event. Classify causes into causal factors that relate to an event in the sequence. Identify corrective actions and solutions to the problems and then implement.  Resources: 1) A neutral, relaxed setting is required to make the design team feel at ease and provide the best outcome. 2) A circular seating position of the participants will encourage engagement with the activity and hopefully ensure no one is neglected. 3) For help with understanding and the construction of diagrams etc. software and online tools can be used; www.mindtools.com/pages/article/newTMC_80.htm
  • 31.
    31 Strengths Weaknesses  Allowsa direction to be agreed on before committing large amounts of time and money.  Depending on the project, sketching will have different advantages, fitting well with some and less so with others.  Allows for a visual exploration in multiple fields of design, in multiple product/service areas.   Can identify bottlenecks in existing processes/products/services, as well as visually defining solutions for improvements/new products.  Current Situation Assessment – Process Sketches Why – To help visualise the process in which the product/service is used. How – First define the process to be considered. Identify each of the stages involved in the process and where and when the product/service is used within these and how it is used. Sketch a representation of each of the stages to help the entire design team visualise what is happening during the process.  Resources: 1) Easy access to documentation for all those involved throughout the design and manufacture of the product/service is essential for this method to work. 2) When developing sketches, a cross-functional team is needed; using large sheets of paper around a large table will help with inclusivity and interaction. 3) For help with understanding sketching tutorials, online resources are available; http://psd.tutsplus.com/tutorials/drawing/the-role-of-sketching-in-the-design-process/
  • 32.
  • 33.
    33 Strengths Weaknesses  Suitablystructured questionnaires can give a powerful insight into customer needs.  A random approach to this method will leave fundamental gaps in the information gathered.  Structuring interview schedules or questionnaires around elements of the PDS provides relevant information.  Using inappropriate information gathering methods will lead to unjustified conclusions.  Fast and inexpensive  Failure to develop a coherent, logical and integrated plan for conducting the needs analysis will lead to the failure to gather appropriate information.  May build management involvement within the design process.  May not identify causes of problems or failures, only suggests what the customer wants to see within the product. Future Situation Assessment – Needs Analysis Why – To establish the true needs of the customer – the ‘voice of the customer’- VOC. How – Obtained by extensive examination of the views and reports of representative bodies, market data publications (buying habits), reports giving official opinions and reactions to products in use and also by structured interviews or customer questionnaires.  Resources: 1) Generally better completed with one person 2) Computer 3) Wall/board space to display plots in order to undertake useful comparisons 4) Use an appropriate needs analysis template http://www.buzzle.com/articles/needs-analysis-template.html
  • 34.
    34 Strengths Weaknesses  Comprehensiveanalysis provides a greater insight into the product area and its domains.  Requires handling and obtaining of large amounts of information from a wide variety of sources.  Leads to the preparation of a PDS.  Ideas and solutions will start to be generated, however this is not the purpose of this activity, and ideas should be recorded but not acted upon.  Builds involvement from a wide variety of business sectors.   The procedures of this activity will trigger a creative impulse, allowing creative energies to be channelled in the most productive way from the beginning.  Future Situation Assessment – Attribute Listing/Matrix Analysis Why – To focus on the attributes of an object and see how each attribute could be improved. How – A matrix with all features of comparable competitor products on the vertical axis and the model types on the horizontal axis. The matrix is completed to show which models incorporate which features.  Resources: 1) Requires cooperation between different sectors of the business 2) Computer 3) Computer based template to make compilation easier
  • 35.
    35 Strengths Weaknesses  Learningfrom industry leaders and competitors can spark ideas and help increase your credibility.  Does not actively build involvement between people or different sectors of the business.  Availability of free data on the internet provides an extensive and fast resource.  Research may develop into tangents which are not directly related to the problem and will not identify appropriate and relevant information.  You avoid rediscovering what is already known in regards to problems and their solutions.  Data from different organisations may be misleading.  Better at highlighting the main problem areas than some other methods.  Requires a significant amount of time and analysis.  Relevant information develops a list of product requirements which can be used for evaluation at a later stage.  Future Situation Assessment – Benchmarking Why – Identifying the ‘best practice’ in relation to both products and the processes by which these products are created and delivered. How – Look outward, (outside a particular business, organisation, industry, region or country), to examine how other businesses, organisations, industries, regions and countries achieve their performance levels.  Resources: 1) Completed best with one person 2) Requires a very clear, set objective to allow gathering of appropriate information 3) Computer based template to make compilation easier
  • 36.
    36 Strengths Weaknesses  Givesspecific, relevant and direct feedback on issues or design ideas.  Moderately time consuming, but less so than individual interviews, and is difficult to conduct.  Encourages on-the-spot sharing and synthesis of different views which may allow for the development of elicit key topics which were not expected.  Moderately expensive.  Builds involvement for the employee during the process and support for the development of the product.  May be difficult to analyse and quantify data and information gathered.  Best results are produced during use in the latter stages of the design process as a form of validation and evaluation, but can also be useful during the early stages to identify key issues.  Some participants may feel over-shadowed if group dynamics are wrong for the situation. This will lead to people taking a back-seat and not contributing to the process. Future Situation Assessment – Focus Group (Group Interviews) Why – To gain user opinions and attitudes on specific issues and ideas. How – Uses an interview style to allow each group member the chance to contribute, in a coherent and ordered way, to the group session. Group dynamics play a key role, some participants may be empowered, and others may be intimidated. The session should solicit feedback on specific issues or design ideas.  Resources: 1) A neutral, relaxed setting is required to make the interviewees feel at ease and provide the best outcome. 2) A circular seating position of the participants will encourage engagement with the activity and hopefully ensure no one is neglected. 3) Pen and paper to record comments and thoughts.
  • 37.
    37 Strengths Weaknesses  Providesa very practical insight into situations which the design would not normally have the opportunity to experience and would rely on user descriptions for insights.  As this method is just a simulation the outcome cannot be 100% accurate and should be combined with other resources to ensure reliability.  Provides a deep understanding of how your product can be used within a real world context.  It is almost impossible to simulate all details of sensory loss or motor impairment and residual capacities may vary considerably.  Tests initial concepts over a wide spectrum of abilities.  Requires expertise in analysis and observation over a long period of time.  Can provide a benefit to the client as well as the designer, therefore incorporating a wider variety of people within the design process.  The absence of theoretical rules to govern the use of the method may lead to corrupt results if it is not carried out methodically. Future Situation Assessment – Empathic Modelling Why – To gain direct experience of reduced ability and user needs. How – The designer uses a simulation device to gain a first-hand insight into what it is like to live with particular impairments or disabilities while carrying out a particular task. The task is defined as a flow chart and during the simulation the difficulties arising during the task are described by the designer. The difficulties are marked as bottlenecks within the flow chart giving a direct indication of problem areas and concerns for the user.  Resources: 1) Pen, paper, camera, video camera, lenses, Vaseline, ear plugs, blindfolds, tape, coins/buttons, gloves, elastic bands, texts constructed to emulate reading problems, 2) Devising a number of tasks to be performed at the same time can emulate problems with cognitive functioning. 3) A large wall display area to display the outcomes/photographs etc. to encourage discussion.
  • 38.
    38 Strengths Weaknesses  Givesspecific, relevant and direct feedback on issues or design ideas.  Moderately time consuming, but less so than individual interviews, and is difficult to conduct.  Encourages on-the-spot sharing and synthesis of different views which may allow for the development of elicit key topics which were not expected.  Moderately expensive.  Builds involvement for a variety of different people, with different skills, perspectives and opinions within the design process.  May be difficult to analyse and quantify data and information gathered.  Best results are produced during use in the latter stages of the design process as a form of validation and evaluation, but can also be useful during the early stages to identify key issues.  Some participants may feel over-shadowed if group dynamics are wrong for the situation. This will lead to people taking a back-seat and not contributing to the process. Future Situation Assessment – Immersive Workshop Why – To allow users to visualise design ideas, design scenarios and simple prototypes in order to express their thoughts, ideas and concerns. How – A variation of a focus group, concentrating on the design development process. It can be tailored to meet specific aims of its organisers through the setting of the brief and the participants selected. Participants may include designers, engineers, specialists in the area of the theme of the workshop and end users.  Resources: 1) A neutral, relaxed setting is required to make the interviewees feel at ease and provide the best outcome. 2) A circular seating position of the participants will encourage engagement with the activity and hopefully ensure no one is neglected. 3) Pen and paper to record comments and thoughts.
  • 39.
    39 Strengths Weaknesses  Thismethod engages a person’s imagination and encourages a fully response in ways that more formal interview or questionnaire techniques cannot achieve.  Requires a high level of expertise in order to achieve a useful outcome.  Good for exploring subject areas or topics that could be sensitive.  Requires a significant amount of time, cost and people to run the activity.  Speculative design concepts can be tested with early intervention from the user, saving money and development time.  May be difficult to analyse and quantify data and information gathered.  Encourages on-the-spot sharing and synthesis of different views which may allow for the development of elicit key topics which were not expected.  Future Situation Assessment – Intervention/Provocation Why – To develop a greater engagement with the user and a better understanding of their motivation. How – The designer will place 2D graphic visualisations or 3D objects within an environment in order to stimulate a discussion and elicit a response from the user. Interventions can include futuristic prototypes that express new ideas; provocations can include shock imagery or incongruous juxtapositions.  Resources: 1) A neutral, relaxed setting is required to make the interviewees feel at ease and provide the best outcome. 2) 2D graphics, 3D futuristic objects, creative and inspiring surrounding environment 3) Pen and paper to record comments and thoughts.
  • 40.
    40 Strengths Weaknesses  Enablespeople to share in the exploration of imagined or speculative outcomes.  Requires a high level of expertise being used over a long period of time.  Supports design scenarios with a compelling narrative and allows engagement with future outcomes.  Involves a large number of people with a large cost being incurred.  Able to practically demonstrate the potential of a highly speculative idea, gathering support and evidence for presenting to stakeholders and investors.  As the film is entirely speculative, outcomes will have to be verified against real-life situations to ensure reliability.  The visual resource brings to life ideas which are hard to understand when using other, conventional, methods.  Future Situation Assessment – Pseudo-Documentary Why – To provide the designer with a realistic representation of an imagined scenario. How – Present a design scenario in the form of a film that has a documentary format but which is actually staged. Real users of a future product or service can participate in the pseudo-documentary working as actors with the aid of a script. Events and characters are fictitious but can be based on real user insight.  Resources: 1) A detailed script for the film, a large number a variety of users to become actors, a film set, camera, a detailed potential concept, a well-researched market area and potential use 2) A large room where the pseudo-documentary can be screened, inviting multi-disciplinary experts, end users, designers, stakeholders and investors 3) Computer, pen, paper to record comments and thoughts during discussion after film screening.
  • 41.
    41 Strengths Weaknesses  Scenarioscan open-up discussion around broader social challenges and provoke discussion in order to help develop or evaluate ideas.  Requires a considerable number of people, with high expertise to work for a long period of time.  Generates low costs.  Often not based on actual user data which can lead to incorrect assumptions.  Takes a critical and speculative design approach in order to challenge assumptions and preconceptions.  It is often left to the interpretation of the designer to judge how to integrate scenarios into the overall development process.  Creates clear visuals to aid in communication with end users.   Allows testing of large-scale or abstract concepts.  Future Situation Assessment – Scenario Why – To gain an insight in future uses of products and services. How – Scenarios are imaginative, can be presented through a variety of media including texts, illustrated storyboards or films, and can feature multiple characters to describe multiple product or service interactions. Create a storyline which explores how people might interact with a particular design or context of use. By provoking discussion they may help evaluate or test ideas from a human experiential point of view. You may also include scenarios about misuse, outlining how people may interact with the product in an incorrect and damaging way.  Resources: 1) A detailed script for scenario, pens, paper, post-its (to note problem areas and thoughts) 2) A large wall space for display of a storyboard to showcase scenario and to encourage discussion
  • 42.
    42 Strengths Weaknesses  Doesnot require a trained moderator and can therefore be designer led, extending the boundaries of the traditional focus group format.  Requires the input of moderate expertise, time, cost and a number of people.  Encourages constructive and on-going discussion.  Involves ‘stories’ about behaviour and do not examine actual user/stakeholder behaviour.  Provides a space where users can interact with the design process throughout the duration of a project.  The data is classed as self-report data and depends on the participant’s truthfulness and recall accuracy. What people report may be quite different from what they actually do.  Has an open-ended quality which focus groups cannot achieve.  Dominant participants can skew the results. Conflicts and power struggles can alter the group dynamics and lead to a non-creative environment. Future Situation Assessment – User Forum Why – To encourage rich, creative and divergent contributions from potential users. How – Hold an interactive session between designers and users where all attendees contribute to the dialogue and express their own opinion. Forums can be used to explore more open-ended questions rather than just focusing on one main issue.  Resources: 1) A neutral, relaxed setting is required to make the participants feel at ease and provide the best outcome. 2) A circular seating position of the participants will encourage engagement with the activity and hopefully ensure no one is neglected. 3) Pen and paper to record comments and thoughts.
  • 43.
    43 Strengths Weaknesses  Thistask makes it possible to combine the needs of the user with the actual constraints surrounding the use of the product.  The data collected through this method study will not be indicative of every user.  Helps the designer to visualise how and when the product will be used in a real-world context.  The method requires a long time for completion, to allow several studies to be conducted in order to obtain a fuller understanding of use.  Helps to establish a better understanding of the size and shape of the product.   Allows ideas to be eliminated or developed on the basis of sound and scientific research rather than the personal preference of the designer.  Future Situation Assessment – Ergonomic Analysis Why – To understand and detail the likely nature of the interaction between the user and the product. How – Use an ergonomic analysis tool in order to identify areas of stress during the use of the product which may require additional attention in order to reduce the possibility of injury. All activities will be documented for each task and act as a resource which can be referred to throughout the design process.  Resources: 1) Use an ergonomic analysis tool to help with the study - http://www.acsco.com/Ergonomic%20Analysis.htm 2) Visual representations and outputs from the study will enable the designer to visual the context and may aid in the evaluation process later in the design project.
  • 44.
    44 Strengths Weaknesses  Goodmethod for taking suggestions which were made during research and highlighting which are viable suggestions and which were not.  The tool is based on predicting the users’ reaction and therefore the outcome cannot be guaranteed to be 100% accurate.  Enables the voice of the customer to be translated into critical and quality characteristics.  Asking the correct questions during the process of this task can be difficult and can have an adverse effect on the outcome of the design.  Helps within the structuring of other methods such as Quality Function Deployment.  Requires a large amount of research and time given to implementation.  Provides a good visual and comparative aid for evaluation at a later stage of the process.  Future Situation Assessment – Kano Model Why – To help design teams uncover, classify and integrate three categories of customer needs and attributes into the products or services they are developing. How – The simple approach is to ask customers two questions for each of the three types of attributes (threshold, performance and excitement) – 1) Rate your satisfaction if the product had this feature and 2) Rate your satisfaction if the product did not have this feature. The customer should be asked to answer with satisfied, neutral, dissatisfied or don’t care responses. Eliminate or include performance or excitement attributes where their presence or absence respectively led to customer dissatisfaction. Prioritisation matrices can help determine which attributes will help provide the greatest return on customer satisfaction.  Resources: 1) Use Kano model tool to help establish a suitable questionnaire for the completion of the method - http://www.kanosurvey.com/ 2) Visual representation of the outcome, large wall space to display the outcome and encourage discussion, previous research, contact with the potential user, Kano graph to plot the user-disclosed outcome
  • 45.
    45 Strengths Weaknesses  Showsa link between the mapping of means and parts within the product.  Can be quite vague if not completed to a high enough level.  Results provide detailed functions which are directly related to the design of the potential product.  Outcome can be complex and requires a long time given to compilation of a diagram providing information, the majority of which has previously been gathered from other research methods.  Helps to clarify design objectives and sub-objectives and refocus the mind of the designer on the design task.  Can be complex and difficult to produce correctly.  Can be beneficial in the creation and further development of a design proposal.  Can lead to frustration when the design outcome is not as expected. Future Situation Assessment – Function-Means Tree Why – Prepared for the major system, subsystems of components of a product to establish the key functional aspects of the users’ needs. How – The tool is for listing primary functions of a design and various means of achieving those functions. Functions are what the product must do and means are how the product will achieve the functions. Start with high-level product functional expectations and as you move to the right ask how each of the previous functions can be achieved.  Resources: 1) post-its (to help plan the tree before completing it), large A3 paper, markers 2) A circular seating position for a group of around 6 people to encourage discussion during the creation of the tree 3) A large wall space to display the outcome and provide a focus point during the rest of the design process
  • 46.
    46 Strengths Weaknesses  Empowersthe design, and the designers, to exceed normal expectations which in turn provide a level of unanticipated excitement which generates value.  The process of creating the ‘House of Quality’ outcome is long and complex and will require a large amount of time.  Identifies true customer needs instead of listing the customers’ perspective.  As this is a tool with origins from the Japanese Management sector, problems can occur when the approach is tried within a western business environment.  Maximises the positive quality which can be added to a product which adds value also.  As user inputs are found by surveys, and other information collection methods, if this is done poorly then the result of the QFD analysis will also be poor.  Provides a closer link between the end user and the development of a design.  Needs and wants of the customer can change in a very short time period and so the outcome of QFD may be rendered irrelevant by the end of the design process.  Keeps a customer focus within the design process.  Future Situation Assessment – Quality Function Deployment Why – To manage the process of conversion of customer requirements into process controls. How – QFD links the needs of the customer with various product functions by seeking both spoken and unspoken user needs, identifying positive quality and business opportunities, and translating these into actions and designs by using transparent analytical and prioritisation methods.  Resources: 1) post-its, A3 paper, markers, computer 2) A circular seating position to encourage discussion during, and after, the creation of the visual ability representation and a wall space to display the outcome and encourage further discussion and development
  • 47.
    47 Strengths Weaknesses  Improvessafety, productivity and efficiency within the design.  The sizes highlighted and chosen by the method will not be suitable for everyone within the targeted user group.  Improves the competitive advantage the product may have when released to market.   Improves product quality, work process and quality of work life.   Allows for the input of real-world contextual issues to be linked with the developing design.  Future Situation Assessment – Anthropometric Analysis Why – To provide quantitative data related to the measurement of various parts of the human body. How – The analysis is based on a list of dimension definitions of the human body, encompassing different genders and age ranges. By analysing the measurements the designer can use the quantitative data to see variances between the dimensions of any given human being in relation to the general population. This will help illustrate the challenges which will occur when trying to accommodate for a wide spectrum of human measurements and body types within a design.  Resources: 1) Computer, clear idea of target end user, a clear visual image of the proposed design 2) Access to verified information source - http://msis.jsc.nasa.gov/sections/section03.htm
  • 48.
    48 Strengths Weaknesses  Asthe same participants are studied over a long period of time then consistency of research in habits and movements can be achieved.  Inconsistent variables over the duration of the study will mean all that is tested in the study is the learnability of the system.  Allows the researcher/designer to identify developmental trends by looking for common attributes the subjects of the study share.  The inability to study the entire population, and the need to focus on a specific subset, may result in discrepancies within the study results.  This type of study avoids cohort effects as the study is conducted on one group of people over time, rather than studying lots of different groups of people.   Combines both qualitative and quantitative data to give a more comprehensive study of behaviour.  Future Situation Assessment – Longitudinal Study Why – To understand the long-tern effect of changes in products, processes or environment. How – Repeat observations or examination of a group of users over a prolonged time period, at regular intervals, with respect one or more study variables. Can be conducted over the duration of anywhere from a few days to several decades.  Resources: 1) Notebooks, cameras, pens, diaries, maps, question cards, tools for mapping and drawing. 2) A large wall or display area to display the outcomes of the research in order to encourage discussion on the observation.
  • 49.
    49 Strengths Weaknesses  Involvesthe entire design team so that a mutual understanding of all of the data can be shared.  Requires expertise and knowledge within the group and subgroup categories.  Builds teamwork across the design team and other business areas which may be involved.  Can be very time consuming and requires the participation of a large number of people.  Consolidates lots of customer data into meaningful design criteria.  Can become exhausting due to the constant discussion and it may seem to the design team that the discussion is leading nowhere.  Identifies customer work practice.  Future Situation Assessment – Affinity Diagramming Why – To consolidate ideas from a group and obtain consensus on how information should be structured. How – Concepts, which are written on cards, are sorted into groups and subgroups. The groups and subgroups which have been identified can then be used to analyse findings from field studies, identify group user functions as part of the design, and analyse findings from a usability evaluation. The designer can interpret the data in order to show the range of a problem, uncover similarities among problems from multiple customers, and give boundaries to the problem while also identifying areas for future study.  Resources: 1) Post-its, pens, A3 paper, relevant research information 2) A large wall or display area to display the outcomes of the research in order to encourage discussion on the observation. 3) Circular seating position to encourage discussion and ensure everyone feels included
  • 50.
    50 Strengths Weaknesses  Allowscomparison with predicted performance across different variations on a user interface.  The method is only valid for well-practiced and repetitive tasks.  Does not require the participation of users or a working prototype, only a description of the task and software is needed.  Does not account for any learning required for the user to work through the task for the first time.  Can be useful to predict task times for different approaches to the same task, encompassing a variety of different user perspectives and possible uses.  The outcome of the analysis depends highly on the assumptions of the modeller.   Does not address the quality of the work produced by completing the task, the quality of the output of the task, or the effects of context of use attributes such as fatigue, group influence, the readability or layout of the user interface, or interruptions. Future Situation Assessment – KLM-GOMS (Keystroke-Level Model GOMS) Why – To predict how long it will take expert users to complete a task without errors. How – KLM-GOMS predicts the task times based on a simple set of physical and mental operators, including keystrokes, button clicks, pointer movement, keyboard to mouse movement and thinking time. Each KLM operator is assigned a time based on empirical research. To obtain the predicted time for a task, you add the times for an individual operator.  Resources: 1) A detailed list of different tasks to be carried out, willing participants, stopwatch, pens, paper, computer, estimated timing for each task 2) A large wall or display area to display the outcomes of the research in order to encourage discussion on the observation.
  • 51.
    51 Strengths Weaknesses  Assumingthere is a good facilitator/moderator then this method is a very ‘democratic’ way of generating ideas.  Requires an experienced and sensitive facilitator who understands the social psychology of small groups.  It is a useful way to get over ‘design blocks’ that are slowing development.  Requires a robust dedication to quantity and not quality.  The concept and completion of brainstorming is very easy to understand.  Can, at times, seem chaotic and intimidating.   May not be appropriate for some business or international cultures. Future Situation Assessment - Brainstorming Why – To inspire the free-flowing sharing of thoughts by an individual or group of people. How – A question or topic will be posed for the group to focus on during the brainstorming session. Rules for the session must be established before choosing participants with whom to include in the brainstorming session with. Each participant will be given post-its to record their ideas during the session and the group will review each idea at the end of a set time. The focus should be on the quantity of ideas produced and not the quality, at this stage of the process there should be no judgement or discarding of ideas.  Resources: 1) A neutral, relaxed setting is required to make the participants feel at ease and provide the best outcome. 2) A circular seating position of the participants will encourage engagement with the activity and hopefully ensure no one is neglected during the discussion phase of the exercise 3) Post-its, pens, paper, group of 6-12 people
  • 52.
    52 Strengths Weaknesses  Thisis a highly cost effective method.  Can be laborious to analyse for patterns within large sample groups.  Provides a very large amount and wide range of data within a very short period of time.  Requires a robust dedication to quantity and not quality.  Does not require trained facilitators or special materials, software or hardware.   Provides frequency, salience and consistency data.   Can be used to compare different groups or cultures.  Future Situation Assessment – Free Listing Why – To gather data about a specific domain or topic. How – Quite useful for understanding users, tasks terminology and other issues such as idea generation. Ask the participants, for example, to ‘list all the things which frustrate you about our product’. You can plot the frequency and position of the responses and use that as an input to your requirements and design activities. It is better when used in large group settings to generate a large quantity of responses.  Resources: 1) A neutral, relaxed setting is required to make the participants feel at ease and provide the best outcome. 2) A circular seating position of the participants will encourage engagement with the activity and hopefully ensure no one is neglected during the discussion phase of the exercise 3) Post-its, pens, paper, group of 6-12 people, use of excel spread sheet to compile comments and help look for patterns.
  • 53.
    53 Strengths Weaknesses  Metaphorbrainstorming is a variation on group brainstorming so participants grasp the general procedures very quickly.  This method is relatively unused and undocumented by industry and other related sources.  Participants can express ideas from areas of interest and other work areas.  There is some mental inertia when people first try to use this method. Because of this fact it can be helpful to show the results of metaphor brainstorming and then the metaphor deconstruction before trying this method for the first time.  Can be used to generate organising metaphors for a product, images for icons, requirements, and features.  Future Situation Assessment – Metaphor Brainstorming Why – To generate metaphors and extract aspects of those metaphors which can be applied to design. How – Start by choosing a topic for the metaphor brainstorming session. Provide a short briefing about the use of metaphor in design and assign ‘homework’ related to the topic area. Brainstorm a set of metaphors where the basic question is; ‘what metaphors might give us ideas about…..?’ Choose a set of metaphors from the brainstorming session and then conduct a deconstruction session where you begin to break the metaphors into objects, attributes, processes or tasks. From the list created, take the most promising concepts and see if they prompt ideas.  Resources: 1) A neutral, relaxed setting is required to make the participants feel at ease and provide the best outcome. 2) A circular seating position of the participants will encourage engagement with the activity and hopefully ensure no one is neglected during the discussion phase of the exercise 3) Post-its, pens, paper, group of 6-12 people
  • 54.
    54 Strengths Weaknesses  Manydesign ideas can be generated in a very short space of time.  Some individuals may be intimidated by being asked to draw.  In addition to the ideas which the method creates for visual designs, it can also elicit requirements that traditional brainstorming may have missed.  It is very possible that the group will not converge on a good solution to the design problem.  The method is very low cost and requires few resources.  There is no definitive technique for analysing the drawings.  Ideas are elaborated and refined by a large, diverse group of users. It is an inclusive method that allows many people to contribute to the design.  Managers may consider the activity to be frivolous.  Themes, good ideas and best practices can emerge from the results.  Future Situation Assessment – Brain drawing Why – To visualise brainstorming ideas and concepts in a more visual and easy to understand method. How – This method involves drawing quickly and sharing the results with other participants in the group. Like many other ideation methods, the focus is on the quantity of ideas generated rather than the quality. The process operates in rounds with participants beginning with a blank page and then using others’ sketches for inspiration in subsequent rounds. This creates a set of sketches which combines ideas of everyone within the group.  Resources: 1) A neutral, relaxed setting is required to make the participants feel at ease and provide the best outcome. 2) A circular seating position of the participants will encourage engagement with the activity and hopefully ensure no one is neglected during the discussion phase of the exercise 3) Post-its, pens, paper, group of 6-12 people, wall/display space to display drawings to allow for inspiration
  • 55.
    55 Strengths Weaknesses  Brainwriting is easier to conduct than group brainstorming as it does not require an experienced facilitator or many ground rules.  Brain writing is less well known than group brainstorming.  Often produces more outputs and ideas than group brainstorming.  It is generally less social than group brainstorming as participants are asked not to talk as they write down ideas.  It is a way to get input from new or shy colleagues who would not necessarily speak up in a group brainstorming session.  Participants may feel unable to fully express their ideas in writing.  Reduces the possibility of social conformity.   Can be appropriate if you are working in a culture where brainstorming participants may be embarrassed to express extreme ideas.  Future Situation Assessment – Brain writing Why – To generate a large amount of ideas by asking people to write down ideas and thoughts which they may have. How – Explain the procedure for brain writing and then hand each participant a sheet of paper and place extra sheets in the centre of the table. Describe the question or topic of interest and inform the group of how long they will have to write ideas on the sheet of paper. At the end of the first writing interval ask people to pass their sheet to the next person. Each person is then to read the preceding ideas silently and then add more ideas to the bottom of the list. The process is then repeated several more times.  Resources: 1) A neutral, relaxed setting is required to make the participants feel at ease and provide the best outcome. 2) A circular seating position of the participants will encourage engagement with the activity 3) Post-its, pens, paper, group of 6-12 people, wall/display space to display drawings to allow for inspiration
  • 56.
    56 Strengths Weaknesses  Simpleprocedure.  Analysing the dimensions that emerge across participants requires some background in qualitative analysis.  Useful for understanding ‘user-derived’ dimensions that should be considered when evaluating a product or a service.  The card sort can produce fairly consistent results between participants, but it may also vary widely.  This is an established technique that has been used for over 10 years by many designers.  The card sort is relatively quick but the analysis of the data can be difficult and time consuming, particularly if there is inconsistency between the participants.  Typically the cost is a stack of index cards, sticky notes, a pen or printing labels and some time.  The participants may not consider what the content is about, or how they would use it to complete a task, and focus only on ‘surface’ characteristics.  It is possible to perform several sorts within a short period of time, generating a large amount of data.  Future Situation Assessment – Card Sorting Why – To generate information about the associations and grouping of specific data items. How – You must first generate the items for the card sort, these can come from various sources, such as; user research, brainstorming, competitive evaluations, and task analysis. Write each statement on a separate card and number each card with a unique code. Provide the participants with the set of cards which have been thoroughly shuffled. Ask each participant to sort the cards into two piles, name each pile and explain how each pile is different. Shuffle the items again and ask the participant to sort the cards in a different way. Name the new groups and again explain how the piles are different. Repeat 5-6 times until the participants cannot generate new piles. Gather sort data from 10 – 20 participants and organise the dimensions that you obtained from all the participants to see if there are any common themes.  Resources: 1) Index cards, sticky notes, pen 2) A large display area where groups can be displayed easily for everyone to see and allow for discussion.
  • 57.
    57 Strengths Weaknesses  Functionallocation is useful for determining the degree of automation for a system.  The guidelines produced are often simplistic and provide only limited heuristics for allocating functions among people, hardware and software.   Can affect important human values, for example, automated systems that do not allow much human intervention often lower user satisfaction. Future Situation Assessment – Function Allocation Why – To decide whether a particular function will be accomplished by a person, technology or by some mix of person and technology. How – Context of use analysis should be used to identify the task structure and demands, the knowledge needed to perform the tasks, environmental constraints, functional and safety requirements, and any other relevant issue. Complete a mandatory allocation; allocate functions to humans where there are technical limitations, ethical constraints or safety considerations, and allocate functions to machines where the task demands exceed human capabilities or when the system must be operated in a hostile environment. Complete a provisional allocation; permanently allocate tasks based on task criticality, cost, training or knowledge requirements, or task unpredictability, and evaluate.  Resources: 1) Apogee allocation software, computer 2) Complex, time-consuming task, best carried out by one person http://www.stat-design.com/Software/Allocation.html?gclid=CIfmp9zU-rACFVMTfAodAXXqNw
  • 58.
    58 Strengths Weaknesses  Allowsa range of ideas to be generated quickly and cost effectively.  Requires a number of design team members to be available at the same time in order to produce the concepts.  The parallel nature of the method allows several approaches to be explored at the same time, thus condensing the concept development schedule.  Requires a major investment of time over a short period for the design work to be carried out.  The concepts generated can often be combined so the final idea benefits from all ideas proposed.  Time must be allocated in order to compare parallel design outputs properly so that the benefits of each approach are obtained.  Minimal resources and materials are required.   Can be utilised by those with little or no human factors expertise.  Future Situation Assessment – Parallel Design Why – To produce alternative designs in parallel and incorporate the best aspects of each design in the final solution. How – First clearly define the boundaries of the parallel design, goals, objectives etc. Design teams should have roughly equivalent skills and use whatever media they prefer to present their designs. Decide beforehand how much time will be allocated to design work and set a clear limit; also, agree on criteria against which the designs will be assessed. Allow sufficient time to carry out a fair comparison of the designs produced. Discuss each design separately and then discuss how various aspects of the design could be combined. The objective is to settle on a design concept based on the total effort.  Resources: 1) Paper, pens , pencils, 2) Requires large display spaces so each approach can be displayed together in order to hold a good comparison discussion 3) Requires 10 – 20 hours of development time per design group.
  • 59.
    59 Strengths Weaknesses  Givesusers a voice in the design process.  Requires a significant allocation of time to prepare, run and evaluate the outcome of the workshop.  Involves developers, business representatives and users working together to develop a solution.   Enables technical and non-technical participants to contribute equally.   Shifts the focus from purely technical requirements and issues towards the needs of the business and users.   Enables a team to rapidly design, evaluate and iterate their design approaches.  Future Situation Assessment – Participatory Design Why – To involve users in the design process and help ensure that the product designed meets their needs and is useable in the process. How – Hold a workshop for the duration of a day. Define a clear set of objective and aim for including no more than 10 people. Set goals, objectives and expectations. At the close of the workshop, summarise what you have achieved, document the design and determine the next steps to be taken.  Resources: 1) Paper, pens , pencils, large whiteboard (to brainstorm ideas), software tools (such as power point, Photoshop and Illustrator, stationary to prototype with 2) Requires large display spaces so each approach can be displayed together in order to hold a good discussion
  • 60.
    60 Strengths Weaknesses  Enhancesflexibility within the creative process.  Requires an experienced and sensitive facilitator who understands the social psychology of small groups.  Yields new points of view and therefore leads to innovation.  Requires a robust dedication to quantity and not quality.  Assuming there is a good facilitator/moderator then this method is a very ‘democratic’ way of generating ideas.  May not be appropriate for some business or international cultures.  It is a useful way to get over ‘design blocks’ that are slowing development.  Future Situation Assessment – SCAMPER (Osborn’s Checklist) Why – To generate ideas for new products or services by encouraging you to think of how you could improve existing ones. How – The mnemonic stands for; substitute, combine, adapt, modify, put to another use, eliminate and reverse. You use the tool by asking questions about existing products using the seven prompts listed above. These questions help you to come up with creative ideas for developing new products, or improving current products.  Resources: 1) A neutral, relaxed setting is required to make the participants feel at ease and provide the best outcome. 2) A circular seating position of the participants will encourage engagement with the activity and hopefully ensure no one is neglected during the discussion phase of the exercise 3) Post-its, pens, paper, group of 6-12 people
  • 61.
    61 Strengths Weaknesses  Helpsrespondents to project their own attitudes and feelings in an unconscious on the subject under study.  Highly trained interviewers and skilled interpreters are needed.  Allows for urges or responses to emerge which would not be revealed through direct questioning.  Interpreters’ bias can exist or develop throughout the process.  Allows for many interpretations of the same thing.  It can be a costly method.  Quick and easy in terms of completion.  The respondent selected may not be representative of the entire nation or targeted group of users.   Care needs to be taken so as not to generate too much noise that the value of the exercise becomes lost. Future Situation Assessment – Word Association Why – To explore ideas, define, and investigate general issues. How – This well established method can take place as a group or individual process. Start with a word which is related to the project in some way, it can be a need, a problem, issue etc. Then begin listing, or exchanging words within the group, that are associated with the previous/or beginning word. This will help to generate creativity.  Resources: 1) Index cards, sticky notes, pen, if conducting this on an individual basis websites/forums can be useful http://www.wordassociation.org/ 2) A large display area where words and associated words can be displayed to allow discussion with the design team on completion of the method 3) A neutral and relaxing atmosphere where participants are seated in a circular format in order to make them feel comfortable and encourage participation
  • 62.
    62 Strengths Weaknesses  Generatesa broad range of concepts for further development.  Expertise and time required are significant.  Builds empathy with the users.  The quick rejection of ideas should be avoided as this will result in the immediate application of real-world constraints.  Tackles a problem in a new way, if thinking becomes stagnated.  Constraints should be used to ‘shape’ the idea into a more suitable form; the idea should not fit the ‘mould’ laid out by requirements and constraints.  The staffing required and the cost of running this method is low.  Future Situation Assessment – Lateral Thinking Why – To generate a range of ideas and concepts at an early stage. How – Involve designers and users in a series of shared mental activities to provoke new ideas. A useful starting point for this method is to list the sequence of actions in a particular process, then play around with them by removing, reversing or distorting some of them to promote lateral thinking. Concepts that are generated may be sketched or written by the designer or the user.  Resources: 1) Index cards, sticky notes, pen 2) A large display area where ideas can be displayed to provoke thought and refinement 3) A neutral and relaxing atmosphere where designers can relax and induce creativity
  • 63.
    63 Strengths Weaknesses  Themethod is very easy to use.  Some participants may have problems describing their ideas concisely, so the idea may not be clear enough to other participants.  Does not require a trained/experienced moderator.  The time limit of 5 minutes may make participants feel pressured and restricted in their thinking.  By using participants with different fields of knowledge, the innovative potential of the group can be exploited.  May generate less creative solutions because the individual nature of the contributions does not take advantage of group discussions.  All participants are active, which may not occur in traditional brainstorming.   No premature discussion – useful for addressing conflicts in the group as they could have a negative effect.   A useful idea is systematically developed further.   The ‘author’ of a creative idea can be identified; this can be an important motivational factor.  Future Situation Assessment – 6-3-5 Brainstorming Why – To address the potential deficiencies of brainstorming by encouraging participation by all, with an emphasis on sketching ideas. How – Establish a good size team and clearly define the scope and purpose of the activity. Each team member should write, describe or sketch 3 ideas on a piece of paper. (Participants at this stage should be encouraged to sketch ideas). This stage should last for around 5 minutes and concepts should be passed to the next person around the table. It is recommended that this process is repeated 5 times to encourage combination, development and refinement of ideas.  Resources: 1) Pens, structured table to record ideas (one for each participant), stopwatch 2) A large display area where ideas can be displayed to provoke thought and refinement 3) A neutral and relaxing atmosphere where participants can relax and induce creativity
  • 64.
    64 Strengths Weaknesses  Youmay be tempted to use safe combinations, but challenging yourself can lead to innovative, counter-intuitive component combinations.  The combination of components can yield conflicts, with two separate component ideas which cannot physically be put together in the final solution.  The ‘random’ nature of combining components to create an overall solution allows no bias or personal preference to become involved with selection.  Can be difficult and time consuming defining the parameters on which to generate ideas, this will require the use of the PDS and possibly a function-means tree to aid this process, however this will require a large time specification.  Can repeat the process of generating a morphological chart several times in order to create a large number of different ideas in a very short space of time.  Future Situation Assessment – Morphological chart Why – To generate ideas in an analytical and systematic manner. How – Possible components are listed on the basis of their functions. The components are concrete and specific, specifying the parameter of that category. Parameters are identified by focusing on commonalities of the components. The morphological chart splits the product’s purpose into a set of sub-functions. For each sub-function, ideas are generated and combined into an overall solution. The carefully chosen combination of components forms a conceptual solution.  Resources: 1) Pens, pencils, structured table to record ideas, PDS, function-means tree 2) A large display area where ideas can be displayed to provoke thought and refinement of ideas after generation of morphological chart and enable identification of areas on which to generate subsequent morphological charts 3) Should be conducted around a circular table to encourage discussion between the design team
  • 65.
    65 Strengths Weaknesses  Generatesvery random ideas which would normally not come to the fore during any other more traditional creative method.  Results in producing a lot of ideas which may not be feasible, relevant or technically or physically achievable.  Can be applied quickly.  Becomes difficult to narrow ideas and evaluate which ideas are best for further development and which will not succeed and in the long run become irrelevant.  Encourages the design team to think ‘outside of the box’.   The method has an infinite nature. The process can be repeated as many times as is deemed necessary with as many different everyday items as is required.  Future Situation Assessment – Force Fitting Why – To generate options and ideas, using characteristics of other unrelated items, to help develop a new product. How – Find everyday items which can be gathered and brought to a design team meeting to be used as visual and physical aids during the process. Use every item systematically and methodically and try and generate ideas for the new product by taking characteristics and features from the existing product and trying to fit them together. Ideas should be ideally be sketched.  Resources: 1) A collection of everyday items (advisable to have them entirely unrelated to the project), paper, pens 2) A large display area where ideas can be displayed to provoke thought and refinement of ideas and highlight areas which can be taken further within the design. 3) Should be conducted around a circular table to encourage discussion between the design team and enable the team to touch and become familiar with the objects being used.
  • 66.
    66 Strengths Weaknesses  Themethod is useful for generating empathy for users.  Involves role playing and improvisation which may be difficult for some members of a product team.  Provides clues about the impact of the environment on the user.   Gets the design team more active and involved, activities requiring a lot of participation lead to more innovation and emergence of creative ideas.  Future Situation Assessment – Body storming Why – An immersive ideation method for exploring ideas through role-playing and physical interaction with props, prototypes, actual products and physical spaces. How – Gather a small group and define the locations where the product or service will be used. Visit these locations and observe how people interact with each other and with other artefacts in the environment. Develop prototypes and props that you will need to explore an idea. Identify the personas and roles that are important for understanding your product, service or environment. Role play different scenarios, feel free to improvise and role play new situations and scenarios that emerge from your initial round of body storming. Reflect on the body storming experience, what did you learn? what new questions emerged? You are likely to find new possibilities as well as gnarly problems.  Resources: 1) Prototypes, listed scenarios, pens, paper (to record and sketch ideas) 2) A large display area where ideas can be displayed to provoke thought and refinement of ideas and highlight areas which can be taken further within the design. 3) A team of 6 or more will provide the best outcome, especially with a mix of knowledge areas. The activity should be conducted in a large, open space to enable movement and to provide adequate space for role plays.
  • 67.
    67 Strengths Weaknesses  Reversebrainstorming can be easier to conduct and generate more ideas than traditional positive brainstorming.  Requires the input of a good facilitator to keep the ideas flowing.  Criticism is sometimes easier than positive idea generation.  Requires time allocation to convert negative ideas into positive ideas.  Does not require a lot of training.   Can be fun and helps to motivate teams that are tired, cynical, or hostile.   Can be used within face-to-face brainstorming.  Future Situation Assessment – Reversal Why – To bring a new perspective to idea generation which can be especially helpful when a team is cynical about a project or lacking energy. How – Generate a question for brainstorming and then convert it to a negative question. Write the questions on a board or post it on an online brainstorming tool. Begin the reverse brainstorming. After you generate the negative ideas, schedule a conversation meeting where you convert the negative ideas into positive ideas. Each negative idea may yield more than one positive solution. Prioritise ideas and decide which ideas will be taken forward for further development. Archive the negative and positive ideas for future use.  Resources: 1) A neutral, relaxed setting is required to make the participants feel at ease and provide the best outcome. 2) A circular seating position of the participants will encourage engagement with the activity and hopefully ensure no one is neglected during the discussion phase of the exercise 3) Post-its, pens, paper, group of 6-12 people
  • 68.
    68 Strengths Weaknesses  Encouragesthe design team to work collectively instead of on an individual basis.  The number of ideas generated is relatively small compared to that of brainstorming.  Expresses the problem in terms of something more familiar, but perhaps rather distant.  A synectics session is much longer than brainstorming, and much more demanding.  Leads to conceptualisation of the ‘problem as understood’ – key factors or elements of the problem that need to be resolved, or perhaps a complete reformulation of the problem.   Unusual creative analogies are sought, which may lead to novel solutions.   Analogies are used to open up lines of development which are pursued as hard and as imaginatively as possible by the group.  Future Situation Assessment – Synectics Why – To build, combine and develop ideas towards a creative solution. How – The group works collectively towards a particular solution using different types of analogy. There are four different types of analogy; direct analogies, personal analogies, symbolic analogies and fantasy analogies. Direct analogies are usually found by seeking a biological solution to a similar problem, e.g. ‘Velcro’ was designed on an analogy of plant burrs. Personal analogies occur when team members imagine what it would be like to use oneself as the system or component that is being designed. Symbolic analogies use poetic metaphors and similes to relate an aspect of one thing to another. Fantasy analogies are the impossible wishes of things to be achieved in some ‘magical’ way.  Resources: 1) A circular seating position of the design team will encourage engagement with the activity and hopefully ensure no one is neglected during the discussion phase of the exercise 2) Post-its, pens, paper, group of 6-12 people, whiteboard, display area for outcomes
  • 69.
    69 Strengths Weaknesses  Workingunder time pressure and without much structure can produce interesting and useful outcomes.  There aren’t many cases noted in literature about user interface races, so some practice may be needed before deciding to run an event. Consider doing a trial run with friendly colleagues.  User interface races can be fun and used to promote usability.  Some people may not like the competitive aspect of the race method and some colleagues may not accept the idea of a race. Future Situation Assessment – The User Interface Race Why – A challenge to solve a problem under time pressure and scrutiny. How – Planning is essential, and criteria for judgement, time and design challenge must be decided carefully in preparation for the race. Give the race participants the task and ask them to read and ask any questions they feel are necessary. When the participants are ready, give them the signal to begin. When the time is up, or the participants have finished give the signal for the race to stop. The aim of the race for a design based task is to generate several detailed concepts which can be analysed and further developed, or combined to produce an overall solution.  Resources: 1) A large room where things can be stuck to walls, with a space for people to work on an individual basis 2) Sticky notes, whiteboard, pens, paper, prototyping equipment (paper, card etc.), glue, pencils, note cards (one for each participant to explain the task), tape, cardboard, computers with CAD software (if necessary)
  • 70.
    70 Strengths Weaknesses  Providesthe ability to take in a broad picture of an area/problem.  Not necessarily neat or clear for people, not involved in its creation, to read.  Can be used to organise reference information.  This is a very personal tool because its takes force and sense from a design culture which needs to be decoded in order to share ideas with co-workers or customers.  Avoids the strict hierarchy which you are forced to adopt with traditional mind mapping.   The method shows you a broad landscape of your reference material, which allows you to fly through the landscape and go straight to the item sought.  Future Situation Assessment – 3D Concept Mapping/Multi-Dimensional Mapping Why – To identify problems, key areas for improvement, solutions and resources. How – This can be completed using software or by using a physical 3D model. The base layer for both should be the problems identified with the product/service. The second layer should consist of reasons as to why these problems occur. The third, and final layer, must state possible solutions to these problems.  Resources: 1) Easy access to documentation for all those involved throughout the design and manufacture of the product/service is essential for this method to work. 2) When developing sketches/diagrams/models, a cross-functional team is needed. 3) For help with understanding and creation of diagrams, online resources are available; • www.topicscape.com/3d-mindmapping.html • www.instantshift.com/2011/04/26/mind-mapping-scheme-to-improve-the-creative-process/ 4) Pre-planning with the use of process identification, information gathering, interviewing and mapping, and analysis will give the most effective results
  • 71.
    71 Strengths Weaknesses  Allowsfor good knowledge exchange to occur.  There is the potential for a large disruption of flow to work.  A successful and productive method when conducted in an effective manner.  Can lead to the exclusion of quieter members of a group.  Has the ability to lift the group contribution.   Induces the power of thinking in terms of interaction and experience rather than on outcomes.  Future Situation Assessment – Physical Problem Solving Why – To see and physically understand a particular problem identified in a product/service. How – Organise a group to investigate a particular problem with a product/service. Take the problem and physically investigate the operation components responsible for causing the problem. Physically touch and move the parts involved to try and understand the reasons for the failure to occur.  Resources: 1) Easy access to the physical product, and documentation or an illustration of how a service works, is essential for this method to work. 2) When developing sketches/diagrams/models, a cross-functional team is needed. 3) An empty room with no seats will allow participants to be active in order to interact with the method. Results should be recorded on A3 paper and displayed on a large wall in order to allow for discussion afterwards. 4) Pre-planning with the use of process identification, information gathering, interviewing and mapping, and analysis will give the most effective results.
  • 72.
    72 Strengths Weaknesses  Encouragesgood knowledge exchange.  Experience of producing this type of map is needed to provide the best outcome.  Has the potential to provide the key to a raft of innovative means of information representation through the use of interactive spatial visualizations.   Encourages the sharing of ‘best practice’ from across the globe.   Provides a good visual reference – maps ideas according to their geographical effect.  Future Situation Assessment – Geographic Ideation/Visualizations Why – To identify solutions which are suited to particular global locations. How – Using a map of the world and post-it notes, identify problems and possible solutions for specific areas and regions. The idea is that some ‘best practices’ will emerge and be shared across global operations.  Resources: 1) When developing sketches/diagrams/models, a cross-functional team is needed. 2) An empty room with no seats will allow participants to be active in order to interact with the method. Results should be recorded on A3 paper and displayed on a large wall in order to allow for discussion afterwards. 3) Pre-planning with the use of process identification, information gathering, interviewing and mapping, and analysis will give the most effective results. 4) Guidance for producing this type of map is available online; http://media.wiley.com/product_data/excerpt/12/04705151/0470515112.pdf
  • 73.
  • 74.
    74 Strengths Weaknesses  Themethod is extremely simple but very powerful in its ability to change thinking patterns.  Requires each individual to look at all sides of an issue, this can be difficult to become accustomed to.  Helps actualise the full thinking potential of teams.  May cause some participants to become defensive or they may fail to look at decisions calmly or rationally.  Provides the disciplined process for individuals to be focused and to the point.   Neutralises employee rank and puts those who are quiet and tentative on a level playing field with those who are talkative and may tend to monopolise a meeting.   Mixes ambition, skill in execution, public sensitivity, creativity and good contingency planning.  Evaluation – De Bono’s Six Thinking Hats Why – An effective parallel thinking process that helps people be more productive, focused and mindfully involved. How – Team members can separate thinking into six clear functions and roles. Each thinking role is identified with a coloured symbolic ‘thinking hat’. By mentally wearing and switching hats, you can easily focus or redirect thoughts, the conversation or meeting. The white hat calls for information known or needed – the facts. The yellow hat symbolises brightness and optimise – explore the positives and probe for value and benefit. The black hat is judgement – why something may not work. The red hat signifies feelings, hunches and intuitions – express emotions and feelings. The green hat focuses on creativity – possibilities, alternatives and new ideas. The blue hat is used to manage the thinking process – control.  Resources: 1) Pens, pencils, a defined display area for each ‘hat’ to display outcomes or possibilities for each 2) Should be conducted around a circular table to encourage discussion between the design team
  • 75.
    75 Strengths Weaknesses  Givesspecific, relevant and direct feedback on issues or design ideas.  Moderately time consuming and difficult to conduct, requires high quality facilitation.  Encourages on-the-spot sharing and synthesis of different views which may allow for the development of elicit key topics which were not expected.  Very expensive.  Builds involvement for the employee during the process and support for the development of the product. Also, use of innovative technology can help spark creative ideas.  May be difficult to analyse and quantify data and information gathered.  Best results are produced during use in the latter stages of the design process as a form of validation and evaluation, but can also be useful during the early stages to identify key issues.  Some participants may feel over-shadowed if group dynamics are wrong for the situation. This will lead to people taking a back-seat and not contributing to the process. Evaluation – Interactive Case Studies Why – To facilitate discussion and capture results. How – Use specifically designed software and interactive technology to facilitate discussions and capture results. Begin by holding a reflection session on the current design; discuss issues, problems and what the ideal state of the design would be in a dream world. During the second half of the session use what has previously been discussed to explore design ideas, incorporating some research into new technological capabilities in order to achieve the ‘dream’ design.  Resources: 1) A neutral, relaxed setting is required to make the design team feel at ease and provide the best outcome. 2) A circular seating position of the participants will encourage engagement with the activity and hopefully ensure no one is neglected. 3) Interactive and innovative technology, such as iPads and touch screen monitors.
  • 76.
    76 Strengths Weaknesses  Thismethod is relatively inexpensive.  Some perspectives may be difficult to assume.  Can be conducted by evaluators at different sites.  Evaluators have to be open to adopting different perspectives – some colleagues may have difficulty with role-playing.  Broadens the types of problem that emerge.   Can be accomplished by using a variety of online tools.  Evaluation – Perspective-based Inspection Why – A user interface evaluation method where evaluators adopt a specific perspective after examination of the product. How – Define the perspectives that are important for the products or services you are developing. Provide some background about the perspectives and consider ways to understand the perspectives better. Define the tasks, goals and specific characteristics that are important for each perspective. Provide an inspection team, this can be a team with several members or one evaluator who takes on several roles (consisting of a consistency czar (to assess consistency issues), a disabled user, a psychologist, a super power user (to assess efficiency issues), an error expert, an artist (to look at aesthetics), and a keyboarder (to look at technical capabilities). Provide the inspection team with forms to record the issues and products they find. Review the perspectives, procedures and reporting forms. Pull all the issues together, clarify data and prioritise findings.  Resources: 1) A well rounded team of experts, or an evaluator who can take on the role of several experts, is needed to fulfil this task. 2) Inspection form, pens, high-quality prototype, use an online tool to achieve the best results http://www.loop11.com/landing-1/?gclid=CJHH9bTB_bACFQwjfAodMxxFPQ
  • 77.
    77 Strengths Weaknesses  Simplifiedbackcasting can be done cheaply, in a one or two day workshop using sticky notes, pens, paper and string.  Requires a strong facilitator and solid preparation.  It is a way of reaching a common understanding of successful futures and the steps required to achieve them.  Valuable backcasting results can be lost easily, unless there is an on-going campaign to keep the results in the eyes of the stakeholders.  Provides actionable information.  Evaluation – Backcasting/Future Landscape Why – To define what is needed to get to the ideal state from the current system. How – Assemble a group of stakeholders and define how far into the future you will start from, this is most typically five years. Establish a set of questions about the time frame, current state, future ideal states, actions, indicators, risks and opportunities that the facilitator will use during the backcasting exercise. Conduct ideation workshops to clarify the current state and the future ideal state or scenarios. Consider each future state and work backwards to identify actions, assumptions, risks, benefits, and other indicators which may lead to these future states. Publish the results using charts, maps, stories, list of actions required, risk/benefit trade-offs, and photographs of the actual items produced during the actual backcasting session.  Resources: 1) A large room where things can be stuck to walls, or a large, long table 2) Sticky notes, whiteboard, pens, paper, string, computer, stationary required for mapping and charting, camera 3) Software needed for producing maps and charts, such as excel, will be needed
  • 78.
    78 Strengths Weaknesses  Theuser/task matrix is simple and conveys critical information for design teams who are considering what aspect of usability they should focus on during conceptual design.  If the matrix has hundreds of tasks listed within it, it may become unwieldy. At this stage it may be necessary to create a hierarchical version.  You can easily substitute the language of any organisation into the matrix. For example you might substitute ‘stories’ into task column and ‘personas’ into the user group row.  Evaluation – The User/Task Matrix Why – To understand the frequency and importance of task that are performed by different classes of user in order to make critical design decisions. How – In order to construct the matrix it is important to ask questions about task frequency and importance when conducting user research. Develop a set of user groups or personas that represent the major classes of users. Develop a visual coding scheme for highlighting frequency and importance in the matrix, it may become visually compelling. Use the matrix as an input to feature and UI design trade-offs and other design activities.  Resources: 1) A large circular table and seating arrangement to make it easy for the design team to communicate and discuss the matrix. 2) Whiteboard, pens, large A3/A2 paper, computer (to compile an electronic version when finished) 3) A suitable area where the finished matrix can be displayed to make discussion and analysis easier
  • 79.
    79 Strengths Weaknesses  Ladderingis a technique that gets at core values and the underlying reasons for particular behaviours or choices.  Laddering can be tiring for participants who are constantly asked why or other laddering questions.  Laddering is a way to elicit semi-tactic information that might not be revealed by other methods.  Conducting interviews with many laddering questions requires a facilitator who can keep the participant engaged. People who use laddering questions need to be comfortable with the repetitive questioning style and be prepared to vary their prompts as needed.   On some occasions laddering can get into sensitive issues.   Laddering questions assume that there is hierarchical information. In some domains, the information may not be represented hierarchically. Evaluation – Laddering Questions Why – To provide insight into attitudes, beliefs, and values which affect requirements, brand image, consumer preferences and buying decisions. How – Firstly, develop a set of laddering probes that can be used in the study, for example, ‘why do you think this product is great?’ ‘Why is this important to you?’ ‘Can you tell me about similar/different types of….?’ During an interview, you can then elicit features, attributes, concepts, or constructs of interest. Ask the person to prioritise this list and then start to conduct a laddering interview, starting with items at the top of the list. Ask laddering questions until you get answers that have reached the ‘end of the ladder’ or that are actionable. Repeat the laddering interview with the next item on the list.  Resources: 1) A neutral, relaxed setting is required to make the interviewee feel at ease and provide the best outcome.
  • 80.
    80 Strengths Weaknesses  Complimentsscenario creation exercises.  The role-play can become chaotic very quickly and will need to design team to be able to regain the focus of the group and set them on the right direction again.  Adds some fun and minimal constraints to role-playing studies.   Provides a lively triggering function for creative ideas.   The use of a prop can provoke some novel ideas that would not emerge gathered around a table while conducting a traditional group brainstorming session.  Evaluation – The Magic Thing Why – To serve as an ideation tool in the design of mobile, ambient, and ubiquitous systems. How – The design team introduces participants to a scenario they are to act out. The participants review the scenario with a member of the design team and personalise it to their own situation. The participants act out the scenario without the magic thing. The participants are given, or choose, a prop (their magic things), and are told what magical powers it has, for example, the magic thing knows where it is and has information about commercial establishments and ratings of service for many companies. The participants and design team then engage in participatory role-play where the magic thing can gain new powers and loose old ones, for example, you may start with a magic thing that is location aware and then acquire a magic power like augmented reality where you visualise information as an overlay over camera images. The sessions are recorded and the ideas that emerge are captured and applied to a new round of role-playing that expands on promising ideas.  Resources: 1) A large open space to allow the role-play to evolve without any restrictions. 2) Props, video camera, pens, paper, whiteboard, variety of participants from different classes of user group
  • 81.
    81 Strengths Weaknesses  Hasthe ability to be used in both a narrow and a more general sense.  If not considered alongside customer viewpoints then all judgements may become based on the personal preference of the designer.  Effective when completed among multiple agents, viewpoints, data sources etc.  To be completed well, significant time and discussions need to be taken on decisions.  Adaptable, can be applied to many different kinds of data in many different design areas.   Best used in conjunction with a collection of customers’ preference or taste information.  Evaluation – Collective Filtering Why – To collectively identify the best possible solutions to implement. How – Each proposed solution needs to be fully considered in turn. The group should concentrate on each of them individually and discuss the positive and negative aspects of each. The object of this method is to be open and non- judgemental before having a vote on which solution is the best.  Resources: 1) When discussing and voting, a cross-functional team is needed. 2) A circular seating position will help with group engagement. 3) Pre-planning with the use of process identification, information gathering, interviewing and mapping, and analysis will give the most effective results. 4) Guidance for this type of discussion is provided online, it should be conducted with the Delphi Method in mind, this is a structured communication technique to help with ensuring the that the method is conducted in an effective manner.
  • 82.
    82 Strengths Weaknesses  Easy,quick and inexpensive.  Can provide incomplete or inaccurate results.  Useful throughout various stages of the design process.  Can cause a challenge in determining which functional limitations to include in the process.  Can identify potential design problems early, to help avoid significant redesign costs and delays later in the process.  It cannot provide accurate information on how suitable the customer will find the product, it is best to combine screening techniques with using potential customer feedback, including customers/users with any disability. Evaluation – Screening and Scoring Why – To understand how concept designs fit with the PDS. How – This method involves interacting with, or fully understanding, concept designs and trying to visualise how this fits alongside the PDS. This involves using a scoring system to identify how well specific elements perform in relation to targets set by the PDS. This information is set out in a matrix.  Resources: 1) When discussing, during the creation of the matrix, a cross-functional team is needed. 2) A circular seating position will help with group engagement. 3) Pre-planning with the use of process identification, information gathering, interviewing and mapping, and analysis will give the most effective results. 4) Guidance for this type matrix is available online; www.viaccess.com/accessucd/screening.html
  • 83.
    83 Strengths Weaknesses  Hasthe ability to be used in both a narrow and a more general sense.  If not considered alongside customer viewpoints then all judgements may become based on the personal preference of the designer.  Effective when completed among multiple agents, viewpoints, data sources etc.  To be completed well, significant time and discussions need to be taken on decisions.  Adaptable, can be applied to many different kinds of data in many different design areas.   Best used in conjunction with a collection of customers’ preference or taste information.  Evaluation – Dot Sticking/Personal/Anonymous Voting Why – To collectively identify the best possible solutions to implement. How – Each proposed solution needs to be fully considered in turn. The individuals should concentrate on each of them individually and vote for the solution/solutions they think best fit the purpose of the design. The object of this method is to be open and non-judgemental before having a vote on which solution is the best. It can be done by a simple show of hands vote, by dot sticking or anonymous ballot voting.  Resources: 1) When discussing and voting, a cross-functional team is needed. 2) A circular seating position will help with group engagement; this will be needed to discuss the outcome of votes. 3) Pre-planning with the use of process identification, information gathering, interviewing and mapping, and analysis will give the most effective results. 4) Guidance for this type of discussion is provided online, it should be conducted with the Delphi Method in mind, this is a structured communication technique to help with ensuring the that the method is conducted in an effective manner.
  • 84.
    84 Strengths Weaknesses  Thisis a non-numeric, iterative tool.  Without reflection after completion of the matrix, inaccurate results can be achieved. The team need to identify if the outcome truly makes sense, and if the whole team agree on the outcome.  Allows for joint goals of both improving and narrowing the choice of concepts available.  The matrix is only as effective as the team input, the choice of selection criteria and the quality of the basic concepts.  It encourages team involvement in concept selection.  Evaluation – Controlled Convergence Matrix Why – To understand how concept designs fit with the PDS. How – This method involves interacting with, or fully understanding, concept designs and trying to visualise how this fits alongside the PDS. This involves using a DATUM; this can be the current product which is in operation. The design concepts are then assessed against the targets identified within the PDS and whether the concept design reaches this target in a better, similar or worse manner than the original DATUM product.  Resources: 1) When discussing, during the creation of the matrix, a cross-functional team is needed. 2) A circular seating position will help with group engagement. 3) Pre-planning with the use of process identification, information gathering, interviewing and mapping, and analysis will give the most effective results. 4) Tools and guidance to help with the creation of this type matrix is available online; www.ifm.eng.cam.ac.uk/dmg/tools/concept/convergence.html
  • 85.
    85 Strengths Weaknesses  Agreat decision making tool for evaluating and prioritizing among the PDS and selection criteria.  Results achieved can be based on designer preferences and personal opinion; choices can be made to modify the options and/or the ranking to make them more acceptable.  You can quickly sort through options by identifying their relative strengths and weaknesses.  Selecting appropriate criteria and weightings can take time and prove to be very difficult.  When completed to a high level, it can be a powerfully effective tool in creative problem solving.  Evaluation – Weighting and Rating Matrix Why – To understand how concept designs fit with the PDS. How – This method involves interacting with, or fully understanding, concept designs and trying to visualise how this fits alongside the PDS. This involves using a scoring system to identify how well specific elements perform in relation to targets set by the PDS. The elements identified from the PDS are ranked from values of 1 – 5 according to their perceived importance in the design and use of the product. The concept designs are then also scored from 1 – 5 depending on how well they fulfil the PDS targets. This information is set out in a matrix.  Resources: 1) When discussing, during the creation of the matrix, a cross-functional team is needed. 2) A circular seating position will help with group engagement. 3) Pre-planning with the use of process identification, information gathering, interviewing and mapping, and analysis will give the most effective results. 4) Tools and guidance to help with the creation of this type matrix is available online; www.positive- way.com/business/evauali.htm
  • 86.
  • 87.
    87 Strengths Weaknesses  Goodfor getting feedback early in the design process, can help to confirm if the project is going in the right direction.  Participants may be less likely to realistically engage with something that is on paper; however, they may be more likely to provide feedback as it is clear the design is in the early stages.  You can determine the appropriateness of concept design before too much work has been done and before the project team becomes tied to a particular design.  May be difficult to simulate complex interactions on paper.  Prevent costly mistakes once development has begun.  Development – Paper Prototyping Why – To enable design feedback early in the design process. How – Create the interface using paper or printed from low-fidelity wireframes. Plan the study like any other usability study. You may need someone to pretend they are the computer to simulate some interactions.  Resources: 1) Paper, pens, pencils, post-its, anything which will help simulate interactions between the user and the product 2) Requires one-to-one interaction between designer and user, or a circular seating set-up for a group to encourage engagement and discussion
  • 88.
    88 Strengths Weaknesses  Allowsthe design team to identify major navigation and usability problems before your company spends a lot of time and money developing and coding user interfaces.  Rushing in to develop a prototype may exclude other design ideas.  If the prototype is sufficiently well developed it can be used to support metric-based evaluations.  Design features may be limited by the scope of the prototyping tool.  The prototype can help to communicate the details of the user interface to the whole design team as well as to users. It can also be used as an awareness training tool with users.   Permits swift development of software prototypes.  Development – Rapid Prototyping Why – To create a low-cost representation of the user interface of a system as a method of brainstorming, creating, testing, and communicating ideas about the design being developed. How – Begin by holding a brainstorm session to discuss general ideas for functions. Develop paper prototypes to refine ideas. Once these have been sufficiently developed, develop a software prototype using a rapid prototyping tool. Test the prototype with users and feed back into the design specification.  Resources: 1) Paper prototypes: paper, pencil, adhesive notes, card, scissors etc. 2) Requires a room to enable testing of prototypes 3) Prototyping software: power point, Visio, WYSIWYG, ProEngineer, Solidworks 4) A group of willing participants and a facilitator
  • 89.
    89 Strengths Weaknesses  Encouragesrational and structured idea generation.  May require training in the use of TRIZ in order to create more innovative solutions to design problems.  Provides the ability to generate a set of data that changes the way the design team thinks.  A lack of understanding of the method will not lead to creative solutions, other ways of inducing ideas should be used alongside this method in order to produce the most relevant and successful ideas.  Helps generate more solutions of higher quality, in less time compare to other methods such as brainstorming or 6-3-5.   Reveals how product design and technologies will evolve in time.   Gives awareness of access to knowledge bases.   Improves quality, reliability and safety.  Development – Triz Why – Systematic innovation to find new concepts and the routes for developing new products. How – TRIZ research begins with the hypothesis that are universal principles of creativity. You take the specific problem which you face and generalise it to one of TRIZ general problems. From the TRIZ general problems, you identify the TRIZ solutions to those general problems, and then see how these can be applied to the specific problem you face.  Resources: 1) Pens, pencils, structured table to record ideas, access to the contradiction matrix tool to help identify development areas http://www.triz-journal.com/ 2) Should be conducted around a circular table to encourage discussion between the design team
  • 90.
    90 Strengths Weaknesses  Producesa very inclusive product.  It requires a long time to process and analyse the life cycle and environmental impacts before any progress is made.  Necessary stage in all design projects; takes the emphasis away from user needs and concentrates on an equally important area.   The method remains open to innovation, while also concentrating on key issues and following a set of guidelines.   The method is driven by goals which are ultimately set by the designer. This means the end result will resolve any issues with consideration of the environment throughout.  Development – Life Cycle Analysis Why – To identify the total environmental impact of a product. How – The first stage of a life cycle analysis is called an ‘inventory’ analysis. The goal of this stage of the analysis is to examine all the inputs and outputs in a product’s life cycle, beginning with what the product is composed of, where those materials come from, where they go, and the inputs and outputs related to those component materials during their lifetime. The next stage is the impact analysis. This is where the environmental impacts identified in the previous stage are enumerated. Once the general environmental impact has been calculated, the next step is to conduct an improvement analysis, where consideration is given to how the environmental impact from the product can be reduced.
  • 91.
    91 Improvement Analysis –To assess the impact of the product on the environment and how these can be improved. For example, conservation of energy or water in the manufacturing process will reduce the environmental impacts of that process. Substituting a less hazardous chemical in place of a more toxic one would also reduce the impact. The change is then made in the inventory analysis to recalculate its total environmental impact. Useful Resources - www.life-cycle.org/ - UNEP Database Registry - http://cml.leiden.edu/software/data-e3iot.html - www.earthster.org/index.php (launching later this year) - www.ecoinvent.com/ - http://lca.jrc.ec.europa.eu/lcainfohub/datasetArea.vm - www.gabi-software.com/uk-ireland/index/ (free demo download) - http://sourcemap.com/ - www.nrel.gov/lci/ LCIA Methodologies - www.nist.gov/el/economics/BEESSoftware.cfm/ - http://cml.leiden.edu/research/industrialecology/researchprojects/finished/new- deutch-lca-guide.html - www.bafu.admin.ch/produkte/index.html?lang=en - www.pre-sustainability.com/content/eco-indicator-99 - www.sph.umich.edu/riskcentre/jolliet/downloads.htm - www.jemai.or.jp/english/lca/index.cfm - www.lcia-recipe.net/ Single Issue Methodologies - www.pes.uni-bayreuth.de/en/research/projects/LULCIA/ - www.usetox.org/ LCA Study Search Tool - www.preconsultants.com/dtsearch.html Development – Life Cycle Analysis Contd. Methodology – Define Scope Inventory Analysis Impact Measurement Improvement Analysis Manufacture Impact Analysis Define Scope – Define what you want to achieve from the study. Inventory Analysis – Examine all the inputs and outputs in a product’s life cycle, beginning with what the product is composed of, where those materials come from, where they go and the inputs and outputs related to those component materials during their lifetime. It is also necessary to include the inputs and outputs during the product’s use, such as whether or not the product uses electricity. The purpose of the inventory analysis is to quantify what comes in and what goes out, including the energy and material associated with materials extraction, product manufacture and assembly, distribution, use and disposal, and the environmental emission that result. Impact Analysis – The environmental impacts identified in the previous stage are enumerated, such as the environmental impacts of generating energy for the processes and the hazardous waste emitted in the manufacturing process. Once the environmental impacts of all the inputs and outputs of a product’s lifecycle are analysed, the life cycle analysis generates a number that represents how much the environment is affected. Impact measurement – The major purpose of the analysis is to evaluate, once the inputs and outputs are quantified, how the product affects the environment throughout its lifecycle.
  • 92.
    92 Development – LifeCycle Analysis Contd. Software - www.nist.gov/el/economics/BEESSoftware.cfm/ - The Boustead Model 5.0 - www.cmlca.eu/ - www.pre-sustainability.com/content/eco-it-ecodesign-software - www.eiolca.net/ - www.athenasmi.ca/our-software-data/overview/ - www.gabi-software.com/uk-ireland/index/ - http://greet.es.anl.gov/ - GEMIS (Global Emission Model For Integrated Systems) - www.llamasoft.com/products-overview/ - www.lcait.com/ - www.kmlmtd.com/index.html - www.openlca.org/index.html - www.ptc.com/WCMS/files/125263/en/6278_Windchill_LCA_DS_EN.pdf - www.quantis-intl.com/software.php - www.pre-sustainability.com/content/simapro-lca-software - www.solidworks.com/sustainability/sustainability-software.htm - www.ecoinvent.org/ecoinvent-v3/ecospold-v2/ - http://ecobilan.pwc.fr/uk_team.php - www.umberto.de/en/ - http://ecobilan.pwc.fr/uk_wisard.php
  • 93.
    93 Strengths Weaknesses  Simpleprototypes to visualize how something might work or look.  Costly in time.  Done at a very early stage for visualization, feel, and to allow for adjustments to save time and cost in later stages of the process.  Can be quite complex and require several iterations of design, redesign and testing.  Very beneficial when combined with Production Quotation, where manufacturer input is requested, both for cost to produce as well as for ways the product can be made cheaper, easier, lighter, faster, stronger and better.   Can highlight need for minor changes before going into production.  Development – Spatial Prototyping Why – To allow collaborative, physical prototyping of solutions. How – A collaborative group work together in a specified prototyping space to create physical models of possible solutions to help understand the solution and visualise the layout and space required for individual components etc.  Resources: 1) When discussing, during the creation of the matrix, a cross-functional team is needed. 2) A room specifically set-up for prototyping with all relevant materials for building will be required to produce the best prototypes, and allow for good team cooperation. 3) Pre-planning with the use of process identification, information gathering, interviewing and mapping, and analysis will give the most effective results.
  • 94.
    94 Strengths Weaknesses  Productsproduced using this method should have higher quality and reliability.  Takes a considerable amount of time to get right.  Products designed using DFMA will be easily and efficiently manufactured and assembled with a minimum effort, time, and cost.  The only effective and efficient way of carrying out a DFMA analysis is through the use of a trusted software package.  Ensures the transition from the design phase to the production phase is as smooth and rapid as possible.  Development – DFMA Why – To balance cost, quality and performance. How – The group take a primary focus on meeting customer requirements. The idea is to balance among cost, quality and performance. A concurrent engineering team approach, that involves engineering, manufacturing and supplies early in the design cycle, will produce the best team results. The team will work towards minimizing the number of components, manufacturing steps and operations. This involves using optimal thinking and the design simplification rules.  Resources: 1) When discussing, during the creation of the matrix, a cross-functional team is needed. 2) A circular seating position will help with group engagement. 3) Pre-planning with the use of process identification, information gathering, interviewing and mapping, and analysis will give the most effective results. 4) Tools and guidance to help with the creation of this type matrix is available online; http://smaplab.ri.uah.edu/ipd/2_1.pdf Software - www.dfma.net - www.reliasoft.com/xfmea/features1.htm - www.dfma.com/software/index.html - www.discussoftware.com/solutions/prod uctibility_analysis.html?gclid=CNConOrBy LECFY2bfAodFQ4A2Q - http://torrentz.eu/df/dfma+software-q - www.dl4all.com/oot/tag/Boothroyd+DFM A+Software.html - www.ecodesign.at/methodik/software/in dex.en.html - www.soflist.net/search/dfma-software/ - www.rocketdownload.com/query.php?q =dfma+software+cost - http://shareme.com/programs/boothroy d/dewhurst-dfma-software
  • 95.
    95 Strengths Weaknesses  Producesa higher customer orientation, focusing on those aspects of the product/service that better satisfy the customer needs.  Tendency to make generalisations and superficial statements.  Cost reduction by eliminating functions that do not supply specific advantages to satisfy customer requirements/needs.   New ideas that arise from the creativity/innovation phase may add radical changes and therefore competitive advantages that will be regarded by the market.   A new systematic mentality to be taken into account for the next designs of new products or to systematically improve existing ones.  Development – Value Analysis Why – To improve the value of a product or a process by understanding its constituent components and their associated costs. How – The design team must seek to find improvements to the components by either reducing their cost or increasing the value of the functions. There is a specific technique to be applied in value analysis and this is shown opposite. The design team will need to create a function/component hierarchy. Value Analysis Step Specific Technique Orientation/Preparation Basic Techniques Information Analysis Functional Analysis, Basic Techniques Innovation Creativity Basic TechniquesEvaluation Implementation and Monitoring Resources - www.managing-innovation.com/tools/value%20Analysis.pdf Software - www.vamssolution.com/index.htm
  • 96.
    96 Strengths Weaknesses  Producesa higher customer orientation, focusing on those aspects of the product/service that better satisfy the customer needs.  Tendency to make generalisations and superficial statements.  Cost reduction by eliminating functions that do not supply specific advantages to satisfy customer requirements/needs.   New ideas that arise from the creativity/innovation phase may add radical changes and therefore competitive advantages that will be regarded by the market.   A new systematic mentality to be taken into account for the next designs of new products or to systematically improve existing ones.  Development – Value Engineering Why – To achieve balance between required functions, performance, quality, safety, and scope with the cost and other resources necessary to accomplish those requirements. How – This method is conducted by using an examination of function and comparing it with value, defined as the ratio of function to cost. The value can then be increased by either improving the function, or decreasing the cost.  Resources: 1) When discussing, during the creation of the matrix, a cross-functional team is needed. 2) A circular seating position will help with group engagement. 3) Pre-planning with the use of process identification, information gathering, interviewing and mapping, and analysis will give the most effective results. 4) Tools and guidance to help with the creation of the examination output is available online; http://download.cnet.com/The-Value-Engineering-Process/3000_20412_4_10770314.html
  • 97.
    97 Strengths Weaknesses  Developsa more rigorous understanding of the relationship between product and process parameters.  Requires a lot of initial effort.  Maximises the achievement of performance characteristics and minimises the effect of noise, thereby achieving a more robust design.  Requires a significant amount of time.  Identifies parameters which have no significant effect on performance. In these cases, tolerances can be relaxed and cost reduced.   Identifies parameter values which reduce cost without affecting performance or variation.  Development – Experimental Analysis Why – To study or evaluate the performance of the system. How – The design team need to visualise the system as a combination of components, materials, people, equipment, processes and other resources that function collectively to transform a set of inputs into outputs described by one or more response variables.  Resources: 1) When discussing, during the definition of the experiment, a cross-functional group is needed. 2) Pre-planning with the use of process identification, information gathering, interviewing and mapping, and analysis will give the most effective results. 3) Tools and guidance to help with the creation of this type matrix is available online; http://yalma.fime.uanl.mx/~mauricio/montgomery.pdf , www.npd-solutions.com/robust.html Software - www.camline.com/index.php?id=175&gcli d=CMu_uoDXyLECFUcKtAodZk4AMQ - www.statease.com/software.html - www.camo.com/rt/Resources/design_of_ experiment.html - www.jmp.com/applications/doe/ - www.reliasoft.com/doe/features1.htm - www.statcon.de/statconshop/default.htm ?cPath=9_12&language=en - www.statease.com/dx7trail.html - www.nutek-us.com/wp-q4w.html - www.softpedia.com/get/Others/Finance s-Business/The-Unscrambler.shtml - www.brothersoft.com/downloads/experi mental-design.html
  • 98.
    98 Strengths Weaknesses  Helpsan engineered system reach its ‘ideal function’ when all of its applied energy is transformed efficiently into creating desired output energy.  In reality nothing functions like this so a significant amount of time may be spent trying to achieve something which is impossible.  Effective when performed alongside FMEA.  Development – P-Diagram Why – To relate inputs to the desired output. How – This is a useful tool in brainstorming and documenting; Signal Factors, Response variable or Ideal Function, Control Factors, Noise Factors or Error States (failure modes). The idea is to take inputs from a system/customer and relate these to desired outputs of a design that the engineer is creating also considering non-controllable outside influences.  Resources: 1) When discussing issues, during the creation of the diagram, a cross-functional team is needed. 2) A circular seating position will help with group engagement. 3) Pre-planning with the use of process identification, information gathering, interviewing and mapping, and analysis will give the most effective results. 4) Tools and guidance to help with the creation of the examination output is available online; http://thequalityportal.com/p_diagram.htm 5) Software - www.systems2win.com/solutions/P-Diagram.htm - http://creately.com/diagram/ghieehtr1/P+DIAGRAM
  • 99.
    99 Strengths Weaknesses  Providesa very good overview and reference for the project.  Requires time to be taken to learn more about standards and specific methods within specific organisations and industry areas through other references and training.  Encourages good, cross-functional, team work.  Development – FMEA Why – To identify all possible failures in a design. How – This is a step-by-step approach to identifying all possible failures in a design, a manufacturing or assembly process, or a product or service. This is best completed as a matrix and should include all failures which have previously happened to designs and those which have not happened but could feasibly happen in the future. The best results will come with using software and tools to help with the creation of the matrix.  Resources: 1) When discussing issues, during the creation of the diagram, a cross-functional team is needed. 2) A circular seating position will help with group engagement. 3) Pre-planning with the use of process identification, information gathering, interviewing and mapping, and analysis will give the most effective results. 4) Tools and guidance to help with the creation of the examination output is available online; http://asq.org/learn- about-quality/process-analysis-tools/overview/fmea.html 5) Software - www.ptc.com/product/windchill/fmea?gchild=CJv9ibG0ybECFUcKtAodZk4AMQ - www.ptc.com/wqs/failure-mode-effects-analysis-1/free-trial-3.html - www.quality-management-infosource.com/directory/free-fmea-software.html - www.aldservice.com/en/fmea/design-process-fmea.html - www.sigmazone.com/snapsheetsxl.htm - www.fmea.co.uk/FMEA_downloads.html - www.fmeainfocentre.com/tools.htm - www.filestube.com/f/fmea+software - www.sourceforge.net/projects/opemfmea/
  • 100.
    100 Strengths Weaknesses  Ensuresthat the money spent on the developed product is well spent, with the developed product being more likely to infiltrate the market and have an immediate impact and effect.  This method is in its infancy and therefore standards do not exist.  Encourages great, cross-functional team work.  Involves much complex trade-offs with steadfast rules hard to find. Development – Sustainable Consumption Why – To ensure the product has an impact within the market. How – The aim is to ensure the product design penetrates the market, replacing products with poor design to have an impact. The design team must take into consideration many product development aspects; material selection, energy use, extended component life cycles, disassembly, reuse, recycling, reprocessing/remanufacturing, and packaging.  Resources: 1) When discussing issues, during the creation of the diagram, a cross-functional team is needed.  2) A circular seating position will help with group engagement. 3) Pre-planning with the use of process identification, information gathering, interviewing and mapping, and analysis will give the most effective results. 4) Tools and guidance to help with the creation of the sustainable product output is available online; - http://indeco.com/Files.nsf/Lookup/dfs/$file/Dfs.pdf - www.sustainableminds.com/industry-blog/how-product-design-can-promote-sustainable-consumption - www.score-network.org/files//1223_SCORE-Launch-Conf_Proceedings-Refereed-Papers-II_Post-Conf.pdf
  • 101.
    101 Development – SustainableConsumption Contd. Guidelines for Sustainable Consumption Guidelines normally contain long checklists which include; Material Recovery and Reuse Avoid composite materials, standardise materials and fasteners, specify recyclable materials. Disassembly Facilitate means of component separation; avoid permanent attachments of dissimilar materials such as welds. Simplicity Develop common designs for multi-functional parts. Waste Minimisation Reduce product size and weight, reduce packaging. Energy Conservation Reduce energy used in production and product power consumption. Material Conservation Design multi-functional products and parts, specify recycled and renewable materials, use remanufactured components, design for product longevity and performance, design for closed loop recycling. Software/Tools - www.pwc.com/us/en/technology- forecast/2011/issue4/features/feature-technology-enabling- sustainability.jhtml - Solidworks Sustainability Software - http://usa.autodesk.com/sustainable-design/ - www.lcacalculator.com - www.dexinger.com/directory/cat/Sustainable- Design/Software.html - www.etool.net.au
  • 102.
    102 Strengths Weaknesses  Producesa higher efficiency orientation product/service that better satisfy the customer needs the growing need to consider material usage and recycling, reusing and carbon footprint issues.  Tendency to make generalisations and superficial statements.  Cost reduction by eliminating functions/material that does not supply specific advantages to satisfy efficiency requirements of the product.   New ideas that arise from the creativity/innovation phase may add radical changes and therefore competitive advantages that will be regarded by the market.   A new systematic mentality to be taken into account for the next designs of new products or to systematically improve existing ones.  Development – Dematerialisation Why – To ensure the most efficient design is reached. How – This method considers, beside waste, natural resources involved in the products’ life cycle. It literally means the use of less material. The method is closely linked with improving products’ efficiency and with saving, reusing or recycling materials and products. It entails actions at every stage of the production and consumption chain.  Resources: 1) When discussing issues, during the creation of the diagram, a cross-functional team is needed. 2) A circular seating position will help with group engagement. 3) Pre-planning with the use of process identification, information gathering, interviewing and mapping, and analysis will give the most effective results. 4) Tools and guidance to help with the creation of the sustainable product output is available online; - www.alastairhudson.com/wordsandconcepts/Dematerialisation.doc - www.chvlankwak.com/files/Kwak_Materializing%20Dematerialization.pdf - http://dl.acm.org/citation.cfm?id=1949522.1949539 - http://phe.rockefeller.edu/Daedalus/Demat/
  • 103.
    103 Strengths Weaknesses  Ensuresthat the product is innovative and uses ‘best practice’ in order to further the development of the product. Many products have subliminally used inspiration from nature in their development.  This method is in its infancy and therefore standards do not exist.  Encourages great, cross-functional team work.  Involves much complex trade-offs with steadfast rules hard to find. Development – Biomimicry Why – To create innovative designs using examples from nature. How – This method examines nature, its models, systems, processes and elements to emulate or take inspiration from in order to solve human problems. This is done mainly through the use of observation and group discussion after the observation stage.  Resources: 1) When discussing issues, during the discussion stage of this method, a cross-functional team is needed.  2) A circular seating position will help with group engagement. 3) Pre-planning with the use of process identification, information gathering, interviewing and mapping, analysis, and observation will give the most effective results. 4) Tools and guidance to help with the creation of the sustainable product output is available online; - http://biomimicry.net - www.asknature.org - http://usa.autodesk.com/adsk/servlet/index?siteID=123112&id=12089947 - http://oregon.biomimics.net/terms-conditions/
  • 104.
    104 Strengths Weaknesses  Producesa higher efficiency orientation product/service that better satisfy the customer needs the growing need to consider material usage and recycling, reusing and carbon footprint issues, alongside environmental and health and safety impact.  Tendency to make generalisations and superficial statements.  Cost reduction by eliminating functions/material that does not supply specific advantages to satisfy efficiency requirements of the product.   New ideas that arise from the creativity/innovation phase may add radical changes and therefore competitive advantages that will be regarded by the market.   A new systematic mentality to be taken into account for the next designs of new products or to systematically improve existing ones.  Development – Cradle to Cradle Why – To ensure the full life cycle of the product has been prioritised and included during the development of the design. How – For the best results using this method then the framework and implementation guidelines should be followed. Using a cross-functional team during these stages and discussing possible ideas will help ensure the end result is the ‘ideal state’.  Resources: 1) When discussing issues, during the creation of the documentation output of this method, a cross-functional team is needed. 2) A circular seating position will help with group engagement. 3) Pre-planning with the use of process identification, information gathering, interviewing and mapping, and analysis will give the most effective results. 4) Tools and guidance to help with the creation of the sustainable product output is available online; - www.mbdc.com/detail.aspx?linkid=l&sublink=6
  • 105.
    105 Development – Cradleto Cradle Contd. Cradle to Cradle Framework Eliminate the concept of waste. “Waste equals food,” Design products and materials with life cycles that are safe for human health and the environment and that can be reused perpetually through biological and technical metabolisms. Create and participate in systems to collect and recover the value of these materials following their use. Power with renewable energy. “Use current solar income.” Maximise the use of renewable energy. Respect human and natural systems. “Celebrate diversity.” Manage waste water use to maximise quality, promote healthy ecosystems and respect local impacts. Guide operations and stakeholder relationships using social responsibility. Implementation • Start at the bottom • Break down each material into its individual ingredient chemicals • Collaboration with, and education of, the supply chain is critical to the inventory effort, in order to fill in the proprietary gaps not covered by Material Safety Data Sheets • Evaluate each ingredient for its known or suspected human and environmental health hazards throughout the product’s life cycle • Third, the chemical ‘profile’ as a pure chemical then is placed into the context of the chemical’s use within a material application. This ‘in-situ’ assessment may alleviate some of the eco-toxicity concerns associated only with the pure chemical • Finally, the ‘in-situ’ chemical assessments are combined together to develop an assessment of human and environmental health characteristics for a complete material and/or finished product, across their entire life cycles. In addition, the material’s recyclability/compostability is evaluated, based on its own physical properties, irrespective of the relative availability of infrastructure for closing the loop or the Federal Trade Commission definition of ‘recyclable’. Tools/Free E-books - www.product-life.org/en/cradle-to-cradle - http://ebookee.org/Cradle-to-Cradle-Remaking-the-Way-We-Make- Things_549375.html - www.ebooksdownbadfree.com/download/download-cradle-to- cradle-1.html - http://torrentz.eu/cr/cradle+to+cradle+ebook-q
  • 106.
    106 Strengths Weaknesses  Producesa higher efficiency orientation product/service that better satisfy the customer needs the growing need to consider material usage and recycling, reusing and carbon footprint issues, alongside environmental and health and safety impact.  Tendency to make generalisations and superficial statements.  Cost reduction by eliminating functions/material that does not supply specific advantages to satisfy efficiency requirements of the product.   New ideas that arise from the creativity/innovation phase may add radical changes and therefore competitive advantages that will be regarded by the market.   A new systematic mentality to be taken into account for the next designs of new products or to systematically improve existing ones.  Development – Environmental Impact Assessment Why – To assess the impact of the product on the environment. How – This method assesses the possible positive or negative impact that a proposed project may have on the environment. This is achieved through a coordinated relationship between project design, EIA and management. This is intended to be an iterative process rather than an assessment of end state.  Resources: 1) When discussing issues, during the creation of the documentation output of this method, a cross-functional team is needed. 2) A circular seating position will help with group engagement. 3) Pre-planning with the use of process identification, information gathering, interviewing and mapping, and analysis will give the most effective results. 4) Tools and guidance to help with the creation of the sustainable product output is available online; - http://cadlab.mit.edu/publications/abstract.shtml?98-borland-asme-dt-conference - http://environmentalassessment.eu/methodology.html Software - http://sdo.ew.eea.europa.eu/tools/design-environment-dfe- environmental-impact - www.sustainableminds.com/software/ - www.umberto.de/en/ - www.dhigroup.com/SolutionSoftware/RIAM.aspx - www.epa.gov/nrmrl/std/traci/traci.html
  • 107.
    107 Strengths Weaknesses  Decreaseswaste.  Requires a new way of thinking about processes and products.  Allows the recovery of valuable by-products.  Successful implementation relies on effective communication within the organisation.  Improves environmental performance.   Increases resource productivity.   Increases efficiency.   Lowers energy consumption.   Overall reduction in cost.  Development – Cleaner Production Why – To protect human and environmental health while supporting the goal of sustainable development. How – This method should be used in conjunction with other elements of environmental management. It is a practical method for protecting human and environmental health, and for supporting the goal of sustainable development. Cleaner production questions the need for a particular product, and looks at other ways to satisfy the demand.  Resources: 1) When discussing issues, during the discussion stage of this method, a cross-functional team is needed.  2) A circular seating position will help with group engagement. 3) Pre-planning with the use of process identification, information gathering, interviewing and mapping, analysis, and observation will give the most effective results.
  • 108.
    108 Development – CleanerProduction Contd. Cleaner Production Cleaner production activities include; • Pollution prevention • Source Reduction • Waste Minimisation • Eco-efficiency The four elements of cleaner production are; • The precautionary approach – potential polluters must prove that a substance or activity will do no harm. • The preventative approach – preventing pollution at the source rather than after it has been created. • Democratic control – workers, consumers, and communities all have access to information and are involved in decision-making. • Integrated and holistic approach – addressing all material, energy and water flows using life-cycle analysis. Guideline to Use 1) Identify the hazardous substance to be phased out, on the basis of the precautionary principle. 2) Undertake a chemical/material flow analysis. 3) Establish a time schedule for the phase-out of the hazardous substance in the production process, as well as its accompanying waste management technology. 4) Implement and further develop cleaner production processes and products. 5) Provide training and technical and financial support. 6) Actively disseminate information to the public and ensure their participation in decision-making. 7) Facilitate substance phase-out with regulatory and economic incentives. 8) Facilitate the transition to cleaner production with social planning, involving workers and communities affected. Resources - www.iisd.org/business/tools/bt_cp.aspx - www.iisd.ca/consume/unep.html - www.journalamme.org/papers_vol20/14875.pdf - http://designcalls.wordpress.com/2012/07/14/special-issue-of-j-cleaner- production-why-have-sustainable-product-service-systems-not-widely- implemented-sep-2012/ - www.fhnw.ch/lifesciences/iec/forschungsfelder-und-projekte- en/resourcemanagement-und-cleaner-production/cleaner-production-en - http://gulib.georgetown.edu/newjour/j/msg02815.html - www.researchgate.net/journal/0959- 6526_Journal_of_Cleaner_Production - http://sdsap.ord/data/TanArt_W11.pdf - www.ecoefficiency.com.au/Portals/56/factsheet/foundry/ecofndy_guide. pdf
  • 109.
    109 Strengths Weaknesses  Decreaseswaste.  Requires a new way of thinking about processes and products.  Allows the recovery of valuable by-products.  Successful implementation relies on effective communication within the organisation.  Improves environmental performance.   Increases resource productivity.   Increases efficiency.   Lowers energy consumption.   Overall reduction in cost.  Development – Design for Environment How – Systematic consideration of design performance with respect to environmental, health and safety objectives over the full product and process life cycle. Resources - http://www8.hp.com/us/en/hp-information/environment/design-for- environment.html - www.epa.gov/dfe/ - www.bombardier.com/en/transportation/sustainability?docID=09012 60d80008eac - www.pe-international.com/services-solutions/product- sustainability/design-for-environment-ecodesign/ - http://awr-design-environment.software.informer.com - www.dfma.com/software/dfe.htm - www.methodproducts.co.uk/behind-the-bottle/dfe.aspx - www.seas.columbia.edu/earth/RRC/documents/2000.dfe.diss.rase.pdf Tools - http://lcacentre.org/in/ca/pdf/4cLandfield.pdf - http://source.theengineer.co.uk/software-and-communications/design- software/simulation/dfma-2009-features-design-for-environment- tools/334070.article - www.enme.umd.edu/ESCML/Papers/beyond.pdf - http://dl.acm.org/citation.cfm?id=1242343 - www.dfma.com/ - www.gabi-software.com/
  • 110.
    110 Strengths Weaknesses  Providesa better insight of all the costs in the programme and identifying the key cost drivers for potential cost savings.  Successful implementation relies on effective communication within the organisation.  A realistic planning programme and budgeting through a methodical and consistent estimating approach.  Tendency to make generalisations and superficial statements.  Provides the basis for measurement of effective organisational and logistic scenarios and provisions.   Provides a measure to evaluate two or more technically different solutions to assist the decision making process.  Development – Life Cycle Cost Why – To calculate the whole cost of a system from inception to disposal. How – Costs are calculated at user defined time points within the life cycle of the system. Each set of time points is called a time sequence and has a unique name. Define more than one set of time points so that you can investigate the effects of variations in the time point dates and the values of variations at those times.
  • 111.
    111 Development – LifeCycle Cost Contd. Can be broken down in a number of ways;  By time (year, month, or life cycle stages)  By type of costs (direct, indirect, linked, variable or fixed)  By product (systems, subsystems, components)  By process/activity (management, engineering, maintenance, etc.)  By resources (personnel, equipment, consumables)  By organisation  Resources: 1) When discussing issues, during the discussion stage of this method, a cross-functional team is needed.  2) A circular seating position will help with group engagement. 3) Pre-planning with the use of process identification, information gathering, interviewing and mapping, analysis, and observation will give the most effective results. Resources - http://fire.nist.gov/bfrlpubs/build96/PDF/b96121.pdf - http://www1.eere.energy.gov/femp/pdfs/lcc_guide_05.pdf - http://isddc.dot.gov/OLPFiles/FHWA/010621.pdf - http://ec.europa.eu/enterprise/secters/construction/files/compet/files/co mpet/life_cycle_costing/guideance__case_study_en.pdf - www.bcis.co.uk/downloads/SMLCC_conference__belfast_2-09.ppt - http://eprints.utm.my/12222/ Tools - www.wbdg.org/tools/tools_cat.php?c=3 - www.blpinsurance.com/sustainability/life-cycle-costing/ - http://acc.dau.mil/CommunityBrowser.aspx?id=22509 - www.toolkit.bc.ca/tool/life-cycle-costing - www.rics.org/site/scripts/download_info.aspx?fileID=5512&categoryID=52 3 - www.isograph-software.com/lcwover.htm - http://ftp.rta.nato.int/public//PubFullText/RTO/TR/RTO-TR-SAS-069//TR- SAS-069-ALL.pdf
  • 112.
    112 Strengths Weaknesses  Encouragesrational and structured idea generation.  May require training in the use of TRIZ in order to create more innovative solutions to design problems.  Provides the ability to generate a set of data that changes the way the design team thinks.  A lack of understanding of the method will not lead to creative solutions, other ways of inducing ideas should be used alongside this method in order to produce the most relevant and successful ideas.  Helps generate more solutions of higher quality, in less time compare to other methods such as brainstorming or 6-3-5.   Reveals how product design and technologies will evolve in time.   Gives awareness of access to knowledge bases.   Improves quality, reliability and safety.  Development – Critical to Quality Why – To make unanimous as many customer requirements as possible. How – The best way to achieve a critical to quality output is to use a combination of; • TRIZ • FMEA • QFD  Resources: 1) Pens, pencils, structured table to record ideas 2) Should be conducted around a circular table to encourage discussion between the design team 3) Online resources; - www.google.com/patents/US6301516 - www.scientific.net/SSP.165.280.pdf
  • 113.
    113 Strengths Weaknesses  Decreaseswaste.  Requires a new way of thinking about processes and products.  Allows the size, cost and performance of the product/service to be optimised.  Successful implementation relies on effective communication within the organisation.  Improves environmental performance.   Increases resource productivity.   Increases efficiency.   Lowers energy consumption.   Overall reduction in cost.  Development – Dewhurst and Boothroyd (Design for Assembly) Why – To evaluate the necessity of a component/part. How – There are two different methodologies involved in design for assembly, the Lucas Method and the Dewhurst Boothroyd Method. There are many guidelines, principles and worksheets to consider when trying to follow either method.  Resources: 1) When discussing issues, during the discussion stage of this method, a cross-functional team is needed.  2) A circular seating position will help with group engagement. 3) Pre-planning with the use of process identification, information gathering, interviewing and mapping, analysis, and observation will give the most effective results. Resources - http://deed.ryerson.ca/~fil/t/dfma.html - www.dfma.com/ - www.ami.ac.uk/courses/ami4945_dpb/restricted/u 08/supplementary/sup_04.html - http://leva.leeds.ac.uk/www/5330/STOLLW- 18.HTML - http://deed.ryerson.ca/~fil/t/dfmlucas.html Software/Tools - www.design-iv.com - www.dfma.com/software/dfa.htm - www.alibaba.com/showroom/design-for- assembly-software.html
  • 114.
    114 Development – Dewhurstand Boothroyd (Design for Assembly) Contd. Dewhurst and Boothroyd Dewhurst and Boothroyd is based on two principles; • The application of criteria to each part to determine if it should be separate from all other parts. • Estimation of the handling and assembly costs for each part using the appropriate assembly process. Generally the process follows three steps; 1) Select an assembly method for each part 2) Analyse the parts for the given assembly methods 3) Refine the design in response to short comings identified by the analysis 4) Loop to step 2 until the analysis yields a sufficient design Help here can be given by using the Dewhurst Boothroyd DFA Worksheet. Parts are evaluated as the whether they are really necessary by asking three questions; 1) Does the part move relative to another part? 2) Are the material properties of the part necessary? 3) Does the part need to be a separate entity for the sake of assembly? DFA General Guidelines • Minimise part count by incorporating multiple functions into single parts • Modularise multiple parts into single subassemblies • Assemble in open space, not in confined spaces; never bury important components • Make parts such that it is easy to identify how they should be oriented for insertion • Prefer self-locating parts • Standardise to reduce part variety • Maximise part symmetry • Design-in geometric or weight polar properties if non-symmetric • Eliminate tangley parts • Colour code parts that are different but shaped similarly • Prevent nesting of parts; prefer stacked assemblies • Provide orienting features on non-symmetries • Design the mating features for easy insertion • Provide alignment features • Insert new parts into an assembly from above • Eliminate re-orientation of both parts and assemblies • Eliminate fasteners • Place fasteners away from obstructions; design in fastener access • Deep channels should be sufficiently wide to provide access to fastening tools; eliminate channels if possible • Provide flats for uniform fastening and fastening ease • Ensure sufficient space between fasteners and other features for a fastening tool • Prefer easily handled parts The Lucas Method The Lucas Method is based on a points scale which gives a relative measure of assembly difficulty. It is based on three sequential analyses; (best described as an assembly sequence flowchart); 1) Specification 2) Design 3) Functional Analysis (1st Lucas Analysis) - Possibly loop back to step 2 if the analysis yields problems 4) Feeding Analysis (2nd Lucas Analysis) 5) Fitting Analysis (3rd Lucas Analysis) 6) Assessment 7) Possible return to step 2 if the analyses identify problems
  • 115.
    115 Strengths Weaknesses  Decreaseswaste.  Requires a new way of thinking about processes and products.  Allows the size, cost and performance of the product/service to be optimised.  Successful implementation relies on effective communication within the organisation.  Improves environmental performance.   Increases resource productivity.   Increases efficiency.   Lowers energy consumption.   Overall reduction in cost.  Development – Design for Maintenance Why – To evaluate the necessity of a component/part in order to ensure the suitability of the design for maintenance, and to allow for easy replacement of component parts. How – Similar guidelines and principles to the design for assembly are available, however it is easier to complete this method using online resources and tools.  Resources: 1) When discussing issues, during the discussion stage of this method, a cross-functional team is needed.  2) A circular seating position will help with group engagement. 3) Pre-planning with the use of process identification, information gathering, interviewing and mapping, analysis, and observation will give the most effective results. Resources - www.dft.gov.uk/ha/standards/ians/pdfs/ian69.pdf - www.usace- isc.org/presentation/BIM%20CAD/BIM%20NEXT%2 0GEN%FM%20- Design%20for%20Maintenance%20- %20%202011%20Approved%20version.pdf - www.nmmu.ac.za/documents/theses/MSyce.pdf Software/Tools - http://reversingproject.info/wp- content/uploads/2009/05/design_recove ry_for_maintenance_and_reuse.pdf - www.slideshare.net/sylvain/ux-design- service-design-design-thinking
  • 116.
    116 Strengths Weaknesses  Assignsmore indirect costs into direct costs comparing to conventional costing models.  Applicability is bound to the cost of the required data capture.  Identifies and eliminates those products and services that are unprofitable/ineffective.  Drives the prevalence to slow processes in services and administrations. Development – Activity Based Costing Why –To identify activities in an organisation and assign a cost to these activities. How – A methodology is used to focus on cost allocation. It is best completed with the help of software and tools available online and an output considered as a team and recorded on paper.  Resources: 1) When discussing issues, during the discussion stage of this method, a cross-functional team is needed.  2) A circular seating position will help with group engagement. 3) Pre-planning with the use of process identification, information gathering, interviewing and mapping, analysis, and observation will give the most effective results. 4) Tools and guidance to help with the creation of the sustainable product output is available online;
  • 117.
    117 Methodology This is acosting methodology that identifies activities in an organisation and assigns the cost of each activity with resources to all products and services according to the actual consumption by each. The ABC methodology focuses on cost allocations and helps to segregate;  Fixed costs  Variable costs  Overhead costs Resources - www.economist.com/node/13933812 - www.accountingcoach.com/online-accounting-course/35Xpg01.html - www.cimaglobal.com/Documents/ImportedDocuments/cid_tg_activity_bas ed_costing_nov08.pdf.pdf - www.emblemsvag.com/abc.htm - www.sas.com/resources/whitepaper/wp_5073.pdf - www.cliffsnotes.com/study_guide/Activity-Based-Costing- Activities.topicArticleId-21248.articleId-21225.html Tools/Software - www.kashflow.com/?refsrc=24&code=GLEACCSOFT&gclid=CIvztcXMy7ECFa 4mtAodVEsAYA - www.xjtek.com/analogic/demo_models/33/ - www.mrdashboard.com/Activity-Based-Costing.html - http://costperform.co.uk/ - www.business.com>Software - www.cashfocus.com/abc_software - www.data-archive.ac.uk/media/257647/ukda_jiscdmcosting.pdf Development – Activity Based Costing Contd.
  • 118.
    118 Strengths Weaknesses  Prioritizespossible changes by identifying the problems that will be resolved by making these changes.  Drives the prevalence to slow processes in services and administrations.  You can prioritize the individual changes that will most improve the situation.  Applicability is bound to the cost of the required data capture. Development – Pareto Costing/Pareto Analysis Why –To identify the cost of problems/failings within the product design. How – The Pareto chart produced is a bar graph. The bars represent the frequency or cost, and are arranged with longest bars on the left and the shortest to the right. In this way the chart visually depicts which situations are more significant. Works well when the outcomes of the root cause analysis method are used in conjunction with this method. Pareto Tool/Methodology - Identify and list problems - Identify the root cause of each problem - Score problems - Group problems together by root cause - Add up scores for each group - Take action  Resources: 1) When discussing issues, during the discussion stage of this method, a cross-functional team is needed.  2) A circular seating position will help with group engagement. 3) Pre-planning with the use of process identification, information gathering, interviewing and mapping, analysis, and observation will give the most effective results. Online Resources - www.pqsystems.com>QualityAdvisor>DataAnalysisTools - www.spicecsm.com/understanding-the-common-frequent---is-pareti- costing-you/ - http://office.microsoft.com/en-us/templates/cost-analysis-with- pareto-chart-TC006082757.aspx - http://asq.org/learn-about-quality/cause-analysis- tools/overview/pareto.html - www.pareto-ce.com/why.html - www.mindtools.com/pages/article/newTED_01.htm
  • 119.
  • 120.
    120 Strengths Weaknesses  Agood control document for the design provides a single reference document for all the research information which has been transferred into realistic constraints to be imposed on the design.  If not constructed correctly it may tend to lead the design and predict the outcome.  Includes external sources of information which is essential to avoid the designer being limited to his/her own knowledge or experience.  Takes a long time to construct an effective PDS and will require input from a large number of people.  Changes and develops with the progression of the project, enabling the best outcome to be sought.  Implementation – PDS Why – To provide the information needed throughout the life of a design project. How – Create a document which contains all the facts relating to the product outcome. It defines elements, factors and boundaries of the artefact to be designed, not the specification of the artefact as designed. The document should include an introduction, explaining the scope of the PDS, it should be clearly laid out using PDS elements as section headings, with all paragraphs and statements numbered for ease of cross-referencing, and it should end with a conclusion, indicating the further work/steps/information required to allow completion of the PDS.  Resources: 1) Computer, pen, paper, Pugh’s elements of a PDS diagram 2) Made easier if all of the other research findings are summarised with all of the important information included and irrelevant information discarded, in the form of something like a design persona.
  • 121.
    121 Strengths Weaknesses  Laysa good foundation of research and analysis on which a comprehensive PDS can be formed.  Requires a significant amount of research and time in order to compile a very comprehensive document.  Covers a large area of information, irrespective of the product area.   Delineates all the areas necessary for professional practice.   Remains relevant throughout the design process and can be used to narrow the focus at appropriate times during the project.  Implementation – Design Brief Why – To establish the market/user need situation in considerable depth. How – Common practice is to produce a device or document which can vary from the simplest statement of the requirement, to a comprehensive document that aptly describes the true user needs.  Resources: 1) post-its - to help brainstorm key points to include in the brief, computer 2) A circular seating position (if working in a group situation) to encourage discussion during the creation of the brief 3) A wall space to display the outcome and provide a focus point during the rest of the design process
  • 122.
    122 Strengths Weaknesses  Thismethod is simple and flexible and does not depend on a methodological context.  There are no strict rules for creating and HTA diagram so different analysts will generate different styles of hierarchy with varying levels of detail.  Enables the representation of a task hierarchy which could be refined and further detailed.  Requires both training and experience, and cannot be applied immediately.  Provides information, inefficiencies in tasks, which can be used for developing product requirements.  It is not a predictive tool, so it will not help to create solutions, as it focuses on existing tasks.  Although it is task and, to some extent, user oriented it is not too ‘foreign’ an idea and therefore traditional engineers and other business sectors can still understand its use and become involved within the analysis.  The visual graphic representation can become very complex. Implementation – Hierarchical Task Analysis Why – To decompose a high-level task into a hierarchy of subtasks. How – The representation consists of a hierarchy of tasks, sub-tasks and actions, together with plans, that describe the ordering and condition of task performance. The decomposition is done according to the p x c rule that estimates the efficiency of going on with the analysis based on the probability of inadequate performance and the cost of the inadequate performance.  Resources: 1) p x c rule = if the probability of failure (p) times (x) the cost of failure (c) is acceptable, then the analysis should be stopped, dedicated HTA software http://www.brivers.com/resume/projects/hta-software-inventory.php 2) A large wall or display area to display the outcomes of the analysis, so that all involved in the project have instant access
  • 123.
    123 Strengths Weaknesses  Goodfor use within small, to medium sized projects.  Without knowing the process of how product development occurs within the organisation, then steps and resources will be quite easily overlooked.  Useful for identifying a key step which may otherwise be occasionally overlooked.   Provide a framework for helping you think about how you will complete a project efficiently.   Will help avoid last-minute panic.  Implementation – Action Plans Why – To collectively decide on a plan of action for the development of the product and production implementation. How – To draw up an action plane, you simply need to identify and list the tasks which need to be done in order to achieve your objective. The next step is to analyse and delegate tasks throughout the entire project; this includes setting timelines and selecting the appropriate person to carry out each task. The last step is to check with the mnemonic SCHEMES; this stands for space, cash, helpers/people, equipment, materials, expertise and system, all of these also need to be identified and delegated within the action plan.  Resources: 1) When discussing what to include in the action plan, a cross-functional team is needed. 2) A circular seating position will help with group engagement; this will be needed to discuss the outcome of votes. 3) Pre-planning with the use of process identification, information gathering, interviewing and mapping, and analysis will give the most effective results.
  • 124.
    124 Strengths Weaknesses  Givesa basis for scheduling when the tasks will be carried out.  Can take experience and time to configure an effective Gantt chart.  Helps to work out a critical path for a project where you must complete it by a particular date.  Can be difficult to read and understand the final presentation of the Gantt chart.  Helps monitor if a project is on schedule, if it isn’t then it allows you to pinpoint the remedial action needed to put it back on schedule.   Allows you to identify interdependent activities.  Implementation – Gantt Charts Why – To help analyse and plan more complex projects. How – List all the activities needed to complete the project, along with the earliest start date, the estimated length of time it will take to complete, whether it is parallel or sequential, if the task is sequential, show which stage/stages it depends on. Set up a Gantt chart on graph paper, the headings should be the days or weeks through to task completion. Finally plot the tasks onto the graph paper. Set it up so that sequential activities are in the order in which they need to be completed.  Resources: 1) When discussing what to include in the Gantt chart, a cross-functional team is needed. 2) A circular seating position will help with group engagement; this will be needed to discuss the outcome of votes. 3) Pre-planning with the use of process identification, information gathering, interviewing and mapping, and analysis will give the most effective results. 4) Online resources for help with development and understanding of this chart are available; Microsoft Project, http://www.mindtools.com/pages/article/newPPM_03.htm, https://www.smartsheet.com/online-gantt- chart?s=8&c=3&m=414&a=012g&k=gantt%20charts&gclid=CK2gqpL53L ; http://www.smartdraw.com/specials/ppc/project- charts.htm?id=45109&gclid=CLrP56L53LECFVMdtAod_0gAUA, http://www.ganttchart.com/, http://office.microsoft.com/en- us/excel-help/create-a-gantt-chart-in-excel-HA001034605.aspx
  • 125.
    125 Strengths Weaknesses  Adaptable,different style of a bill of materials can be used for small, medium and large projects.  Significant errors can occur which can have a negative effect on the project. These include; parts having the wrong quantity in a bill of materials and parts being omitted from a bill of materials.  When conducted efficiently they can prevent errors help in the accurate tracking of parts through the process.   Easy to read and helps in the ordering of parts and collating parts for construction.   Includes a list of suppliers in order to make ordering easier.  Implementation – Bill of Materials Why – Used to estimate costs but also for inventory control and tracking where parts are used. How – Can come in the form of single level or multi-level. The single level is a total count of all parts used in a construction. The parts in this type of bill of materials are listed in order of the part numbers. A multi-level bill of materials breaks down a construction into subassemblies and those subassemblies into smaller subassemblies and so on. Each part number in this type of bill of materials must have a parent, with the exception of the final assembly.  Resources: 1) When discussing which bill of material type to use and the construction of the bill, a cross-functional team is needed. 2) A circular seating position will help with group engagement; this will be needed to discuss the outcome of votes. 3) Pre-planning with the use of process identification, information gathering, interviewing and mapping, and analysis will give the most effective results. 4) Online resources for help with development and understanding of the bill are available; http://www.billofmaterials.net/, http://www.buyplm.com/bill-of-materials/advantages-of-bill-of-materials-software- tool.aspx?s=adw&g=bomgen&a=mlbcc&d=111125&gclid=COiQ7uiD3bECFfMdtAodxn0AVg, http://www.plm.automation.siemens.com/en_us/products/teamcenter/bill-of-materials-bom-management/
  • 126.
    126 Strengths Weaknesses  Bringstogether multiple perspectives and expertise.  Out-of-date information can be a burden to the process.  Facilitates group problem solving.  Implementation – Collective Visualisation/Interactive Networks Why – To co-create solutions and share ideas among departments, businesses and groups involved in the design process and similar applications. How – Design is changing from an individual to a collaborative process, from studio to out in the world, from object to purpose, from application to implication. Co-creation is taking place throughout all stages of the process using online and computer based software to help communication. Who is involved? - Inside companies and organisations - Between companies and their business partners - Between companies and the people they serve - Within communities  Resources; 1) Pre-planning with the use of process identification, information gathering, interviewing and mapping, and analysis will give the most effective results. 2) Tools and guidance to help with the creation of collective visualisation/interactive networks are available online
  • 127.
    127 Implemenation – CollectiveVisualisation/Interactive Networks Contd. Software for Project Collaboration - Ace Project – www.aceproject.com/ - Adobe Acrobat - Agile Zen – www.rallydev.com - Airset – www.airset.com - @Mail – www.atmail.com - Axigen – www.axigen.com/mail-server/ - Basecamp – www.basecamp.com - Binfire – www.binfire.com - Blogtronix – www.blogtronix.com - Box – www.box.com - Basic Support for Collaborative Work – http://public.bscw.de/pub/ - Organice – www.cadac.com/organice/en/solutions/Pages/def ault.aspx - Cadweb – www.cadweb.co.uk - Calliflower – www.calliflower.com - Cerebro – www.cerebrohq.com - Clarizen – www.clarizen.com - Clearspace – www.jivesoftware.com - Clickhome – www.ClickHome.biz - Clinked – http://clinked.com/ - CodeBeamer – www.intland.com/products/codebeamer/overview / - Collaba – www.collaba.com - Collaber – www.collaber.com - Collabtive – http://collabtive.o-dyn.de/ - Concursive – www.concursive.com/ - Collanos – www.collanos.com - CoMotion – www.gdc4s.com/content/detail.cfm?item=323415 61-76f9-40f8-8ad5-0f0d66dd240e Contactizer – http://objective- decision.com/en/products/contactizerpro/ Creately – www.creately.com Debategraph – http://debategraph.org/home#61932_5_1 E Text Editor – http://e-texteditor.com/ Err-chatbot – http://gbin.github.com/err/ Edit Grid – www.editgrid.com Documentum – www.emc.com/products/family/documentum- standard-family.htm First Class – www.firstclass.com/ FMYI – www.FMYI.com GForge – www.gforge.org Google Apps – www.google.com/apps Grove Site – www.GroveSite.com Hall.com – http://hall.com Huddle – www.huddle.com Hyperoffice – www.hyperoffice.com/blog/ I-Sense – www.nextgroupware.com IBM Lotus Notes – www- 01.ibm.com/software/lotus/products/notes/ IBM Lotus Quick Place – www- 01.ibm.com/software/lotus/products/quickr/ Jama – www.jamasoftware.com Jot Spot – http://sites.google.com Kerio Connect – http://kerio.com/connect Knowledge Tree - www.knowledgetree.com Liferay – www.liferay.com Liquid Planner – www.liquidplanner.com Mavenlink – www.mavenlink.com McClaren Fusion Live – www.mclarensoftware.com/ Mind Meister – www.mindmeister.com Mixedink – www.mixedink.com/#/_how_it_works Nefsis – www.nefsis.com Novell Group Wise – www.novell.com/groupwise Oracle Beehive – www.oracle.com/products/middleware/beehive/in dex.html Oracle Wecentre omNovia Technologies – www.omNovia.com Owis Pidoco – www.pidoco.com Pivotal Labs – www.pivotallabs.com Planbox – www.planbox.com Protoshare – www.protoshare.com Qontext – www.qontext.com Ramius Corporation (community Zero) – www.ramius.net Saba Software – www.saba.com Same Page – www.etouch.net/products/collaboration/index.html Saros – www.saros-project.org Seefile – www.seefile.com Smart sheet – www.smartsheet.com Socialtext – www.socialtext.com SubEthaEdit – www.codingmonkeys.de/subethaedit Synovel Collabsuite – www.synovel.com Team Wix – www.teamwox.com/en Telligent Systems – www.telligent.com Tms EKP – www.tmsasia.com/cms/index.jsp Traction Team Page – www.tractionsoftware.com Teamwork – www.twproject.com Tonido – www.tondio.com/ Tracker – www.Acentre.com Ubidesk – www.ubidesk.com
  • 128.
    128 Implementation – CollectiveVisualisation/Interactive Networks Contd. - Webex – www.webex.com - Wiggio – www.wiggio.com - Workspot – www.workspot.com/ - Wrike – www.wrike.com - Zing Technologies – www.anyzing.com/
  • 129.
    129 Strengths Weaknesses  Canintegrate auto network discovery with network mapping.  Can take a large amount of time to set-up a sophisticated and useful network map.  Helps to visualise the network and understand relationships between end devices and the transport layers that provide service.   Bottlenecks and Root Cause Analysis can be easier to spot using these tools.  Implementation – Network Mapping Why – To ensure that a network or service meets the needs of the subscriber and the operator. How – Involves five layers of planning; 1) business planning, 2) long-term and medium-term network planning, 3)short-term network planning, 4) IT asset sourcing, 5) operations and maintenance. Incorporates plans for different time horizons. Begins with the acquisition of external information, including; forecasts of how the network/service will operate, economic consideration concerning costs, and technical details of the network’s capabilities.  Resources: 1) Easy access to documentation for all those involved throughout the design and manufacture of the product/service is essential for this method to work. 2) When developing documents, a cross-functional team is needed, using large sheets of paper around a large table will help with inclusivity and interaction. 3) For help with understanding and the construction of diagrams etc. software and online tools can be used; www.spiceworks.com/free-network-mapping-software/
  • 130.
    130 Strengths Weaknesses  Helpsbridge the gap between business and IT to allow processes to be designed and modelled in an effective and collaborative way.  Involves the identification of all elements of a process to ensure the outcome is effective.  Gives the organisation the ability to easily create executable workflow diagrams of business processes in a graphic environment.  Takes a significant amount of time to develop and put in to practice.  Clear and easy to follow visually.   Aligns processes with companies values and capabilities.  Implementation – Environment Mapping (Business Process and Workflow Modelling) Why – To give an organisation the ability to easily create executable workflow diagrams. How – The final output of this method is an improvement in the way the business process works. The focus of the improvements is on ‘value added’ actions that make the customer experience and service better. The aim of modelling is to illustrate a complete process, enabling managers, consultants and staff to improve the flow and streamline the process.  Resources: 1) Easy access to documentation for all those involved throughout the design and manufacture of the product/service is essential for this method to work. 2) When developing sketches/diagrams, a cross-functional team is needed, using large sheets of paper around a large table will help with inclusivity and interaction. 3) For help with understanding and creation of diagrams, online resources are available; www.ultimus.com/BusinessProcessModelling/ 4) Pre-planning with the use of process identification, information gathering, interviewing and mapping, and analysis will give the most effective results
  • 131.
    131 Strengths Weaknesses  Canbe used as a process documentation guide.  Need to ensure everyone understands the document contents.  Used for four basic steps in design; process management, discovery, assessment and redesign and deployment.  Without clear documentation, a process can quickly fall into disarray.  Provides organisation specific information.  A guide for every process is needed.  A good base for the documentation will mean that it can easily be added to as time goes by.  Implementation – Community Documentation Why – To provide a process documentation guide to help with development and implementation. How – Having a process and system for keeping documentation for all parts of the design process can help with the management of the entire process. These documents also need to be accessible to everyone as it may aid with discovery and the development process.  Resources: 1) Easy access to documentation for all those involved throughout the design and manufacture of the product/service is essential for this method to work. 2) When developing sketches/diagrams, a cross-functional team is needed, best based on a computer system with easy access across different departments in different geographic locations. 3) For help with understanding and creation of diagrams, online resources are available; www.ibm.com/developerworks/library/ar-procdoc/ 4) Pre-planning with the use of process identification, information gathering, interviewing and mapping, and analysis will give the most effective results
  • 132.