The document discusses plant disease forecasting. It provides information on:
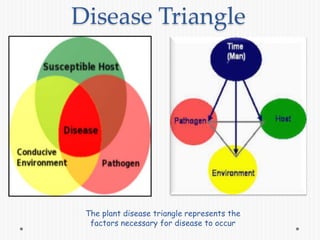
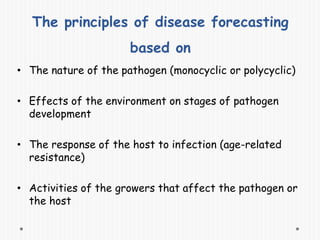
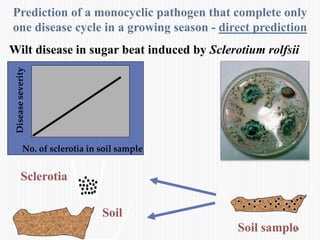
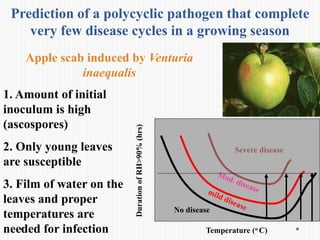
1. The principles of disease forecasting are based on the nature of the pathogen, environmental effects on pathogen development, host response to infection, and grower activities.
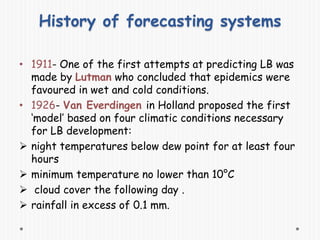
2. Models for disease prediction include empirical, simulation, and general circulation models, but these models have limitations due to uncertainty and non-linear relationships.
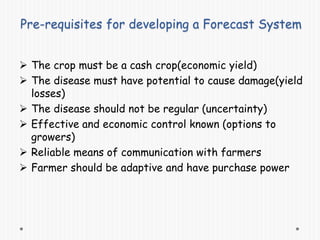
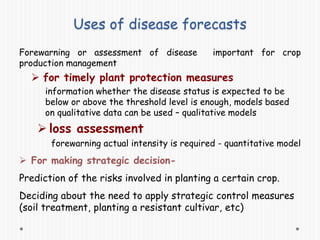
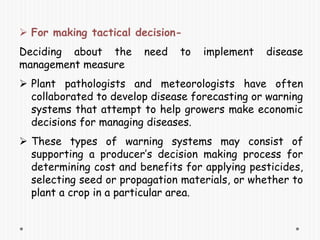
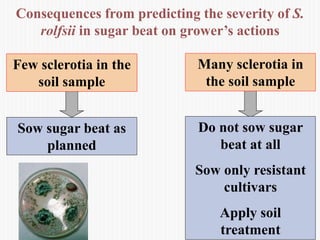
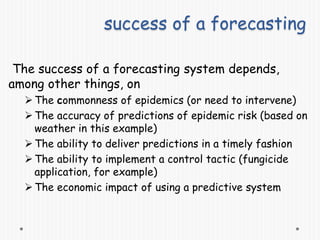
3. Disease forecasts are used for strategic decision making like crop selection and tactical decisions around disease management measures. Successful forecasting requires reliability, simplicity, importance of the disease, and usefulness.