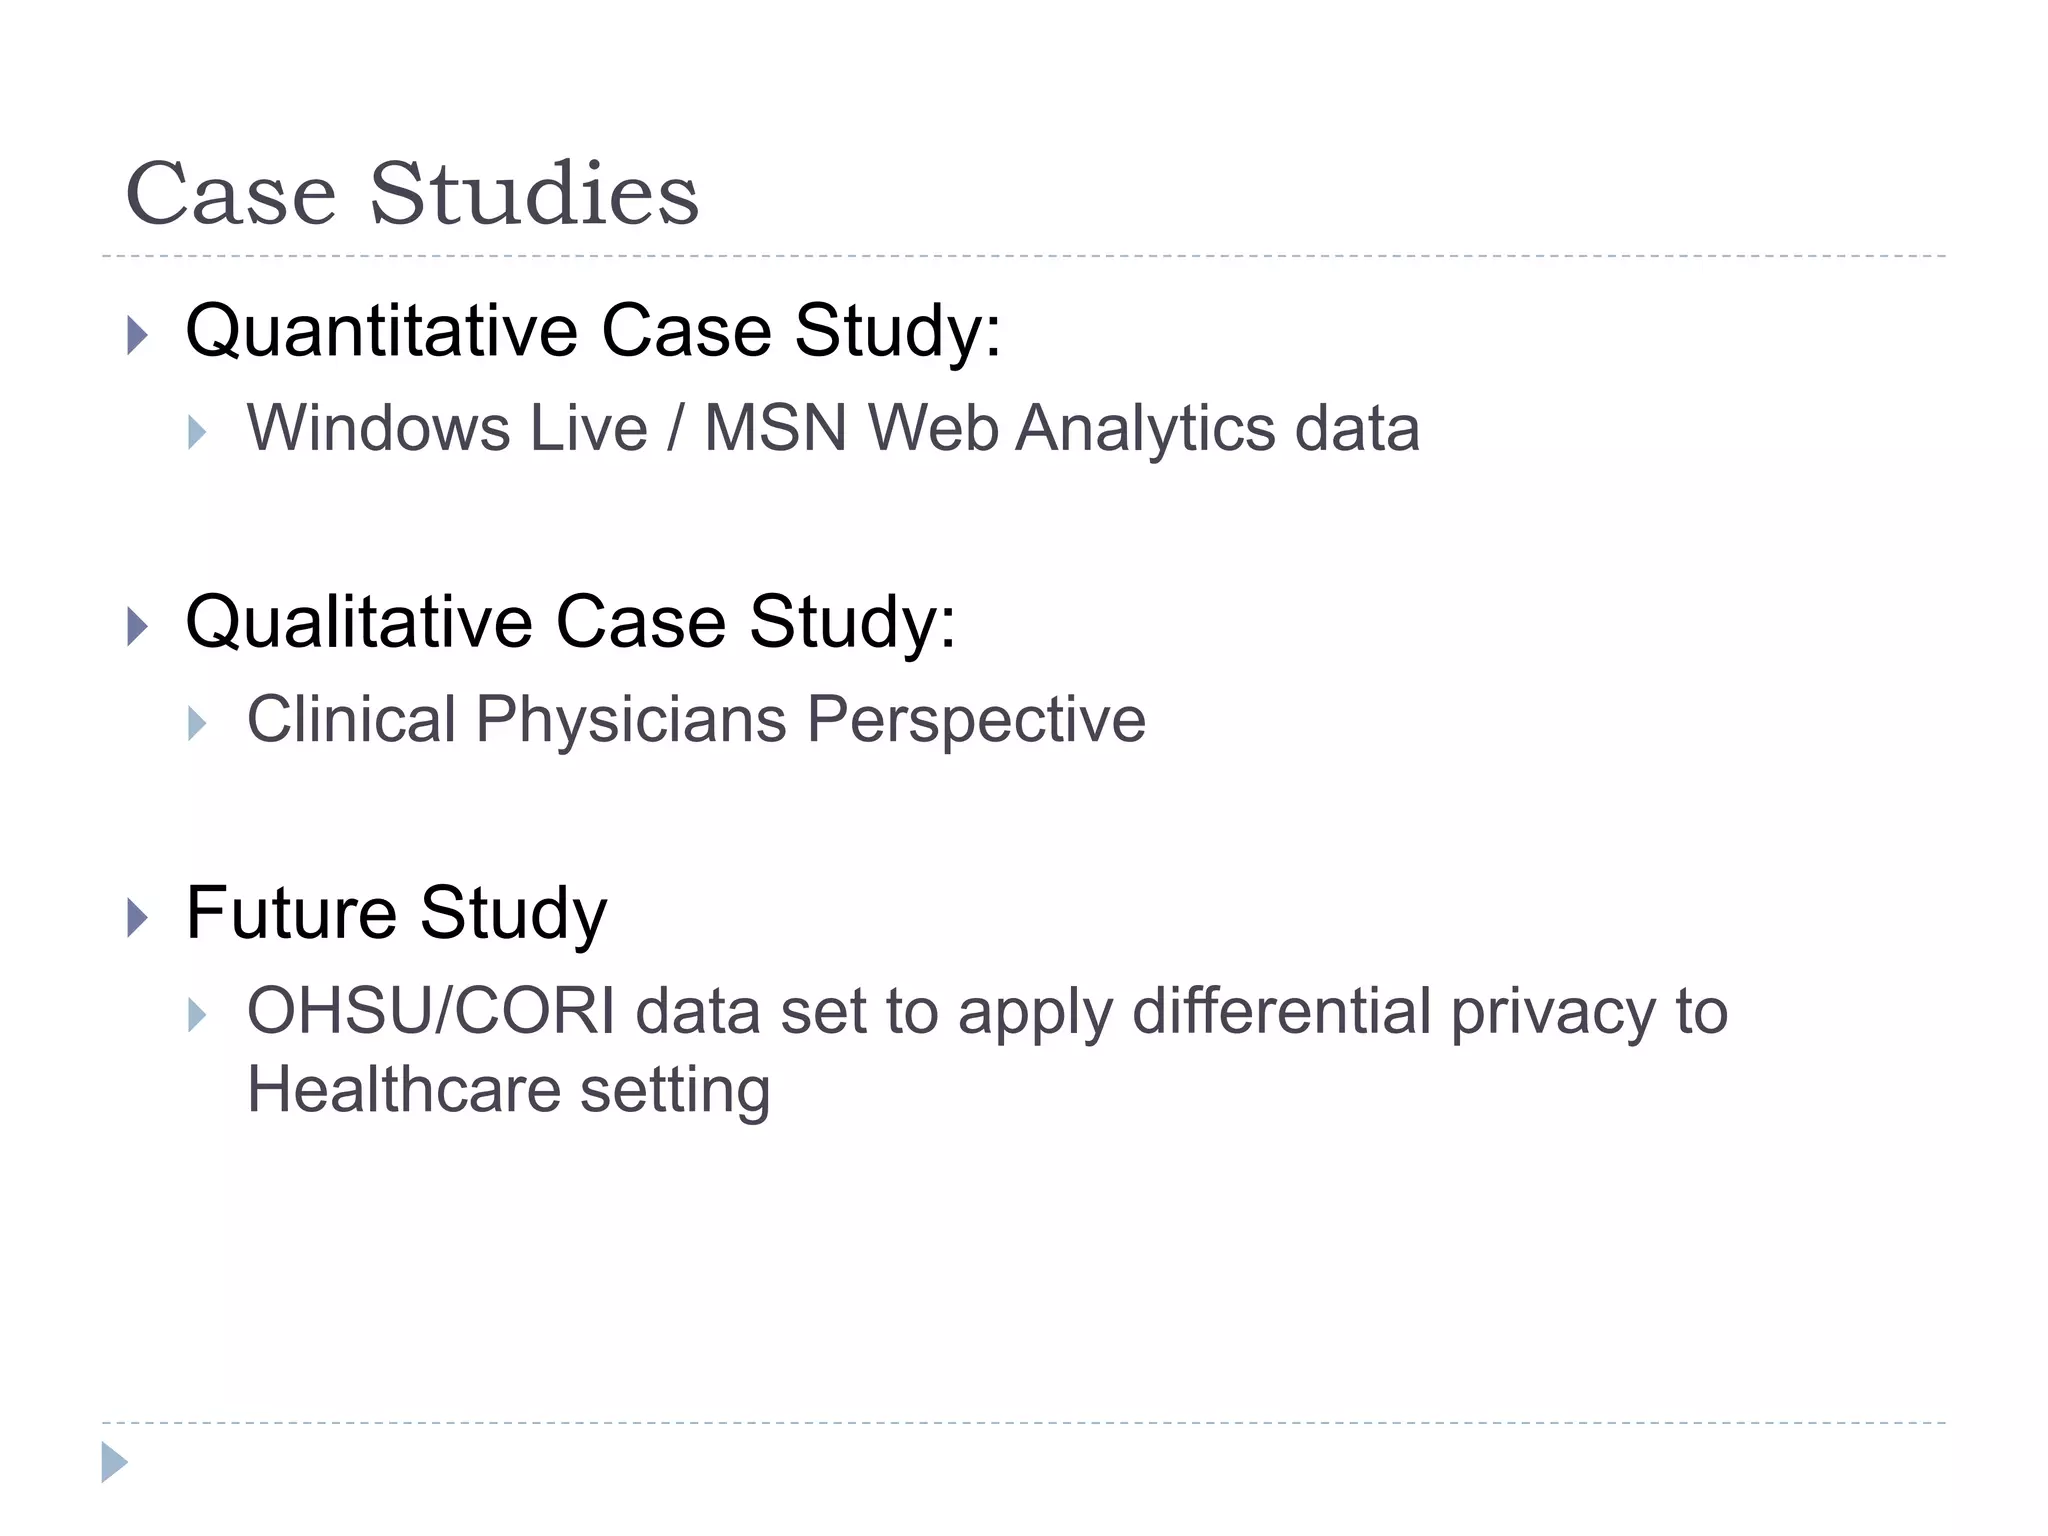
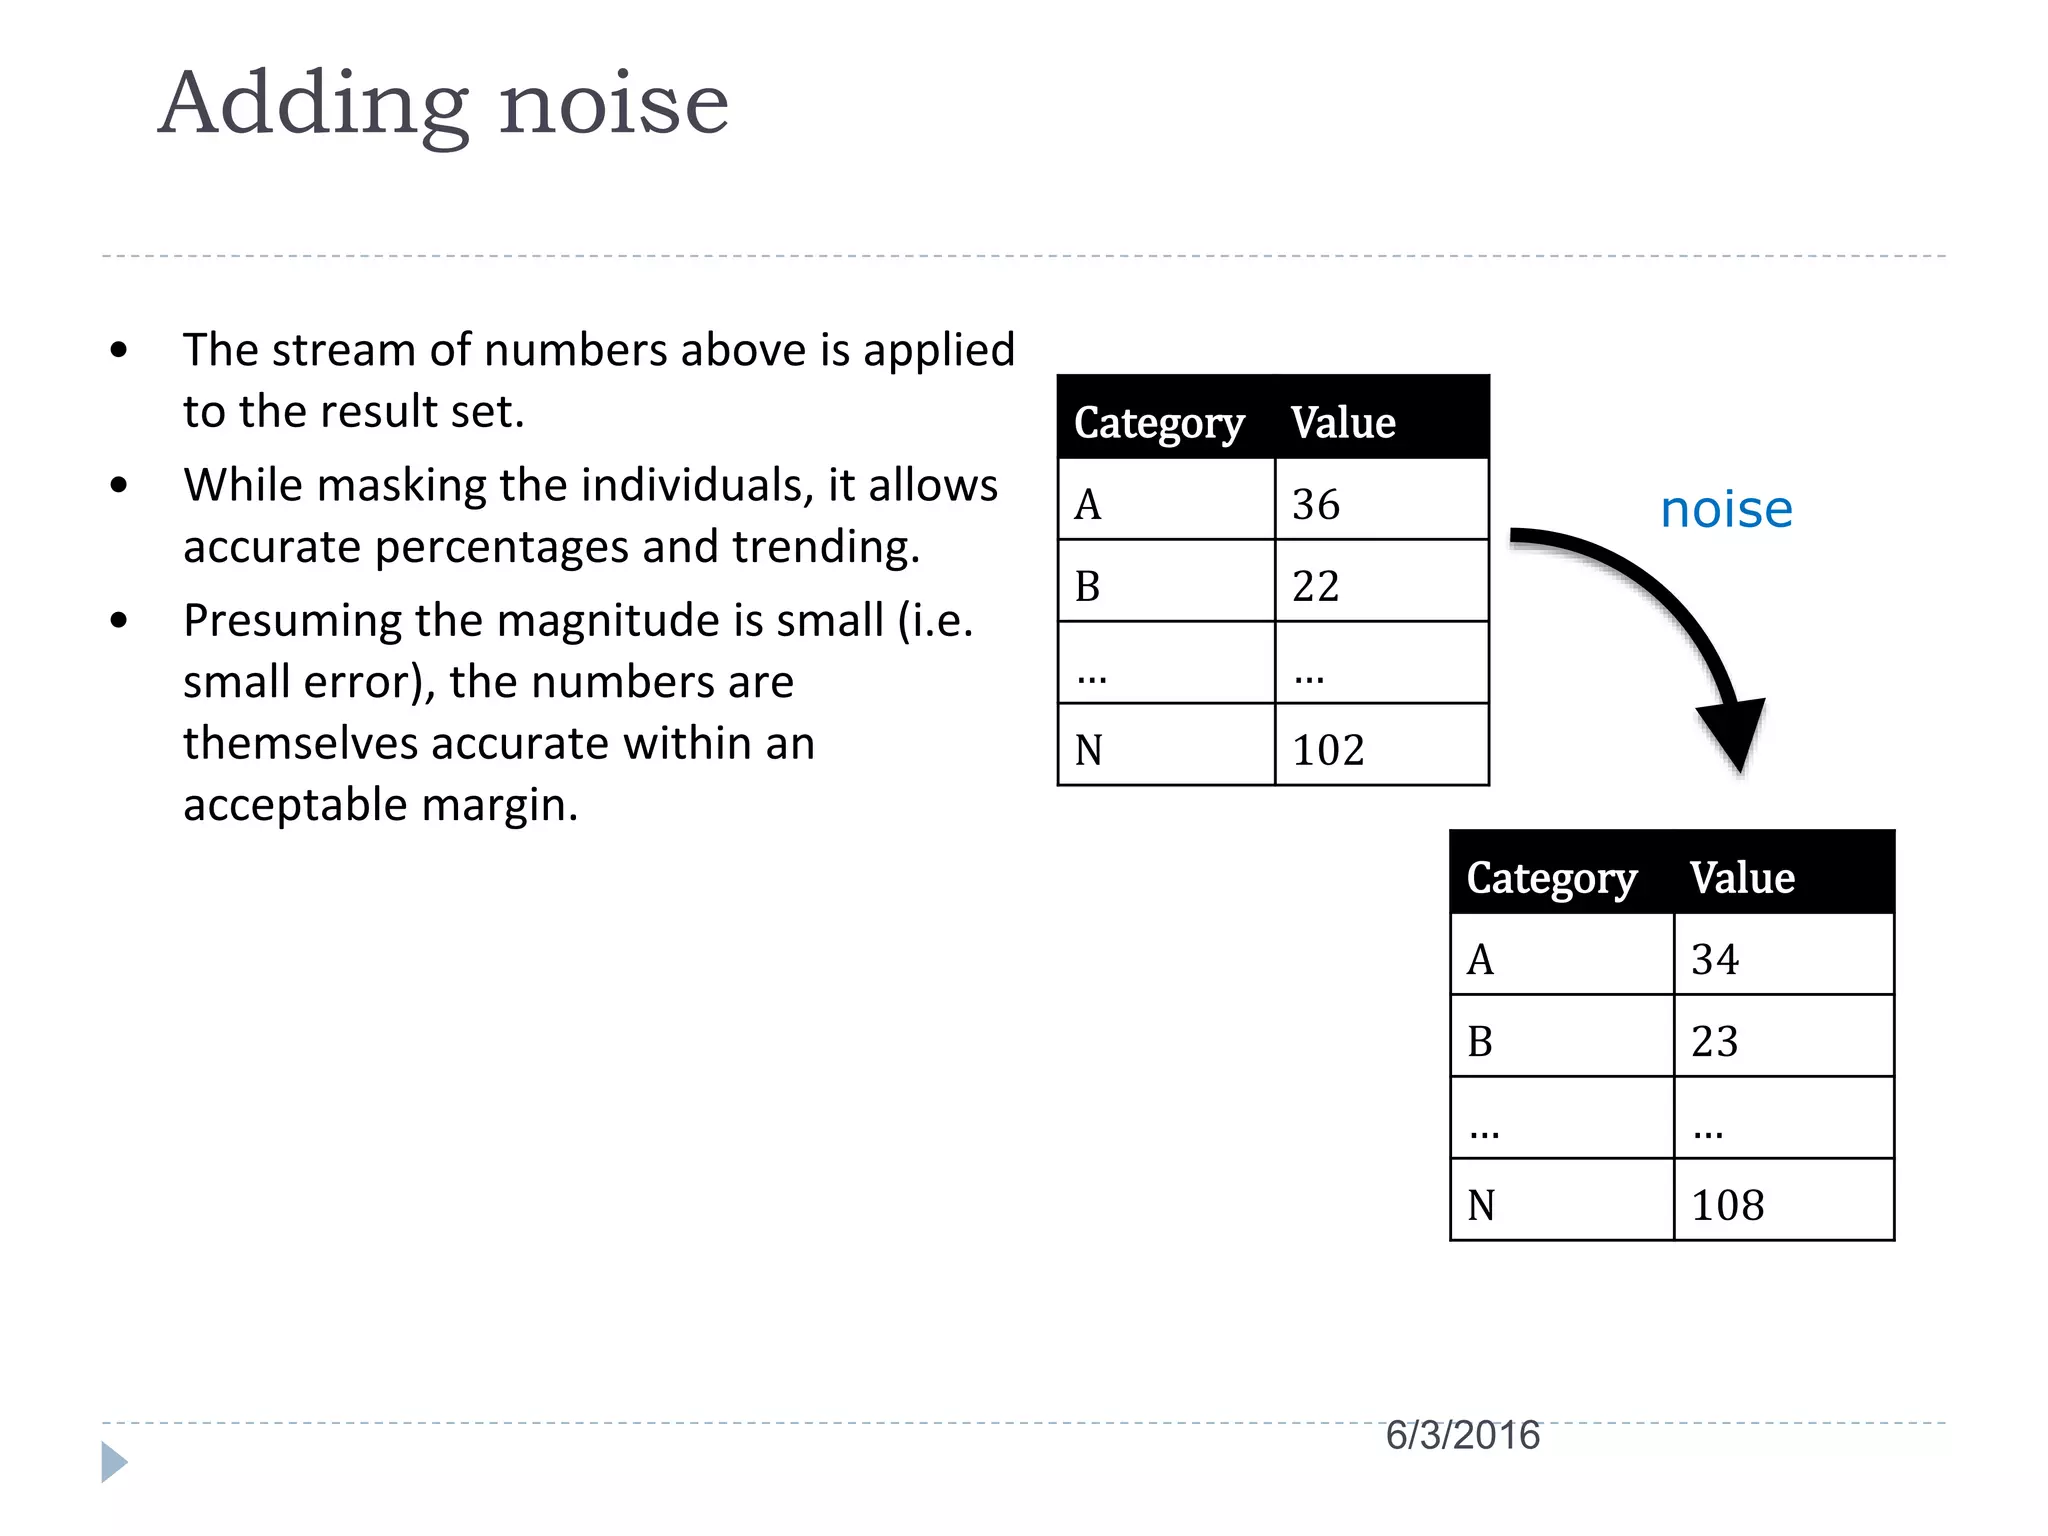
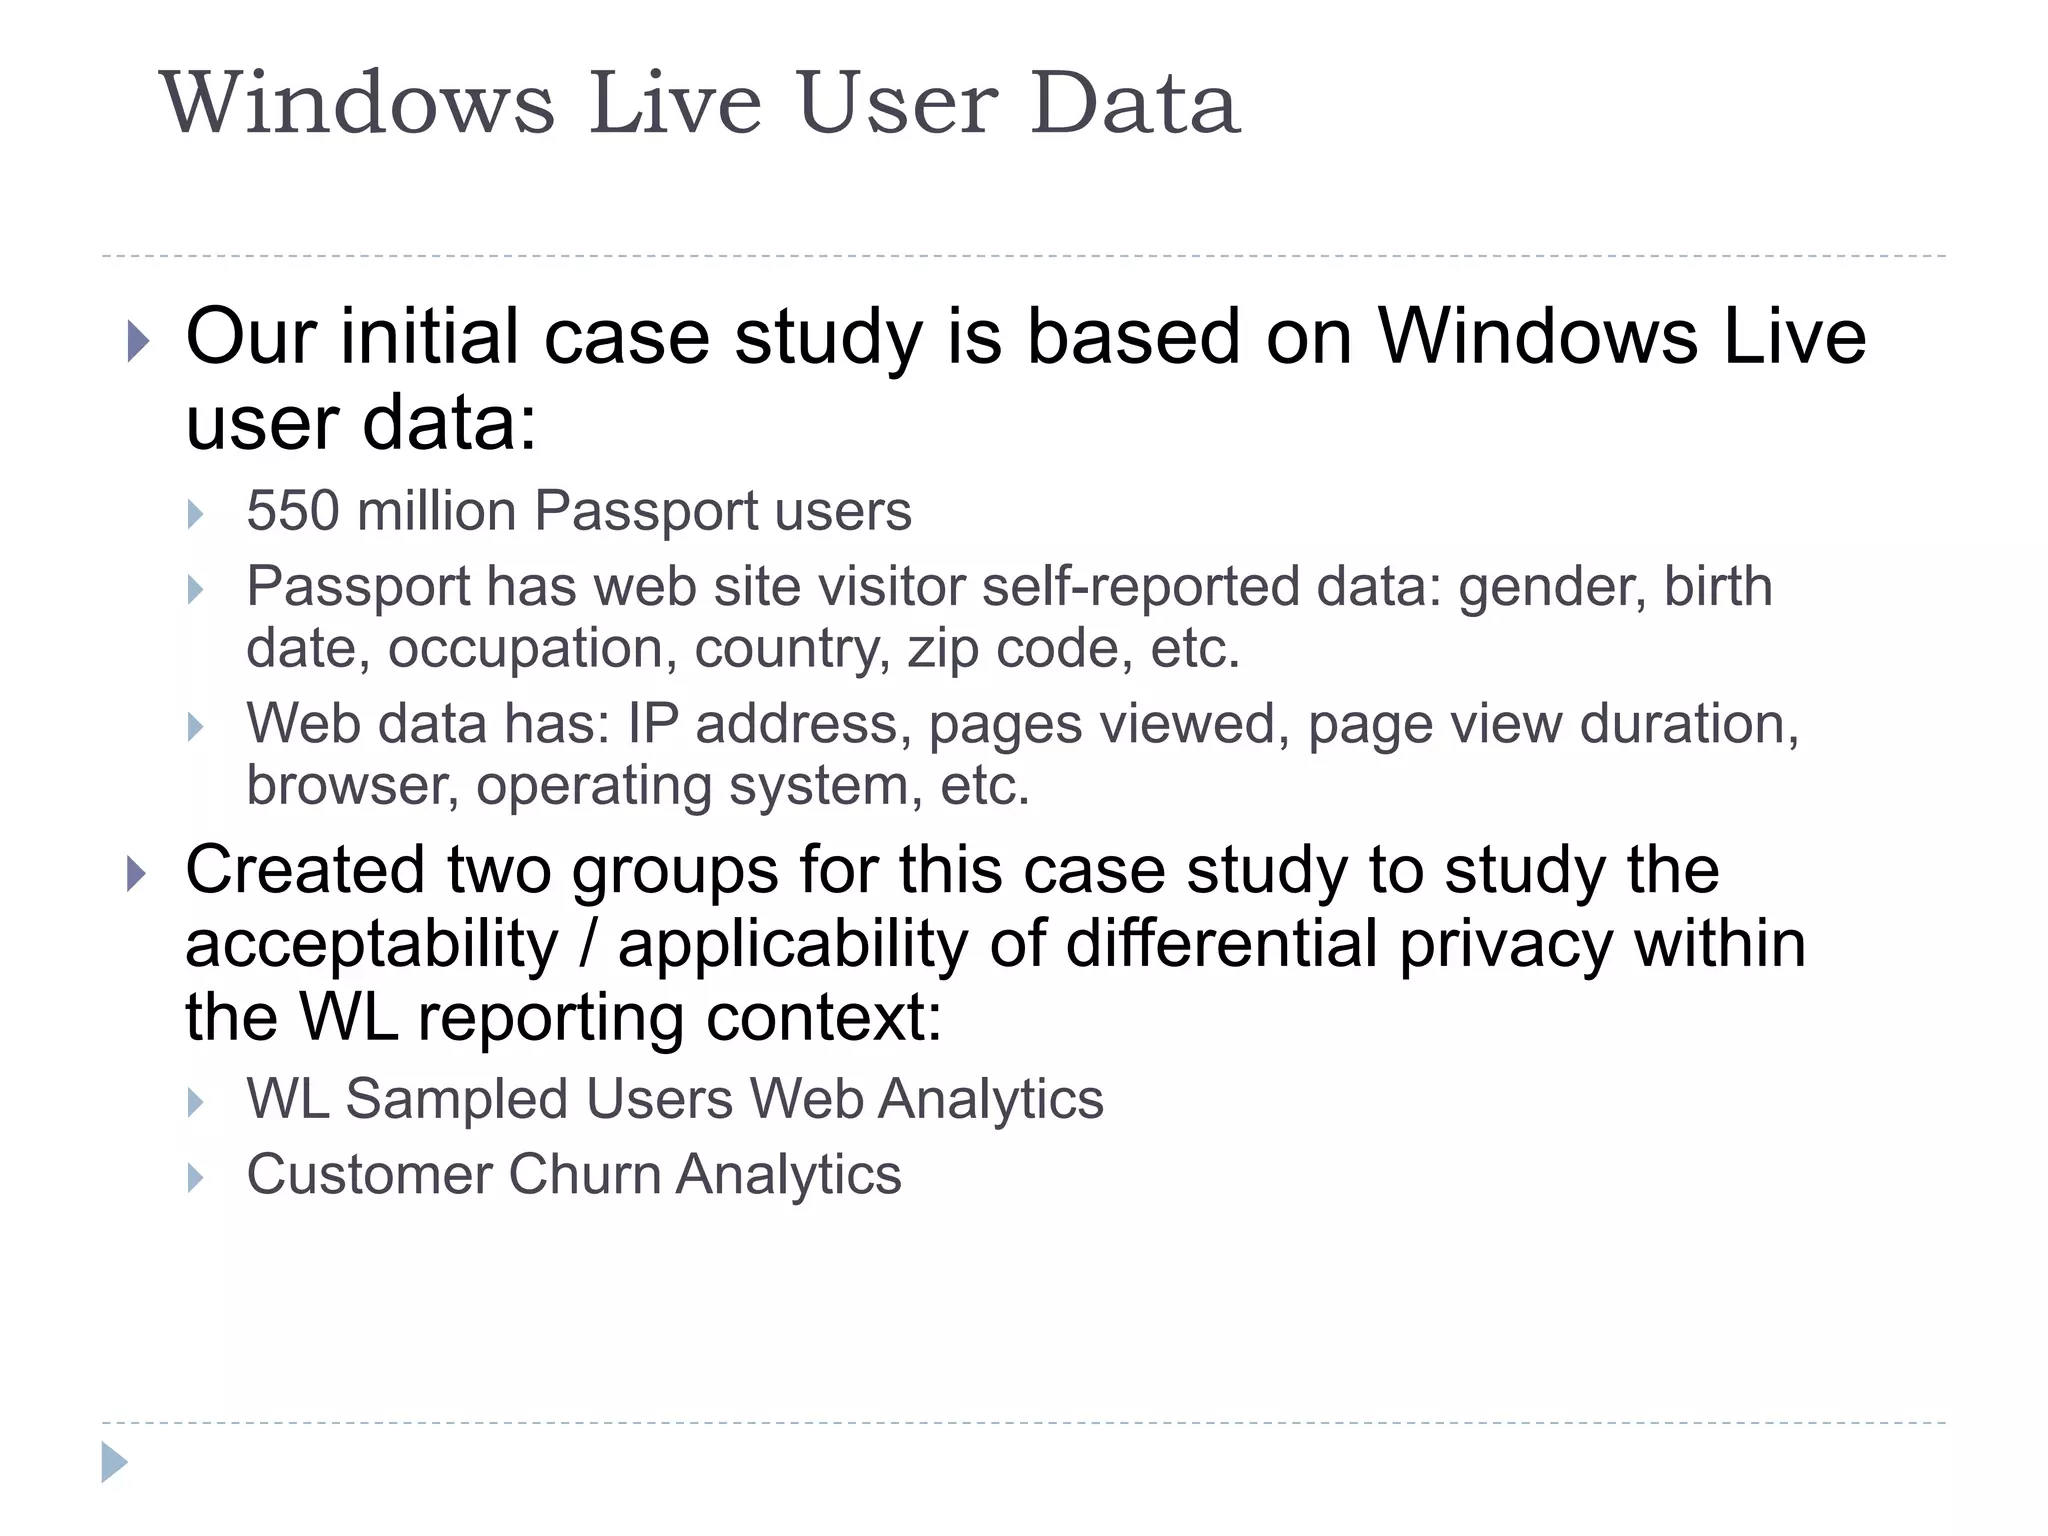
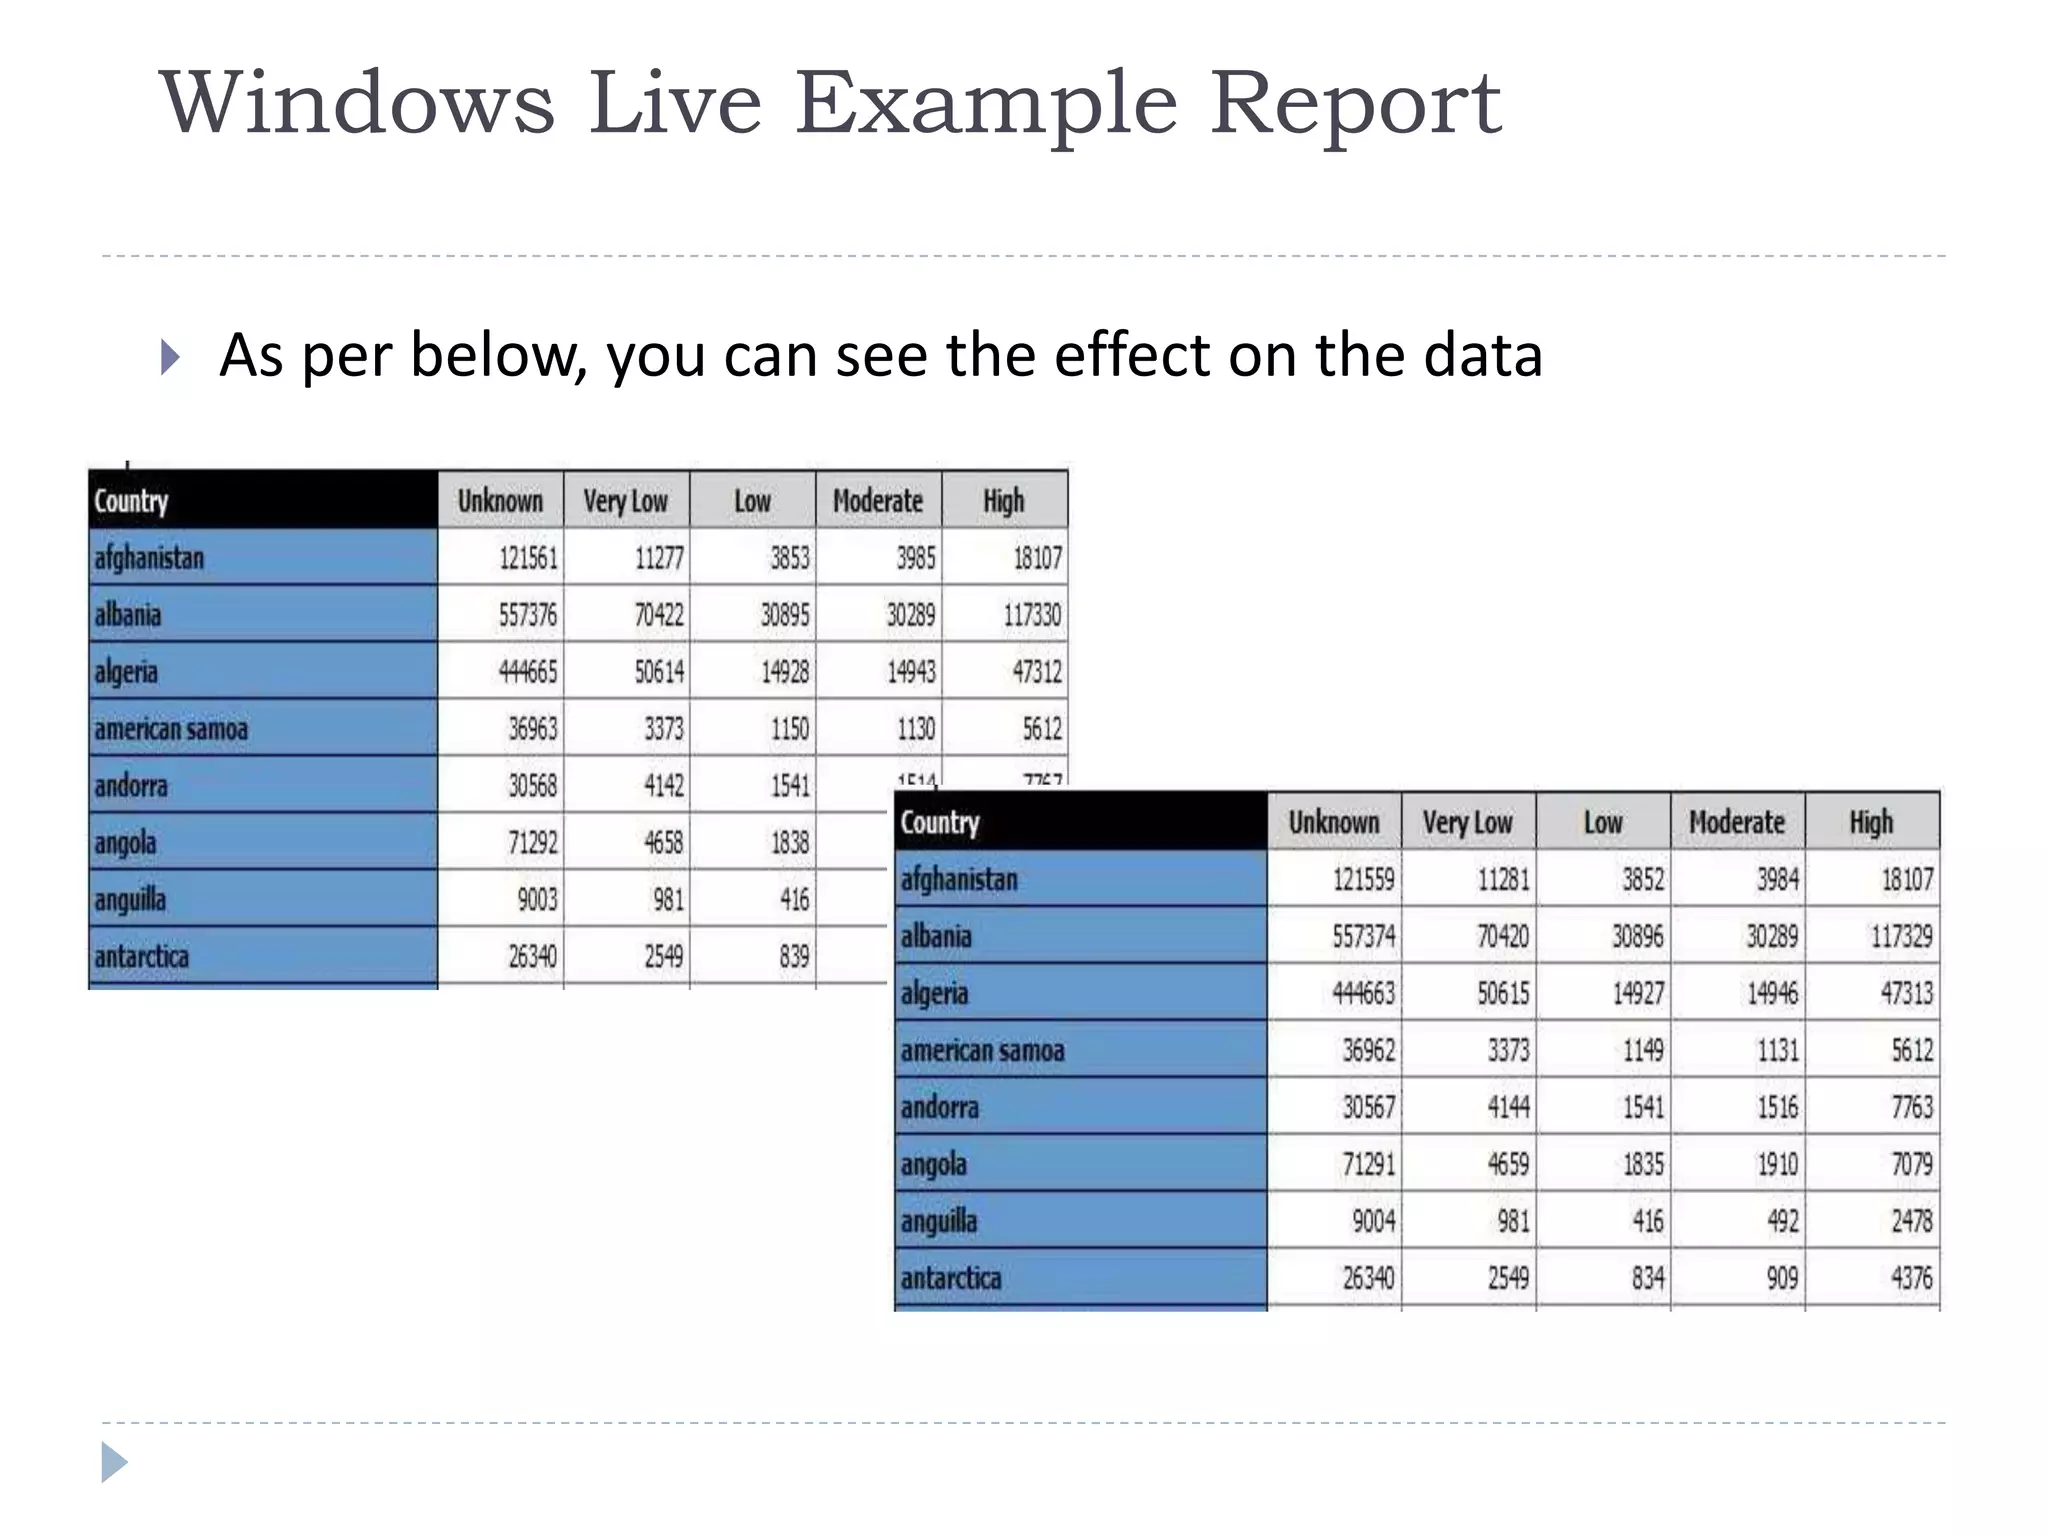
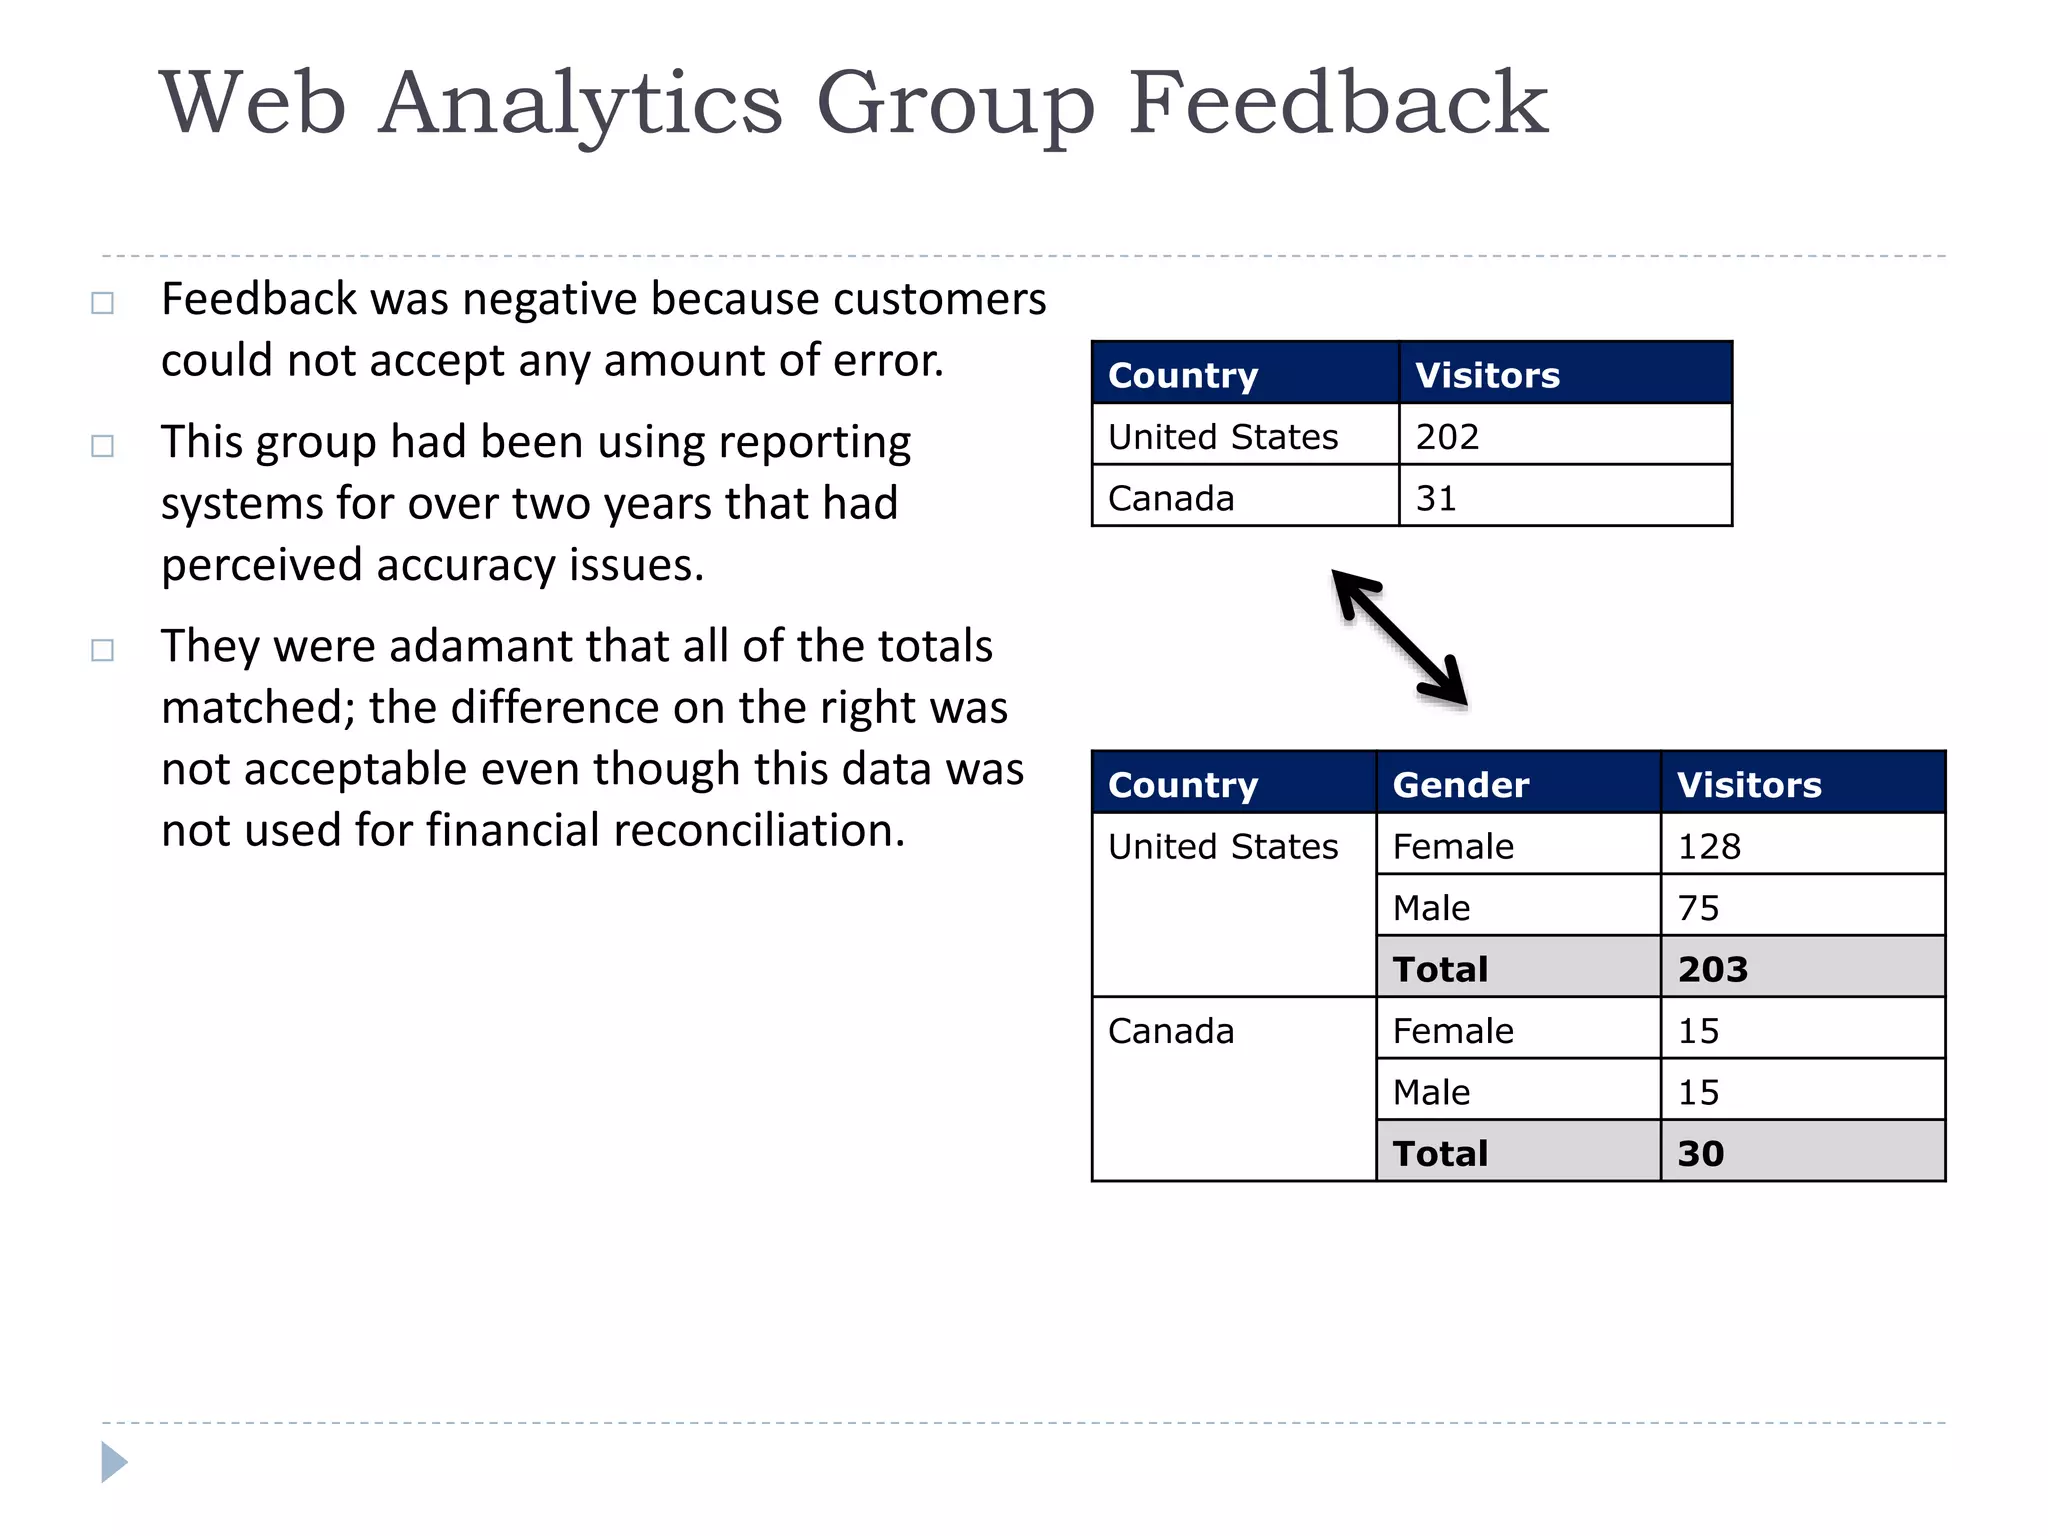
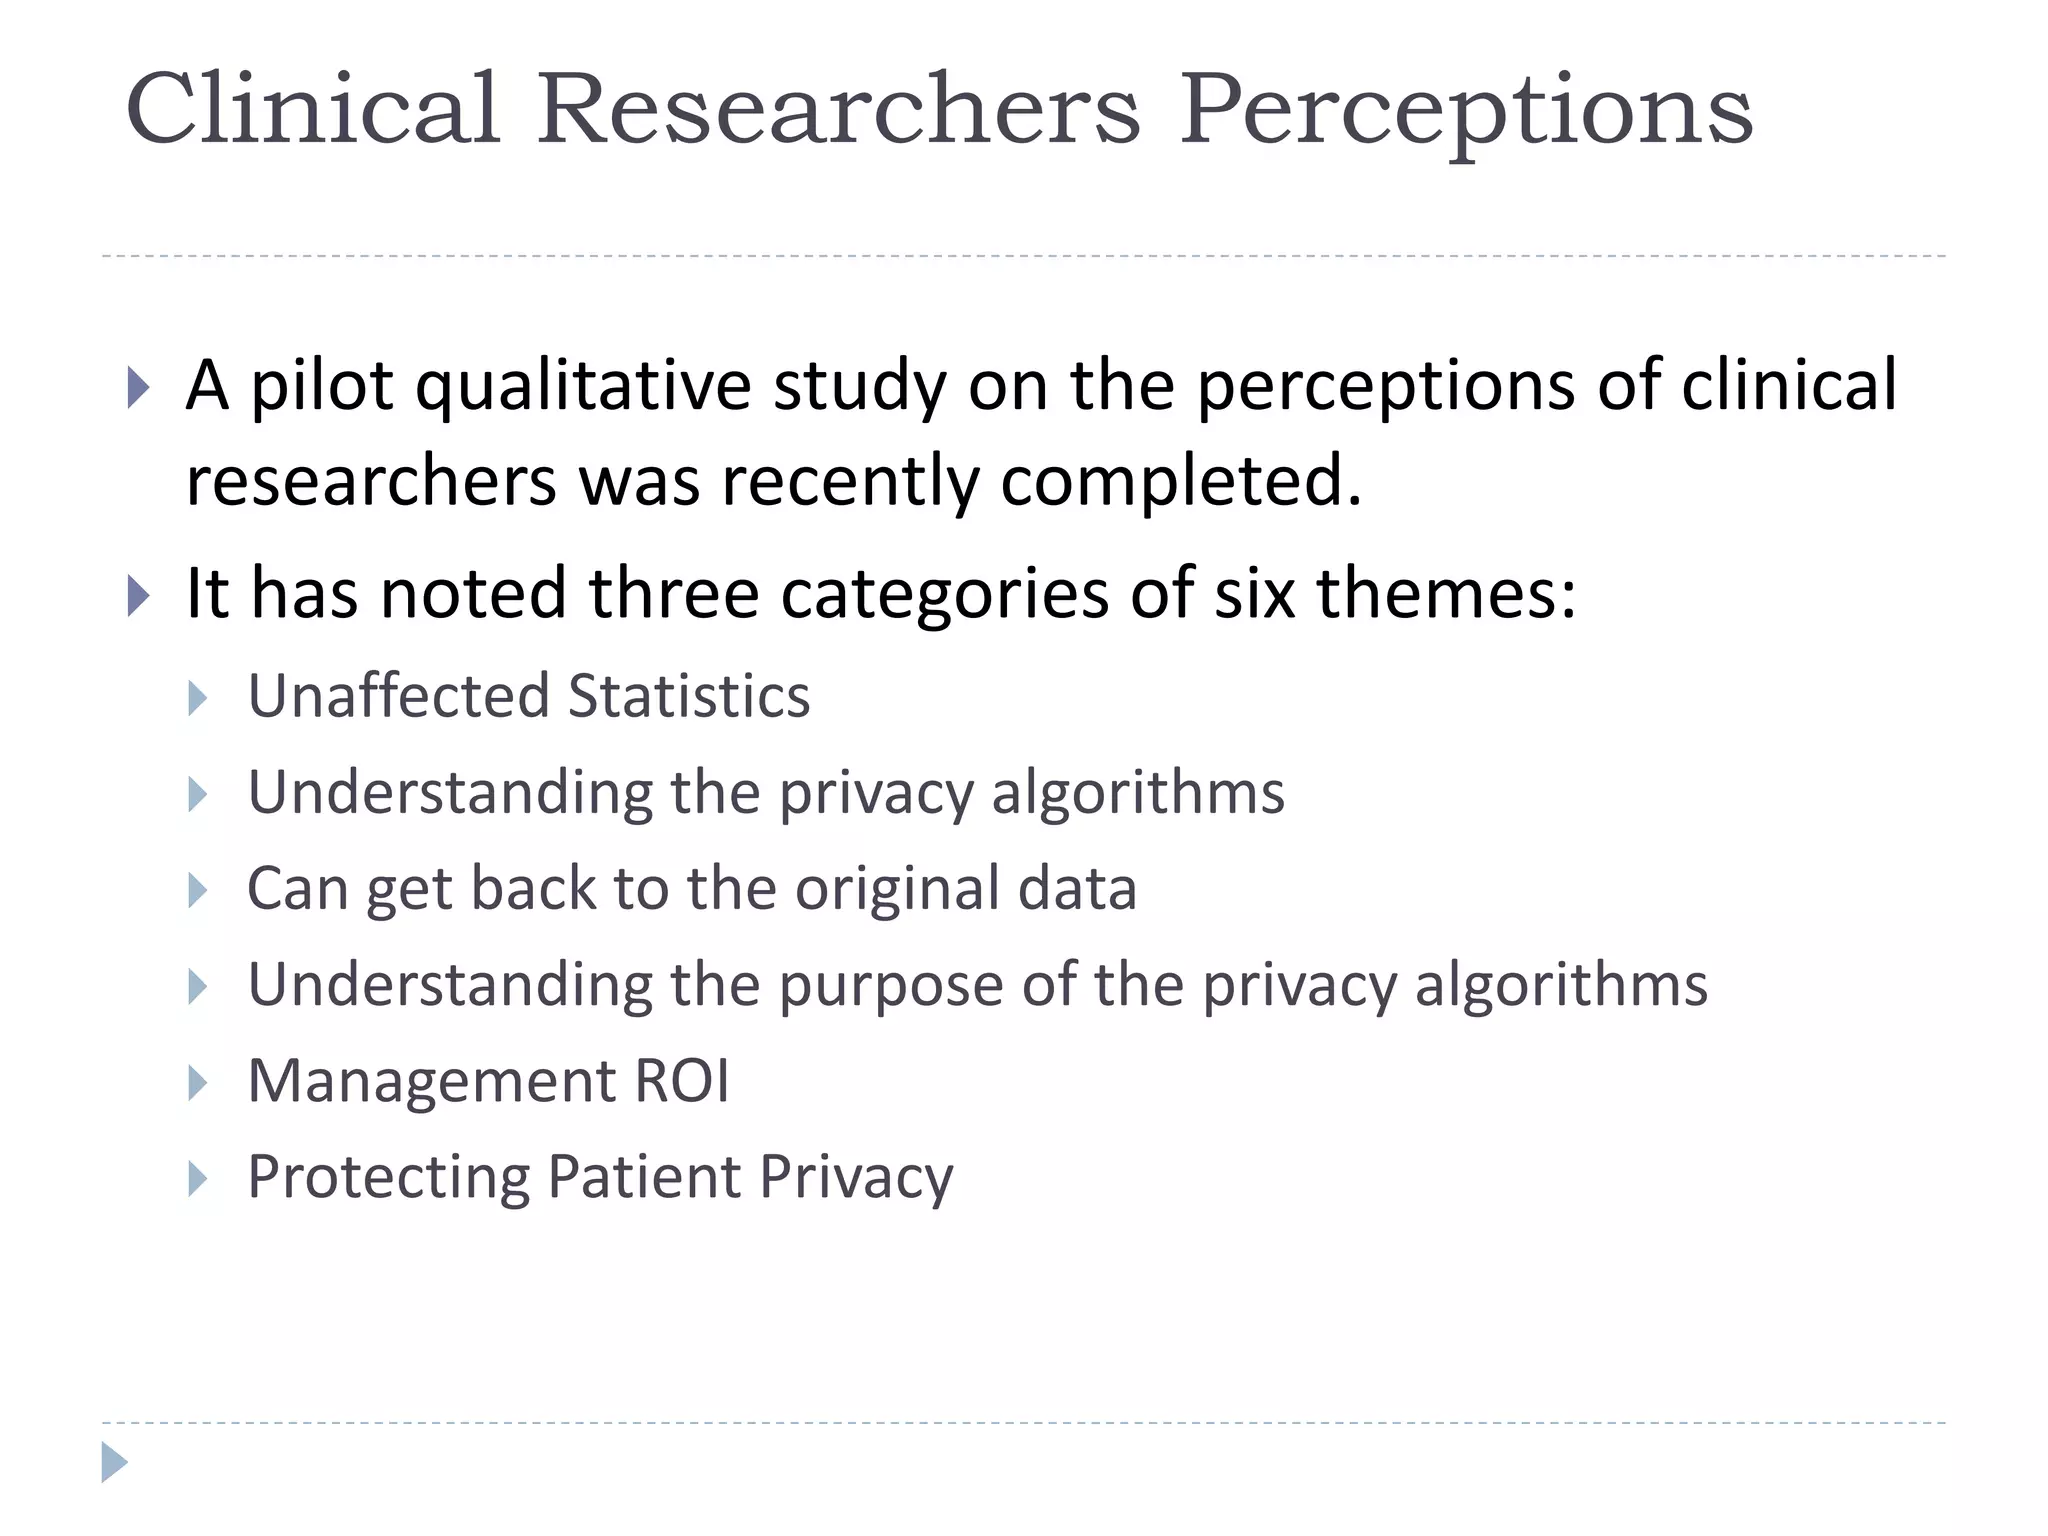
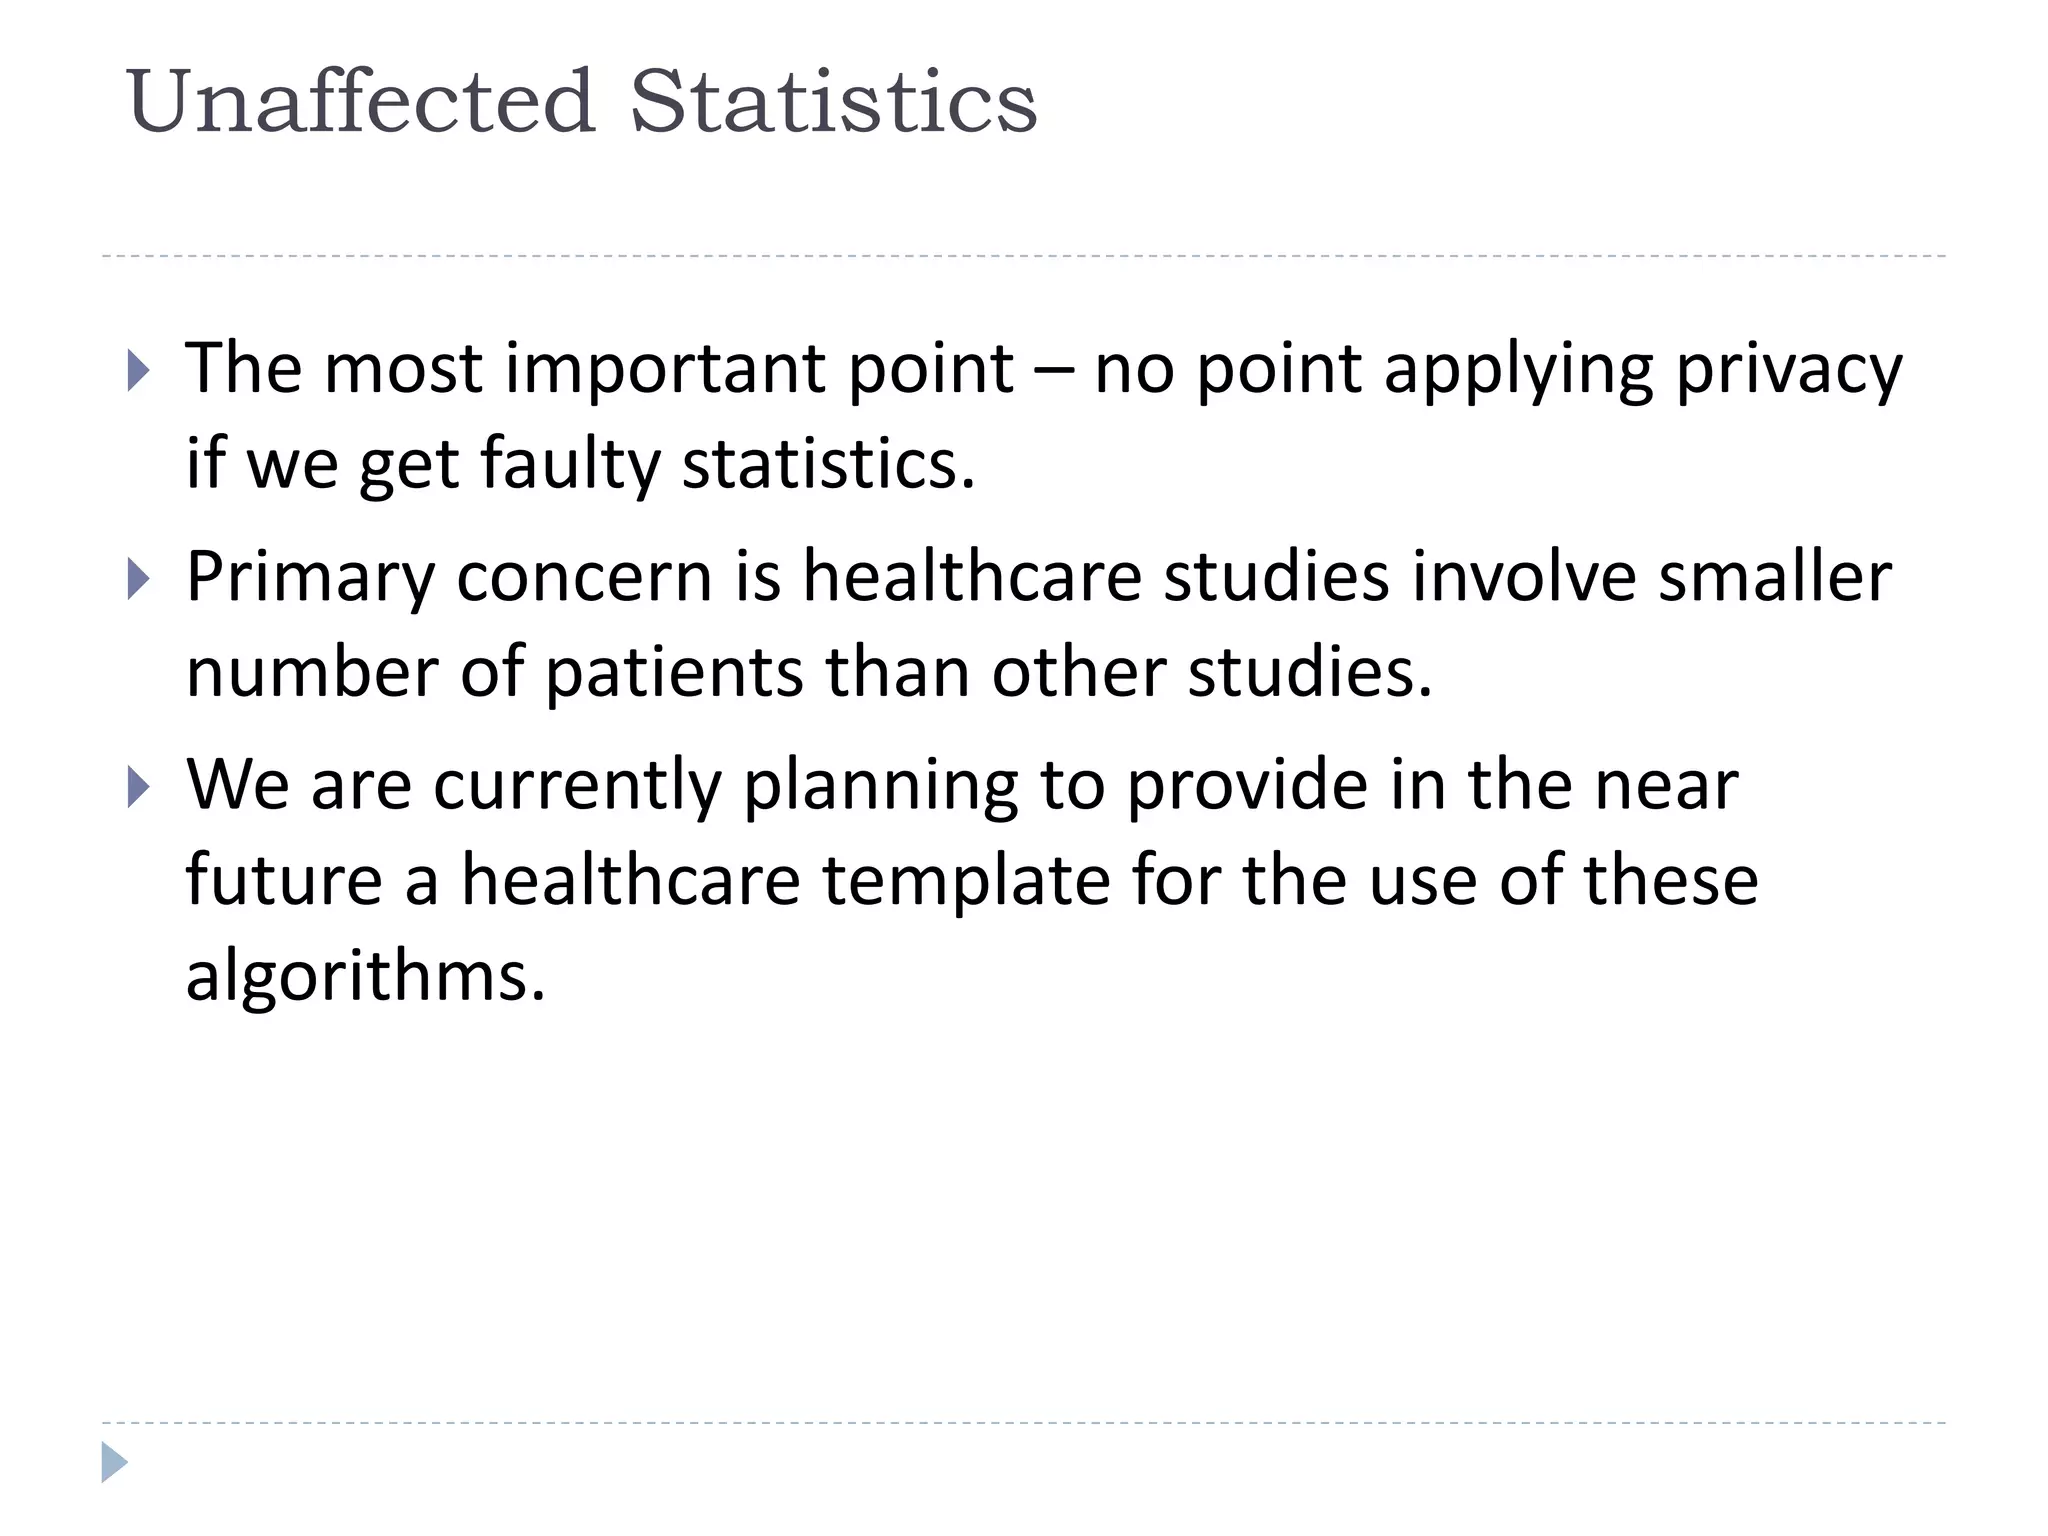
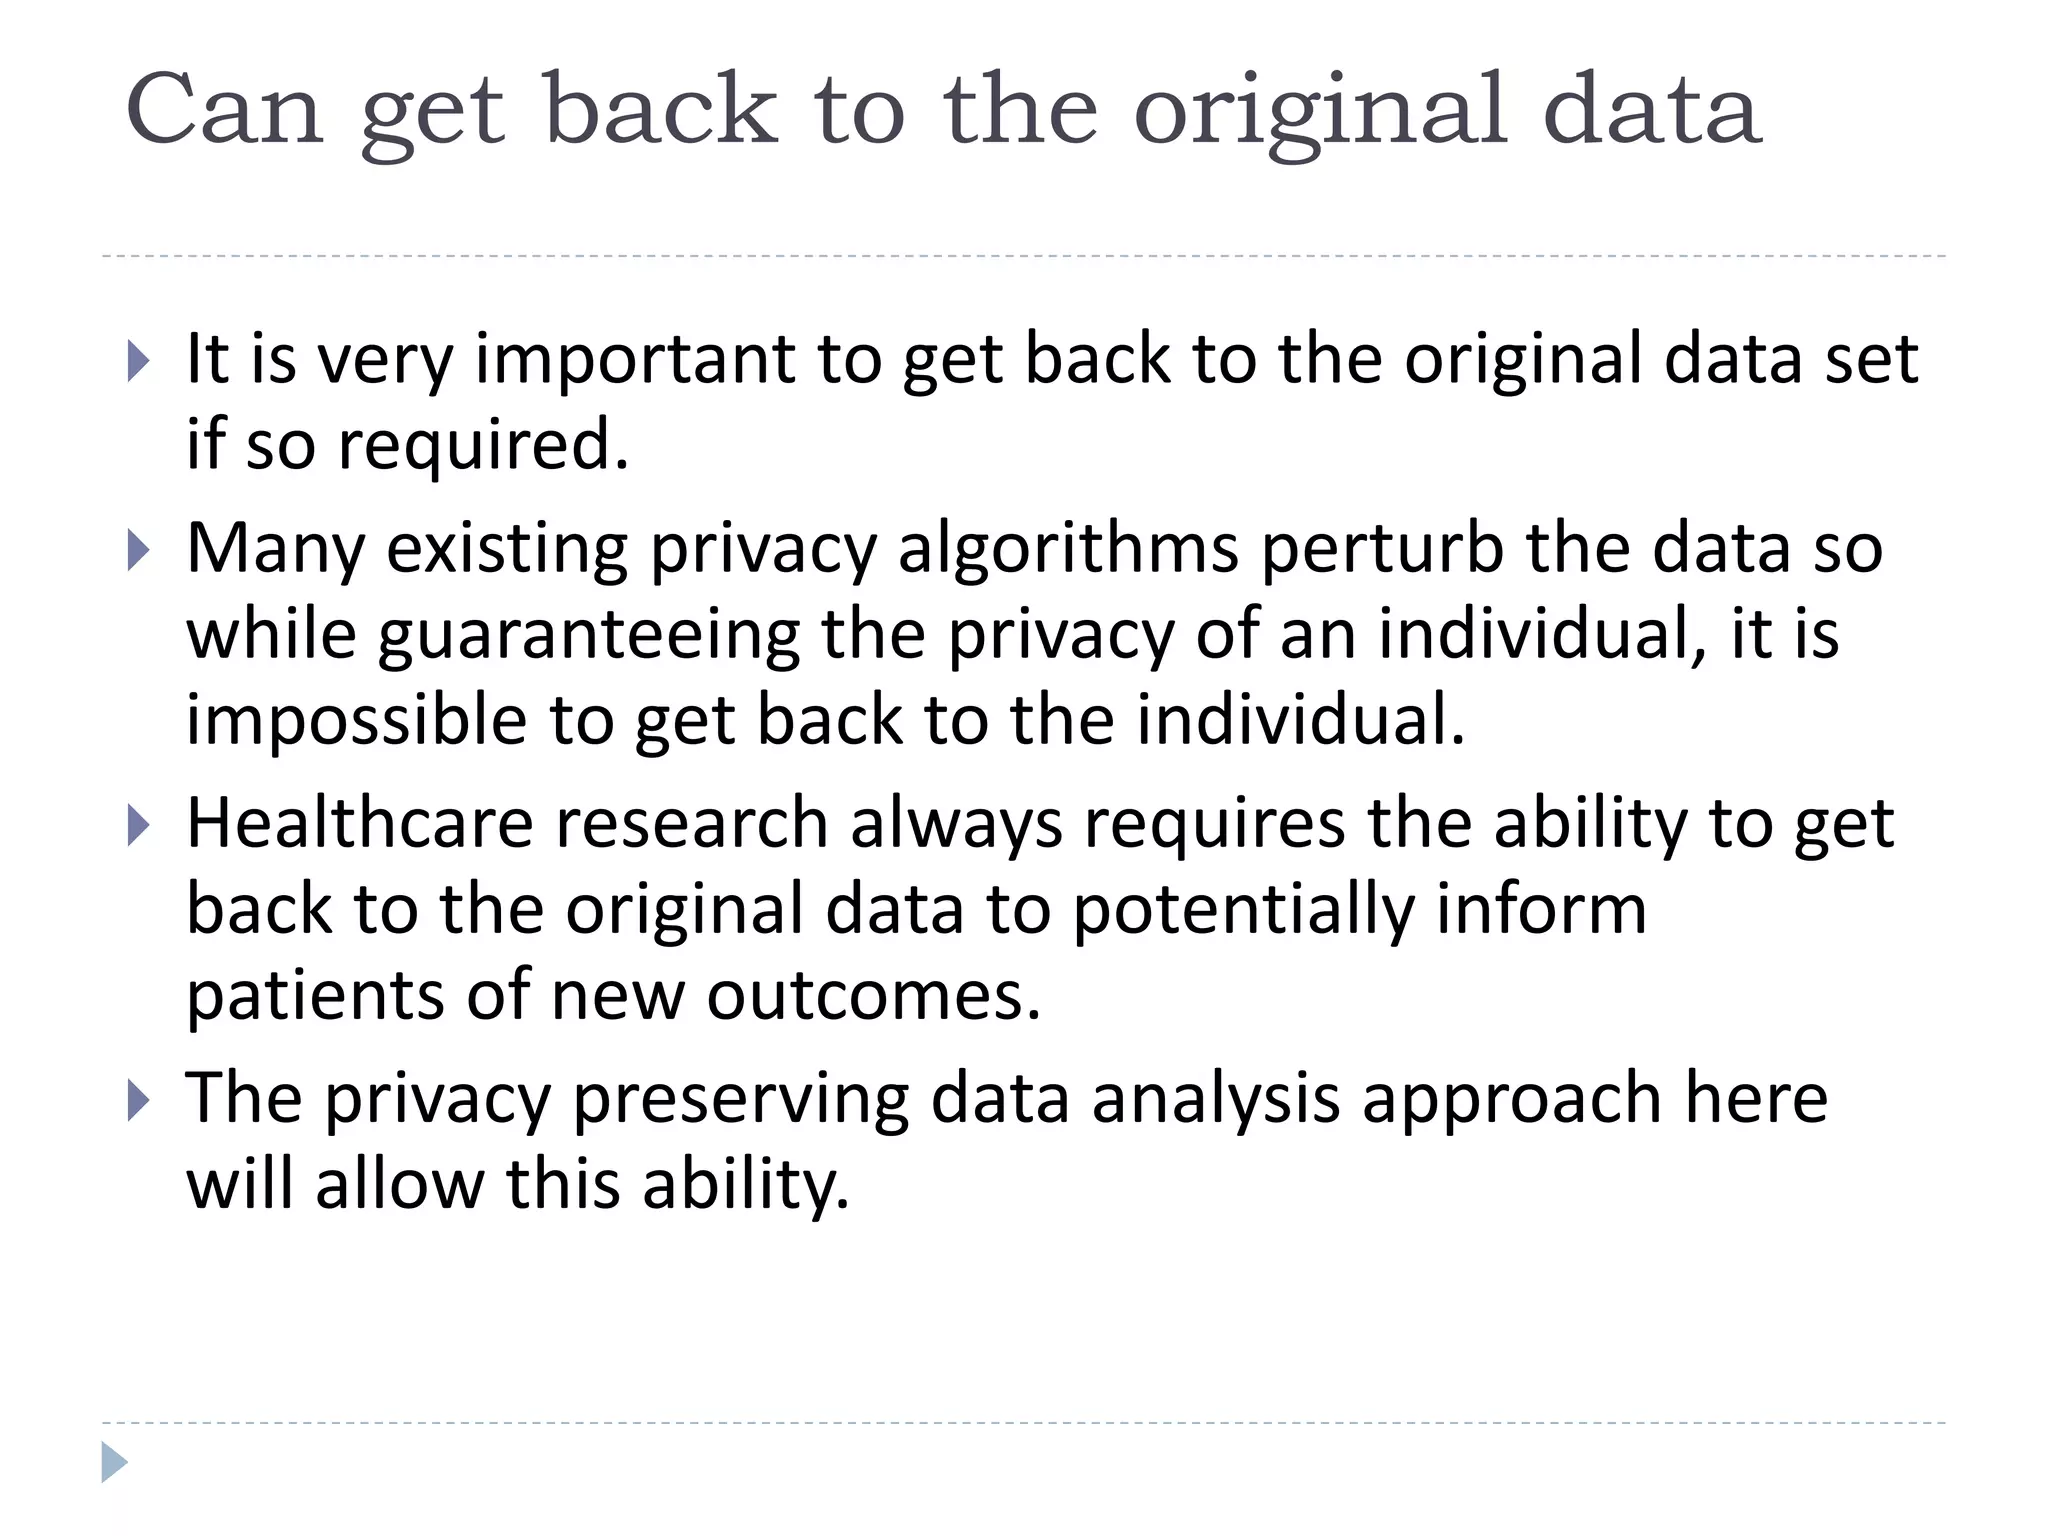
This document discusses case studies using differential privacy to analyze sensitive data. It describes analyzing Windows Live user data to study web analytics and customer churn. Clinical researchers' perspectives on differential privacy were also examined. Researchers wanted unaffected statistics and the ability to access original data if needed. Future collaboration with OHSU aims to develop a healthcare template for applying differential privacy.
At a time when the risks and costs associated with privacy are on the rise, differential privacy offers a solution. Differential privacy is mathematical definition for the privacy loss that results to individuals when their private information is used to create an AI product. It can be used to build customer trust, making those customers more likely to share their data with you. This slideshare will help you get a concise explanation of what differential privacy is, how it works, and how you can use it to help your company improve your machine learning models and overcome the cold-start problem.
To cope with privacy laws, big data players face a new need: synthetic data.
At Real Impact Analytics, we specialize in modelling telecom data. Here is how we created our own synthetic data generator.
website realimpactanalytics.com
email info@realimpactanalytics.com
Data quality - The True Big Data ChallengeStefan Kühn
Data Quality is one of the most-overlooked key aspect in any Big Data project or approach. This talk adresses the problem from various perspectives, discusses the main challenges and identifies possible solutions.
Vendor-neutral presentation about the common functionality provided by data profiling tools, which can help automate some of the work needed to begin your preliminary data analysis.
Paradigm4 Research Report: Leaving Data on the tableParadigm4
While Big Data enjoys widespread media coverage, not enough attention has been paid to what practitioners think — data scientists who manage and analyze massive volumes of data. We wanted to know, so Paradigm4 teamed up with Innovation Enterprise to ask over 100 data scientists for their help separating Big Data hype from reality. What we learned is that data scientists face multiple challenges achieving their company’s analytical aspirations. The upshot is that businesses are leaving data — and money — on the table.
Hello everyone! Data is required for every organisation in every field in today's world, and personal life. so, I am here to introduce how about What is Data and What is large scale computing.
A brief introduction to Data Quality rule development and implementation covering:
- What are Data Quality Rules.
- Examples of Data Quality Rules.
- What are the benefits of rules.
- How can I create my own rules?
- What alternate approaches are there to building my own rules?
The presentation also includes a very brief overview of our Data Quality Rule services. For more information on this please contact us.
Data Analytics For Beginners | Introduction To Data Analytics | Data Analytic...Edureka!
Data Analytics for R Course: https://www.edureka.co/r-for-analytics
This Edureka Tutorial on Data Analytics for Beginners will help you learn the various parameters you need to consider while performing data analysis.
The following are the topics covered in this session:
Introduction To Data Analytics
Statistics
Data Cleaning and Manipulation
Data Visualization
Machine Learning
Roles, Responsibilities and Salary of Data Analyst
Need of R
Hands-On
Statistics for Data Science: https://youtu.be/oT87O0VQRi8
Follow us to never miss an update in the future.
Instagram: https://www.instagram.com/edureka_learning/
Facebook: https://www.facebook.com/edurekaIN/
Twitter: https://twitter.com/edurekain
LinkedIn: https://www.linkedin.com/company/edureka
Machine Learning (ML) for Fraud Detection.
- fraud is a big problem (big data, big cost)
- ML on bigger data produces better results
- Industry standard today (for detecting fraud)
- How to improve fraud detection!
We explain how we use Grakn as part of a wider solution to deliver next generation Data Operations (Data Ops) tooling, enabling us to deliver sophisticated "Run Graph Analytics".
The Run Graph is a component to passively track and trace our data assets as they move across the organisation, and is used to quickly reverse engineer our global flows of data to better plan change and understand hidden dependencies. When operational failures do arise, we demonstrate how Grakn quickly allows us to assess the inferred impacts downstream, and to prioritise and communicate the impacts of outages to stakeholders.
Data Quality: The Data Science struggle nobody mentions - Data Science MeetUp...University of Twente
Presentation about data quality at the second Data Science MeetUp Twente https://www.meetup.com/Data-Meetup-Twente/events/241545781/ on "Responsible Data Analytics", 7 Sep 2017.
When Big Data and Predictive Analytics Collide: Visual Magic HappensChase McMichael
Big data is useless data unless you have a way to handle and perform meaningful analysis that drives a business outcome. Data visualization has transformed complex data sets into patterns now being used to constructed predictive models. In the massive exploding world of social data and content engagement the need for intelligent data mining and pattern prediction is required to realize data driving marketing. In this presentation, we will explore techniques, key takeaways and examples behind this fast growing market of predictive https://svforum.org/Business-Intelligence/Business-Intelligence-SIG-When-Big-Data-and-Predictive-Analytics-Collide SEE Dreamforce Content Hub in ACTION here http://blog.infinigraph.com/example-of-visual-content-trends-powered-by-hypercuration/
Introduction to Data Science (Data Summit, 2017)Caserta
At DBTA's 2017 Data Summit in New York, NY, Caserta Founder & President, Joe Caserta, and Senior Architect, Bill Walrond, gave a pre-conference workshop presenting the ins and outs of data science. Data scientist has been dubbed the "sexiest" job of the 21st century, but it requires an understanding of many different elements of data analysis. This presentation dives into the fundamentals of data exploration, mining, and preparation, applying the principles of statistical modeling and data visualization in real-world applications.
This presentation briefly explains the following topics:
Why is Data Analytics important?
What is Data Analytics?
Top Data Analytics Tools
How to Become a Data Analyst?
Differential Privacy Preservation for Deep Auto-EncodersNhatHai Phan
Preserve differential privacy for deep learning, particularly deep auto-encoders. An application of human behavior prediction in health social network.
Introduction to homomorphic encryption, encryption which allows computations on ciphertext. An overview of key aspects and the ideas that allow these schemes to work is given, as well as examples of how to apply it.
Christoph Matthies (@chrisma0), Hubert Hesse (@hubx), Robert Lehmann (@rlehmann)
Running title TRENDS IN COMPUTER INFORMATION SYSTEMS1TRENDS I.docxanhlodge
Running title: TRENDS IN COMPUTER INFORMATION SYSTEMS 1
TRENDS IN COMPUTER INFORMATION SYSTEMS 4
Trends in Computer Information Systems, and the Rise to Business Intelligence
Shad Martin
School for Professional Studies
St. Louis University
ENG 2005 Dr. Rebecca Wood
November 23, 2016
Introduction
Our quest to increase our knowledge of Computer Information Systems has produced a number of benefits to humanity. The innovation humans have discovered in Computer Information Systems has led to new sub-areas of study for students and professionals to continue their progression to master all that Computer Information Systems has to offer. Amy Web of the Harvard Business Review reported 8 Tech Trends to Watch in 2016, She noted, “In order to chart the best way forward, you must understand emerging trends: what they are, what they aren’t, and how they operate. Such trends are more than shiny objects; they’re manifestations of sustained changes within an industry sector, society, or human behavior. Trends are a way of seeing and interpreting our current reality, providing a useful framework to organize our thinking, especially when we’re hunting for the unknown. Fads pass. Trends help us forecast the future” (Harvard Business Review, 2015). In short, Amy’s reference to understanding the emerging trends in Computer Information can provide a framework from which, students, professionals, and scientists to conscientiously create a path towards optimizing their efforts. Ensuring we have a fundamental approach to analyze data will enhance our understanding of this subject further.
In this paper I will expound on three of the top trends used to provide insight into the data produced from the advancements in Computer Information Systems. These trends or methods are taking place in my workplace within a financial institution, and in many other industries. It is important to note this paper does not provide an inclusive list of all methodologies that exist. Individuals can now leverage analytics to synthesize insights from data to identify emerging risk, manage operational risks, identify trends, improve compliance, and customer satisfaction. Data in and by itself is not always useful. Regardless of the data source, trained professional must understand the best approach to structure the data to make it more useful. In this paper, I will touch on three popular methodology trends occurring in Computer Information Systems. Students and professionals who work with large data would benefit from having a solid understanding of the fundamental principles of Business Intelligence as data scientific approach and when to use these methodologies.
The rise of Business Intelligence
Computer Information Systems allow many companies to gather and generate large amounts of data on their customers, business activities, potential merger targets, and risks found in their organization. These large sets of data have given rise to vari.
Big Data Risks and Rewards (good length and at least 3-4 references .docxtangyechloe
Big Data Risks and Rewards (good length and at least 3-4 references everything in APA 7 format)
When you wake in the morning, you may reach for your cell phone to reply to a few text or email messages that you missed overnight. On your drive to work, you may stop to refuel your car. Upon your arrival, you might swipe a key card at the door to gain entrance to the facility. And before finally reaching your workstation, you may stop by the cafeteria to purchase a coffee.
From the moment you wake, you are in fact a data-generation machine. Each use of your phone, every transaction you make using a debit or credit card, even your entrance to your place of work, creates data. It begs the question: How much data do you generate each day? Many studies have been conducted on this, and the numbers are staggering: Estimates suggest that nearly 1 million bytes of data are generated every second for every person on earth.
As the volume of data increases, information professionals have looked for ways to use big data—large, complex sets of data that require specialized approaches to use effectively. Big data has the potential for significant rewards—and significant risks—to healthcare. In this Discussion, you will consider these risks and rewards.
To Prepare:
Review the Resources and reflect on the web article
Big Data Means Big Potential, Challenges for Nurse Execs
.
Reflect on your own experience with complex health information access and management and consider potential challenges and risks you may have experienced or observed.
By Day 3 of Week 5
Post
a description of at least one potential benefit of using big data as part of a clinical system and explain why. Then, describe at least one potential challenge or risk of using big data as part of a clinical system and explain why. Propose at least one strategy you have experienced, observed, or researched that may effectively mitigate the challenges or risks of using big data you described. Be specific and provide examples.
By Day 6 of Week 5
Respond
to at least
two
of your colleagues
* on two different days
, by offering one or more additional mitigation strategies or further insight into your colleagues’ assessment of big data opportunities and risks.
Click on the
Reply
button below to reveal the textbox for entering your message. Then click on the
Submit
button to post your message.
*Note:
Throughout this program, your fellow students are referred to as colleagues.
Michea Discussion ( in APA 7 format and at least 2-3 references)
With the fast growing pace of technological advancement in the health care sector, daily operations of the institution helps generate millions of data that over time needs proper channels of transmission, storage, processing, assimilation and utilization. Following from the vast amount of data generated, some of its benefits includes but is not limited to functioning as a pattern discovery aid with relation to the amount of variance or similarity in .
Big data analytics and its impact on internet usersStruggler Ever
Big Data Analytic tools are promising techniques for a future prediction in many aspects of our life. The need for such predictive techniques has been exponentially increasing. even though, there are many challenges and risks are still of concern of researchers and decision makers, the outcome from the use of these techniques will considerable revolutionize our world to a new era of technology.
1. Patient Safety is a health care professionals’ duty. A sur.docxSONU61709
1. Patient Safety is a health care professionals’ duty. A surgical team’s duty is the “…functioning of the unit and provide safety and well-being to the person who will submit to a surgical procedure” (Ventin Amorim Oliveira, Nunes Oliveira, Guedes Fontoura, et al, 2017). Surgical and treatment errors occur due to underlying causes. For instance, the failure to properly sterilize medical instruments following surgeries. Porter Adventist Hospital in Denver have notified some patients whom have been exposed to HIV, hepatitis B or hepatitis C in breaches that occurred during the time frame of July 21, 2016 and February 20th (CNN Wire, 2018).
2. Due to this error, stakeholders that were affected were the possible affected patients. The article from CNN Wire stated that the surgeries were “…found to be inadequate, which may have compromised the sterilization of the instruments” (CNN Wire, 2018). Highest risk is in hospital surgical rooms at which, “In patients who went through surgical interventions, 14-17% all hospital-acquired infections are comprised of “Surgical Area Infections”” (Ay & Gencturk, 2018). Due to the complex environments of hospitals and operating rooms, preventative factors must be to follow protocols and assure patients that they are in a safe environment to undergo the surgical procedures.
3. What information is needed to perform a root cause analysis?
Quality improvement involves numerous perspectives to detect root causes and develop optimum solutions for triumph. “A root cause analysis is used to find out what happened, why it happened, and determine what changes need to be made to improve performance” (U.S. Department of Veterans Affairs, 2018). Several pieces of information are required to perform a root cause analysis. Some of the information that might be helpful consists of “incident reports, risk management referrals, patient or family complaints, and health department citations” (Centers for Medicare & Medicaid Services, 2011). Collecting data helps prove there is a problem and helps determine how long the problem has existed, as well as how it has impacted the organization.
4. Which tool would you use to create a root cause analysis? Why?
“Root cause analysis is increasingly being used in health and social services to improve safety and quality and minimize adverse events” (Pearson, 2005). The tool that would best work to create a root cause analysis would be a cause and effect chart such as a fishbone analysis. “This process elicits root causes rather than just symptoms and results in a detailed visual diagram of all the possible causes of a particular problem” (Phillips & Simmonds, 2013). The reason a fishbone analysis would be used to create a root cause analysis is because it helps explore the issue in detail, which often will demonstrate possible solutions that might have been previously excluded. “Fishbone analysis provides a template to separate and categorize possible causes of a probl ...
Big Data Analytics: Challenges And Applications For Text, Audio, Video, And S...IJSCAI Journal
All types of machine automated systems are generating large amount of data in different forms like
statistical, text, audio, video, sensor, and bio-metric data that emerges the term Big Data. In this paper we
are discussing issues, challenges, and application of these types of Big Data with the consideration of big
data dimensions. Here we are discussing social media data analytics, content based analytics, text data
analytics, audio, and video data analytics their issues and expected application areas. It will motivate
researchers to address these issues of storage, management, and retrieval of data known as Big Data. As
well as the usages of Big Data analytics in India is also highlighted
BIG DATA ANALYTICS: CHALLENGES AND APPLICATIONS FOR TEXT, AUDIO, VIDEO, AND S...gerogepatton
All types of machine automated systems are generating large amount of data in different forms likestatistical, text, audio, video, sensor, and bio-metric data that emerges the term Big Data. In this paper weare discussing issues, challenges, and application of these types of Big Data with the consideration of bigdata dimensions. Here we are discussing social media data analytics, content based analytics, text dataanalytics, audio, and video data analytics their issues and expected application areas. It will motivateresearchers to address these issues of storage, management, and retrieval of data known as Big Data. Aswell as the usages of Big Data analytics in India is also highlighted.
BIG DATA ANALYTICS: CHALLENGES AND APPLICATIONS FOR TEXT, AUDIO, VIDEO, AND S...ijscai
All types of machine automated systems are generating large amount of data in different forms like
statistical, text, audio, video, sensor, and bio-metric data that emerges the term Big Data. In this paper we
are discussing issues, challenges, and application of these types of Big Data with the consideration of big
data dimensions. Here we are discussing social media data analytics, content based analytics, text data
analytics, audio, and video data analytics their issues and expected application areas. It will motivate
researchers to address these issues of storage, management, and retrieval of data known as Big Data. As
well as the usages of Big Data analytics in India is also highlighted.
BIG DATA ANALYTICS: CHALLENGES AND APPLICATIONS FOR TEXT, AUDIO, VIDEO, AND S...gerogepatton
All types of machine automated systems are generating large amount of data in different forms likestatistical, text, audio, video, sensor, and bio-metric data that emerges the term Big Data. In this paper weare discussing issues, challenges, and application of these types of Big Data with the consideration of bigdata dimensions. Here we are discussing social media data analytics, content based analytics, text dataanalytics, audio, and video data analytics their issues and expected application areas. It will motivateresearchers to address these issues of storage, management, and retrieval of data known as Big Data. Aswell as the usages of Big Data analytics in India is also highlighted.
BIG DATA ANALYTICS: CHALLENGES AND APPLICATIONS FOR TEXT, AUDIO, VIDEO, AND S...ijscai
All types of machine automated systems are generating large amount of data in different forms like
statistical, text, audio, video, sensor, and bio-metric data that emerges the term Big Data. In this paper we
are discussing issues, challenges, and application of these types of Big Data with the consideration of big
data dimensions. Here we are discussing social media data analytics, content based analytics, text data
analytics, audio, and video data analytics their issues and expected application areas. It will motivate
researchers to address these issues of storage, management, and retrieval of data known as Big Data. As
well as the usages of Big Data analytics in India is also highlighted.
Azure Cosmos DB: Globally Distributed Multi-Model Database ServiceDenny Lee
Azure Cosmos DB is the industry's first globally distributed multi-model database service. Features of Cosmos DB include turn-key global distribution, elastic throughput and storage, multiple consistency models, and financially backed SLAs. As well, we are in preview for Table, Graph, and Spark Connector to Cosmos DB. Also includes healthcare scenarios!
This presentation provides an introduction to Azure DocumentDB. Topics include elastic scale, global distribution and guaranteed low latencies (with SLAs) - all in a managed document store that you can query using SQL and Javascript. We also review common scenarios and advanced Data Sciences scenarios.
SQL Server Integration Services Best PracticesDenny Lee
This is Thomas Kejser and my presentation at the Microsoft Business Intelligence Conference 2008 (October 2008) on SQL Server Integration Services Best Practices
SQL Server Reporting Services: IT Best PracticesDenny Lee
This is Lukasz Pawlowski and my presentation at the Microsoft Business Intelligence Conference 2008 (October 2008) on SQL Server Reporting Services: IT Best Practices
Introduction to Microsoft's Big Data Platform and Hadoop PrimerDenny Lee
This is my 24 Hour of SQL PASS (September 2012) presentation on Introduction to Microsoft's Big Data Platform and Hadoop Primer. All known as Project Isotope and HDInsight.
SQL Server Reporting Services Disaster Recovery webinarDenny Lee
This is the PASS DW|BI virtual chapter webinar on SQL Server Reporting Services Disaster Recovery with Ayad Shammout and myself - hosted by Julie Koesmarno (@mssqlgirl)
Building and Deploying Large Scale SSRS using Lessons Learned from Customer D...Denny Lee
This is Lukasz Pawlowski and my 2007 SQL PASS Summit presentation on building and deploying large scale SSRS using lessons learned from customer deployments
Designing, Building, and Maintaining Large Cubes using Lessons LearnedDenny Lee
This is Nicholas Dritsas, Eric Jacobsen, and my 2007 SQL PASS Summit presentation on designing, building, and maintaining large Analysis Services cubes
Jump Start into Apache Spark (Seattle Spark Meetup)Denny Lee
Denny Lee, Technology Evangelist with Databricks, will demonstrate how easily many Data Sciences and Big Data (and many not-so-Big Data) scenarios easily using Apache Spark. This introductory level jump start will focus on user scenarios; it will be demo heavy and slide light!
How Concur uses Big Data to get you to Tableau Conference On TimeDenny Lee
This is my presentation from Tableau Conference #Data14 as the Cloudera Customer Showcase - How Concur uses Big Data to get you to Tableau Conference On Time. We discuss Hadoop, Hive, Impala, and Spark within the context of Consolidation, Visualization, Insight, and Recommendation.
SQL Server Reporting Services Disaster Recovery WebinarDenny Lee
This is the PASS DW/BI Webinar for SQL Server Reporting Services (SSRS) Disaster Recovery webinar. You can find the video at: http://www.youtube.com/watch?v=gfT9ETyLRlA
DevOps and Testing slides at DASA ConnectKari Kakkonen
My and Rik Marselis slides at 30.5.2024 DASA Connect conference. We discuss about what is testing, then what is agile testing and finally what is Testing in DevOps. Finally we had lovely workshop with the participants trying to find out different ways to think about quality and testing in different parts of the DevOps infinity loop.
Transcript: Selling digital books in 2024: Insights from industry leaders - T...BookNet Canada
The publishing industry has been selling digital audiobooks and ebooks for over a decade and has found its groove. What’s changed? What has stayed the same? Where do we go from here? Join a group of leading sales peers from across the industry for a conversation about the lessons learned since the popularization of digital books, best practices, digital book supply chain management, and more.
Link to video recording: https://bnctechforum.ca/sessions/selling-digital-books-in-2024-insights-from-industry-leaders/
Presented by BookNet Canada on May 28, 2024, with support from the Department of Canadian Heritage.
Generating a custom Ruby SDK for your web service or Rails API using Smithyg2nightmarescribd
Have you ever wanted a Ruby client API to communicate with your web service? Smithy is a protocol-agnostic language for defining services and SDKs. Smithy Ruby is an implementation of Smithy that generates a Ruby SDK using a Smithy model. In this talk, we will explore Smithy and Smithy Ruby to learn how to generate custom feature-rich SDKs that can communicate with any web service, such as a Rails JSON API.
UiPath Test Automation using UiPath Test Suite series, part 4DianaGray10
Welcome to UiPath Test Automation using UiPath Test Suite series part 4. In this session, we will cover Test Manager overview along with SAP heatmap.
The UiPath Test Manager overview with SAP heatmap webinar offers a concise yet comprehensive exploration of the role of a Test Manager within SAP environments, coupled with the utilization of heatmaps for effective testing strategies.
Participants will gain insights into the responsibilities, challenges, and best practices associated with test management in SAP projects. Additionally, the webinar delves into the significance of heatmaps as a visual aid for identifying testing priorities, areas of risk, and resource allocation within SAP landscapes. Through this session, attendees can expect to enhance their understanding of test management principles while learning practical approaches to optimize testing processes in SAP environments using heatmap visualization techniques
What will you get from this session?
1. Insights into SAP testing best practices
2. Heatmap utilization for testing
3. Optimization of testing processes
4. Demo
Topics covered:
Execution from the test manager
Orchestrator execution result
Defect reporting
SAP heatmap example with demo
Speaker:
Deepak Rai, Automation Practice Lead, Boundaryless Group and UiPath MVP
Slack (or Teams) Automation for Bonterra Impact Management (fka Social Soluti...Jeffrey Haguewood
Sidekick Solutions uses Bonterra Impact Management (fka Social Solutions Apricot) and automation solutions to integrate data for business workflows.
We believe integration and automation are essential to user experience and the promise of efficient work through technology. Automation is the critical ingredient to realizing that full vision. We develop integration products and services for Bonterra Case Management software to support the deployment of automations for a variety of use cases.
This video focuses on the notifications, alerts, and approval requests using Slack for Bonterra Impact Management. The solutions covered in this webinar can also be deployed for Microsoft Teams.
Interested in deploying notification automations for Bonterra Impact Management? Contact us at sales@sidekicksolutionsllc.com to discuss next steps.
Epistemic Interaction - tuning interfaces to provide information for AI supportAlan Dix
Paper presented at SYNERGY workshop at AVI 2024, Genoa, Italy. 3rd June 2024
https://alandix.com/academic/papers/synergy2024-epistemic/
As machine learning integrates deeper into human-computer interactions, the concept of epistemic interaction emerges, aiming to refine these interactions to enhance system adaptability. This approach encourages minor, intentional adjustments in user behaviour to enrich the data available for system learning. This paper introduces epistemic interaction within the context of human-system communication, illustrating how deliberate interaction design can improve system understanding and adaptation. Through concrete examples, we demonstrate the potential of epistemic interaction to significantly advance human-computer interaction by leveraging intuitive human communication strategies to inform system design and functionality, offering a novel pathway for enriching user-system engagements.
State of ICS and IoT Cyber Threat Landscape Report 2024 previewPrayukth K V
The IoT and OT threat landscape report has been prepared by the Threat Research Team at Sectrio using data from Sectrio, cyber threat intelligence farming facilities spread across over 85 cities around the world. In addition, Sectrio also runs AI-based advanced threat and payload engagement facilities that serve as sinks to attract and engage sophisticated threat actors, and newer malware including new variants and latent threats that are at an earlier stage of development.
The latest edition of the OT/ICS and IoT security Threat Landscape Report 2024 also covers:
State of global ICS asset and network exposure
Sectoral targets and attacks as well as the cost of ransom
Global APT activity, AI usage, actor and tactic profiles, and implications
Rise in volumes of AI-powered cyberattacks
Major cyber events in 2024
Malware and malicious payload trends
Cyberattack types and targets
Vulnerability exploit attempts on CVEs
Attacks on counties – USA
Expansion of bot farms – how, where, and why
In-depth analysis of the cyber threat landscape across North America, South America, Europe, APAC, and the Middle East
Why are attacks on smart factories rising?
Cyber risk predictions
Axis of attacks – Europe
Systemic attacks in the Middle East
Download the full report from here:
https://sectrio.com/resources/ot-threat-landscape-reports/sectrio-releases-ot-ics-and-iot-security-threat-landscape-report-2024/
2. Case Studies
Quantitative Case Study:
Windows Live / MSN Web Analytics data
Qualitative Case Study:
Clinical Physicians Perspective
Future Study
OHSU/CORI data set to apply differential privacy to
Healthcare setting
3. Sanitization Concept
Mask individuals within the data by creating a sanitization
point between user interface and data.
The magnitude of the noise is given by the theorem. If many
queries f1, f2, … are to be made, noise proportional to ΣiΔfi
suffices. For many sequences, we can often use less noise
than ΣiΔfi . Note that Δ Histogram = 1, independent of
number of cells
6/3/2016
4. Generating the noise
To generate the noise, a pseudo-random number
generator will create a stream of numbers, e.g.:
The resulting translation of this stream is:
0 0 1 1 1 … 1 0 0 0 0 1
- . 2 + 1 … + . . . . 6
6/3/2016
5. Adding noise
Category Value
A 36
B 22
… …
N 102
Category Value
A 34
B 23
… …
N 108
noise
6/3/2016
• The stream of numbers above is applied
to the result set.
• While masking the individuals, it allows
accurate percentages and trending.
• Presuming the magnitude is small (i.e.
small error), the numbers are
themselves accurate within an
acceptable margin.
6. Windows Live User Data
Our initial case study is based on Windows Live
user data:
550 million Passport users
Passport has web site visitor self-reported data: gender, birth
date, occupation, country, zip code, etc.
Web data has: IP address, pages viewed, page view duration,
browser, operating system, etc.
Created two groups for this case study to study the
acceptability / applicability of differential privacy within
the WL reporting context:
WL Sampled Users Web Analytics
Customer Churn Analytics
8. Sampled Users Web Analytics
Group
New solution built on top of an existing Windows
Live web analytics solution to provide a sample
specific to Passport users.
Built on top of an OLAP database to provide analysts
to view the data from multiple dimensions.
Built as well to showcase the privacy preserving
histogram for various teams including Channels,
Search, and Money.
9. Web Analytics Group Feedback
Country Visitors
United States 202
Canada 31
Country Gender Visitors
United States Female 128
Male 75
Total 203
Canada Female 15
Male 15
Total 30
Feedback was negative because customers
could not accept any amount of error.
This group had been using reporting
systems for over two years that had
perceived accuracy issues.
They were adamant that all of the totals
matched; the difference on the right was
not acceptable even though this data was
not used for financial reconciliation.
10. Customer Churn Analysis
Group
This reporting solution provided an OLAP cube, based on an
existing targeted marketing system, to allow analysts to
understand how services (Messenger, Mail, Search, Spaces,
etc.) are being used.
A key difference between the groups is that this group did not
have access to any reporting (though it was requested for
many months).
Within a few weeks of their initial request, CCA customers
received a working beta in which they were able to interact,
validate, and provide feedback to the precision and accuracy
of the data.
11. Discussion
The collaborative effort lead to the customer
trusting the data, a key difference in comparison to
the first group.
Because of this trust, the small amount of error
introduced into the system to ensure customer
privacy was well within a tolerable error margin.
The CCA group is in direct marketing hence had to
deal more regularly with customer privacy.
12. An important component to the
acceptance of privacy algorithms is
the users’ trust of the data.
13. Clinical Researchers Perceptions
A pilot qualitative study on the perceptions of clinical
researchers was recently completed.
It has noted three categories of six themes:
Unaffected Statistics
Understanding the privacy algorithms
Can get back to the original data
Understanding the purpose of the privacy algorithms
Management ROI
Protecting Patient Privacy
14. Unaffected Statistics
The most important point – no point applying privacy
if we get faulty statistics.
Primary concern is healthcare studies involve smaller
number of patients than other studies.
We are currently planning to provide in the near
future a healthcare template for the use of these
algorithms.
15. Understanding the privacy algorithms
As we have done in these slides, we have described
the mathematics behind these algorithms only
briefly.
But most clinical researchers are willing to accept the
science behind them without necessarily
understanding them.
While this is good, it does pose the problem that one
will implement them w/o understanding them
incorrectly guaranteeing the privacy of patients.
16. Can get back to the original data
It is very important to get back to the original data set
if so required.
Many existing privacy algorithms perturb the data so
while guaranteeing the privacy of an individual, it is
impossible to get back to the individual.
Healthcare research always requires the ability to get
back to the original data to potentially inform
patients of new outcomes.
The privacy preserving data analysis approach here
will allow this ability.
17. Understand the purpose of the privacy
algorithms
Most educated healthcare professionals understand
the issues and providing case studies such as the Gov
Weld case make this more apparent.
But we will still want to provide well-worded text
and/or confidence intervals below a chart or report
that has privacy algorithms applied.
18. Management ROI
We should be limiting the number of users who need
access to full data. So is there a good return-on-
investment to provide this extra step if you can
securely authorize the right people to access this
data?
This is where standards from IRB, privacy & security
steering committees, and the government get
involved.
Most importantly: the ability to share data.
19. Protecting Patient Privacy
For us to be able to analyze and mine
medical data so we can help patients
as well as lower the costs of
healthcare, we must first ensure
patient privacy.
20. Future Collaboration
As noted above, we are currently working with OHSU
to build a template for the application of these
privacy algorithms to healthcare.
For more information and/or interest in participating
in future application research, please email Denny
Lee at dennyl@microsoft.com.
21. Thanks
Thanks to Sally Allwardt for helping implement the
privacy preserving histogram algorithm used in this
case study.
Thanks to Kristina Behr, Lead Marketing Manager, for
all of her help and feedback with this case study.
6/3/2016
22. Practical Privacy: The SuLQ Framework
Reference paper “Practical Privacy: The SuLQ
Framework”
Conceptually, this application of privacy can be
applied to:
Principal component analysis
k means clustering
ID3 algorithm
Perceptron algorithm
Apparently, all algorithms in the statistical queries learning
model.
6/3/2016
Editor's Notes
This is based on the work of Cynthia Dwork and Frank McSherry from Microsoft Research (MSR)
A carefully detailed algorithm is definitely important, and something we have and can show folks. Aside from the addition of noise, the main snafus are a) how much noise and b) where did the randomness come from? Both are fun and exciting questions that you could have neat policy answers to, but the safe answers are: a) standard deviation equal to total number of queries and b) fresh randomness for every query. If they don't want to tell you the number of queries up front, the the standard deviation can be proportional to the square of the queries asked so far.
By doing this, this algorithm will be able to address all attacks. Consequently, for each person, the increase in probability of them being attacked (or anyone else for that matter) due to the contribution of their data is nominal. The example given is foiled for two reasons: a) the addition of noise will (formally) complicate the polynomial reconstruction and b) the number of queries is limited by the degree of privacy guaranteed, and N is generally going to be way too many queries.
The distribution used to create this noise can be Guassian because this can often work. But in order to handle all situations, we should utilize other distributions that provide more noise and/or more complicated like Laplace (Exponential) as noted in the previous slide
Windows Live User Data Application
Windows Live can use the above data to provide customizable experiences for their users and understand how visitors are using these services.
Microsoft is able to offer services like Search and Messenger at no charge to the consumer because the services are ad-funded, including ads that are targeted to be more relevant to the consumer.
As the data is accumulated, it becomes easier to segment the population and potentially better identify individual users without directly using personally identifiable information.
Potential Issues
As noted above, the Windows Live user data has enough specifics to allow us to identify a web site visitor even through the aggregations.
We need to worry about standard privacy issues:
Identity theft
Fraud
Bad press (e.g. AOL releasing search queries which ended up being revealing of their users)
If user expectations about privacy are not satisfied, consumers may no longer trust the services that we are so willing to provide.
For example, reviewing the country Afghanistan, the “Unknown” value is 121561 in one case and 121599 in another. Because of the random noise, we do not know what the “real” value is.