Download to read offline
![territory away from the capital, and religious and ethnic tensions divided both cities and rural
areas. It is almost impossible to imagine the government of the CAR halting these groups’
financing (which was largely from looting), blocking their transit (given how many areas were
controlled by the groups), or stopping the flow of weapons to them (fluid within the country
and across international borders). In other words, a weak state cannot possibly meet the
expectations of the Bush administration. Combined with the emphasis on taking action, this
is a major challenge for these states.
Three themes turned this challenge into a threat: the global scope of terrorism, the openness
to preventative attacks, and the credibility of the use of force.
The global scope of the war on terror. From its earliest days, the administration’s
war on terror was explicitly global. As early as September 2001, President Bush said that “[al-
Qaeda] and its leader - a person named Osama bin Laden - are linked to many other organiza-
tions in different countries, including the Egyptian Islamic Jihad and the Islamic Movement of
Uzbekistan. There are thousands of these terrorists in more than 60 countries.” A month later
he underscored this point, emphasizing “We are at the beginning of our efforts in Afghanistan,
but Afghanistan is only the beginning of our efforts in the world. This war will not end until
terrorists with global reach have been found and stopped and defeated.” (emphasis added)
Elsewhere in the administration, Secretary of Defense Donald Rumsfeld said “All one has
to do is read the intelligence information to know that there are a good number of people who
have been well trained. They are well financed. They are located in 40 or 50 countries. And
they are determined to attack the values and the interests and the peace and the way of life
of the [NATO] people.” Speaking before Congress in early 2003, CIA Director George Tenet
emphasized 50 lawless zones becoming hotbeds for international terrorism. The administration
was always mindful of the global nature of terrorism, and made sure its focus extended broadly.
Perspectives on Africa. Where did Africa fit into the administration’s focus? In October
2001, Condoleezza Rice (then National Security Advisor; Secretary of State during Bush’s
second term) was explicit: “Africa’s history and geography give it a pivotal role in the war on
terrorism... Africa is critical.”
As early as November 15, 2001, the House Subcommittee on Africa held a hearing on “Africa
and the War on Global Terrorism.” In his opening statement alone (less than 600 words), Chair
Ed Royce (R-CA) discussed terrorism threats emanating from eight different countries (and all
regions of Africa), including cooperation with al-Qaeda in Sierra Leone and Liberia, concerns
that Somalia and Sudan (“among other countries”) will harbor terrorists fleeing Afghanistan,
and anti-American protests in Nigeria, South Africa, Kenya, and Tanzania (“and elsewhere”)
some worried would enable recruitment of future extremists.
Preventative strikes. Afghanistan was invaded and the Taliban removed from power only
6](https://image.slidesharecdn.com/deterringungovspaces112219-191122104659/75/Did-the-War-on-Terror-Deter-Ungoverned-Spaces-Not-in-Africa-6-2048.jpg)
![5 Results
5.1 Main results
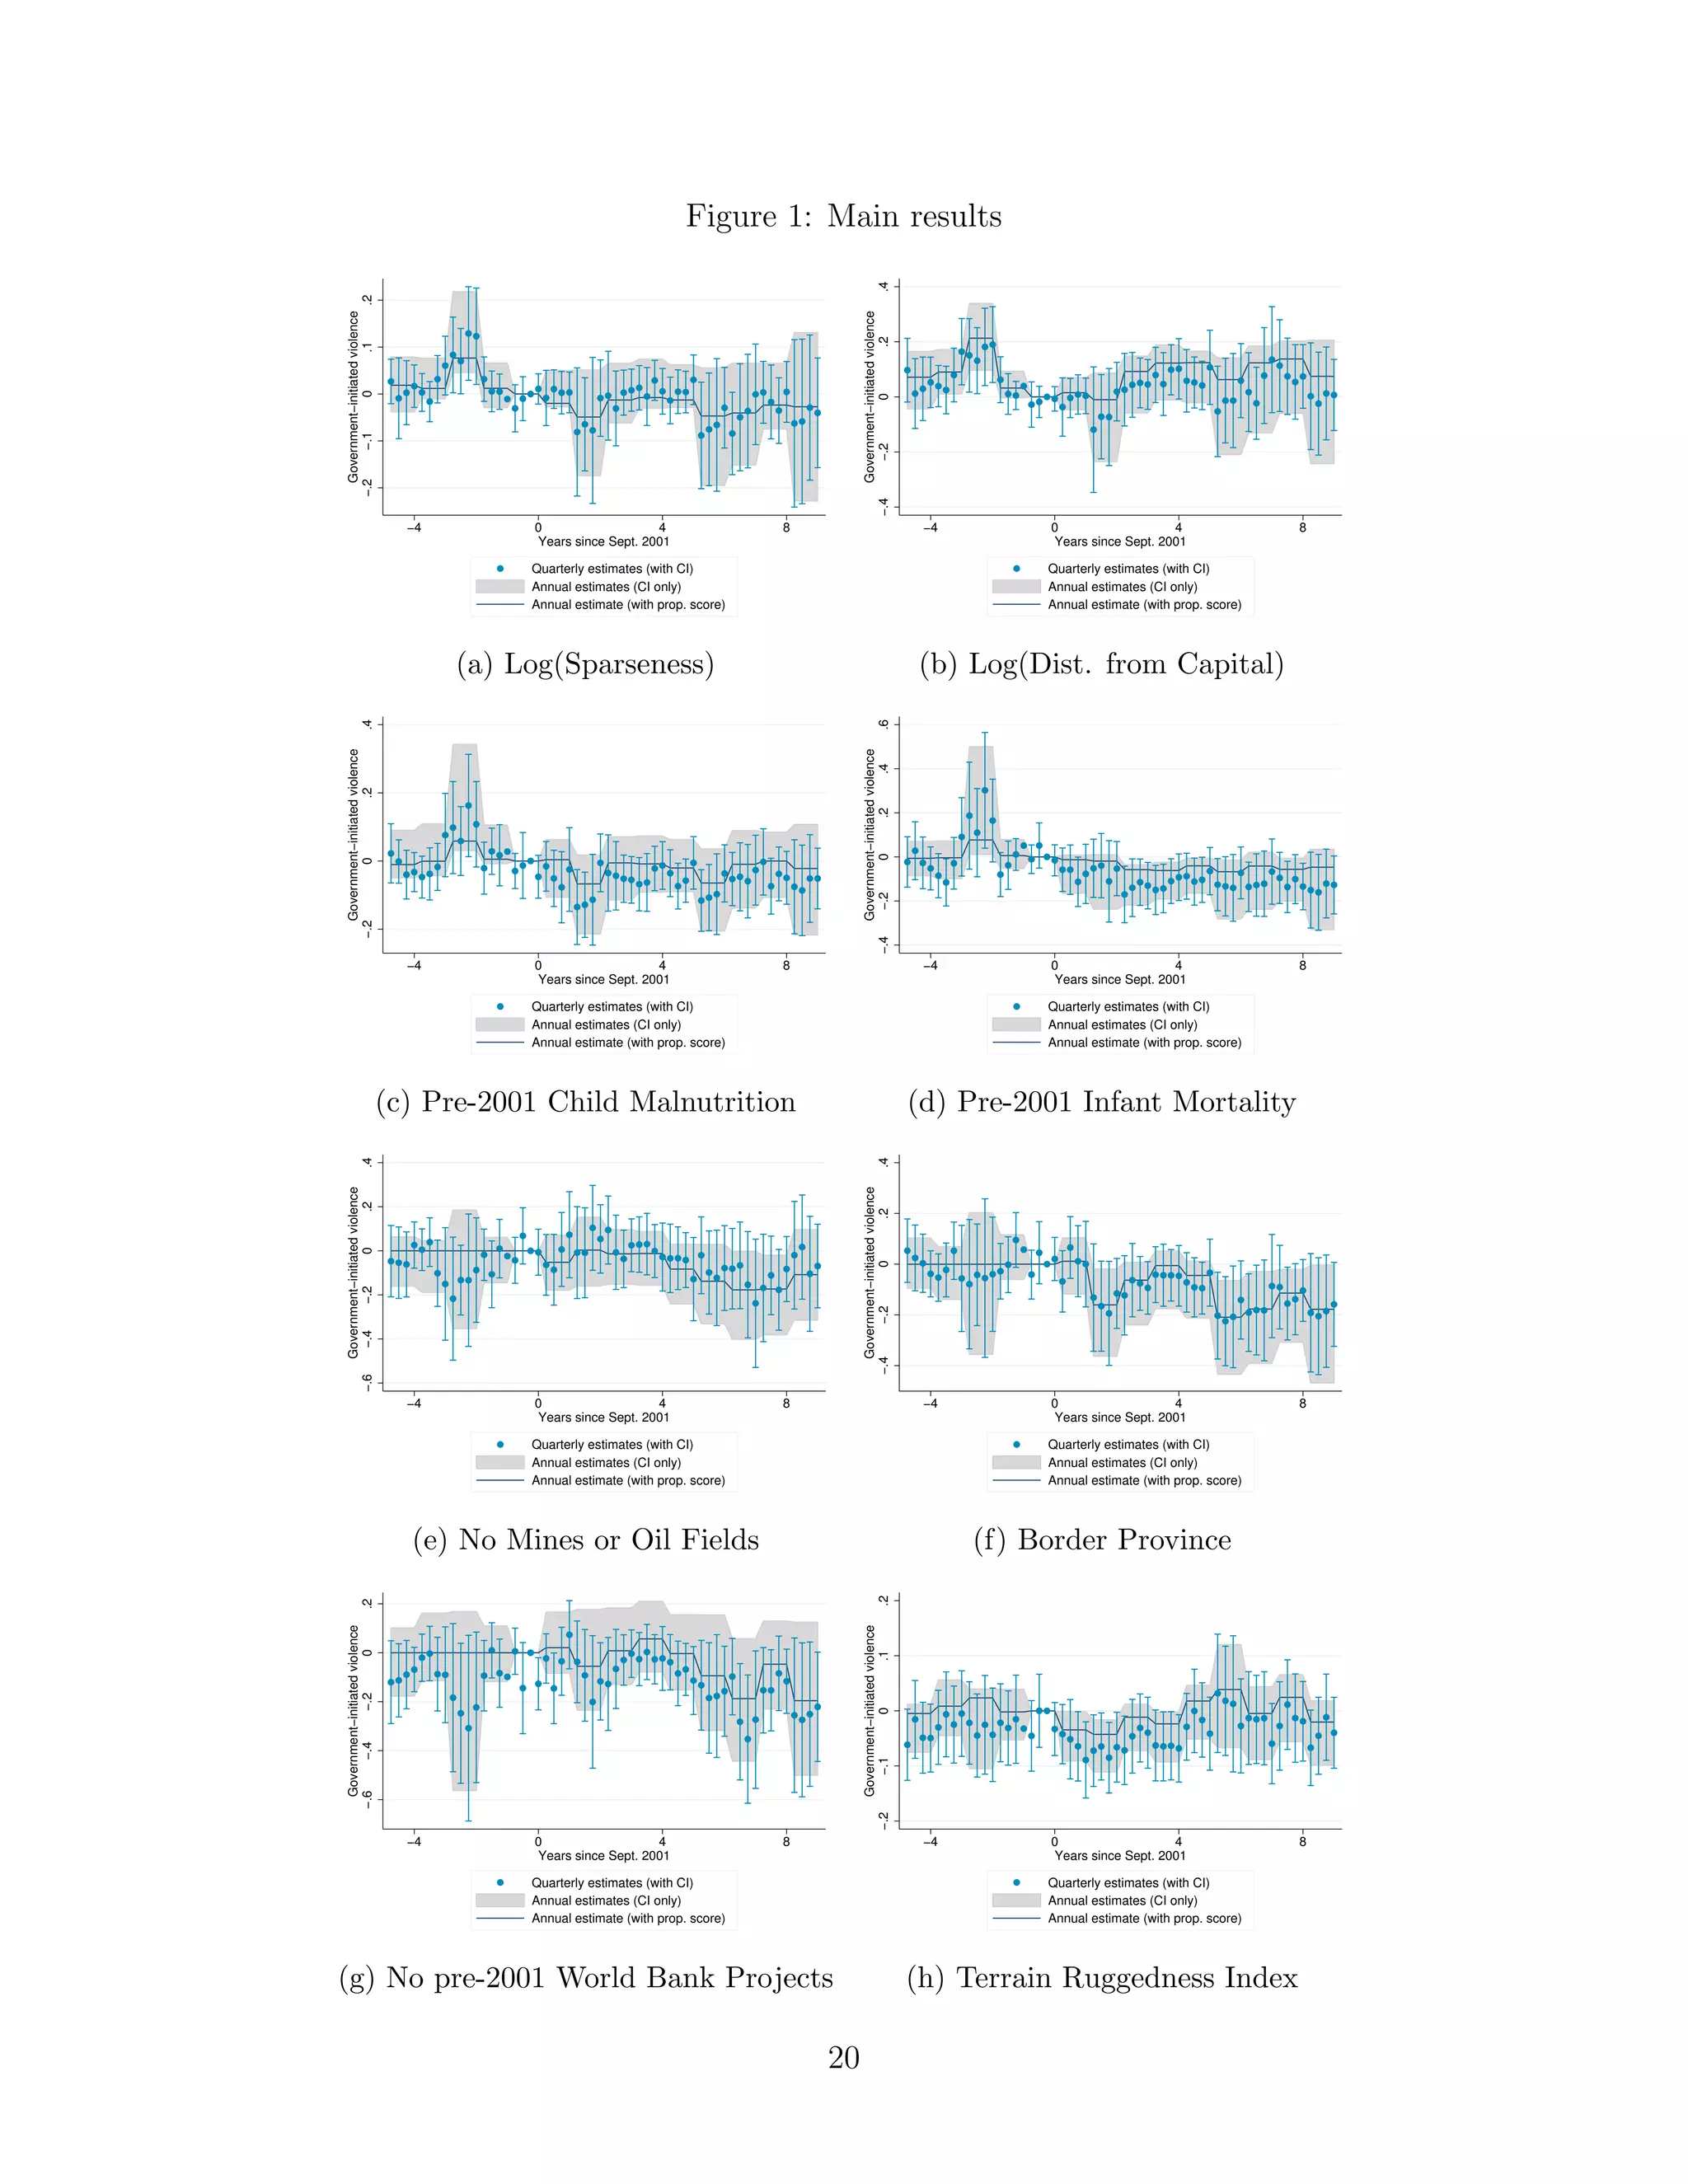
The main results are best seen in Figure 1, which plots estimated coefficients from the
quarterly and annual regressions, as well as results using the propensity scores to balance the
pre-trends. (For visual simplicity, confidence intervals are presented only for the unweighted
regressions, but the standard errors are similar for the propensity weighted regressions.) Because
violence has been scaled to have standard deviation of one, the coefficients can be interpreted
as the differential violence increase (in units of standard deviations) resulting from a 1-unit
increase in the given “ungoverned” proxy. Because the continuous proxies panels (a)-(e) have
also been scaled, 1-unit means a 1 standard deviation increase in those proxies.
The pre-trends are generally flat and not statistically significantly different from zero. De-
viations are often small and substantially mitigated by the propensity scores.11
Regardless of
the method, the estimated post-invasion coefficients are generally near zero. Particularly in
the years immediately following 2001, non-zero estimates are typically negative, suggesting, if
anything, less government involvement in ungoverned spaces. When the propensity weights
improve the pre-trends, they usually bring the estimated effects closer to zero.
The standard errors rarely reject zero, and are often fairly precise. For instance, the speci-
fications estimated with yearly data (and no weights) can often rule out effects larger than .1
standard deviations in the years immediately following, and can almost always rule out effects
larger than .2 standard deviations.
[Figure 1 about here.]
The pattern of results given by Figure 1 shows there is little evidence to suggest an expansion
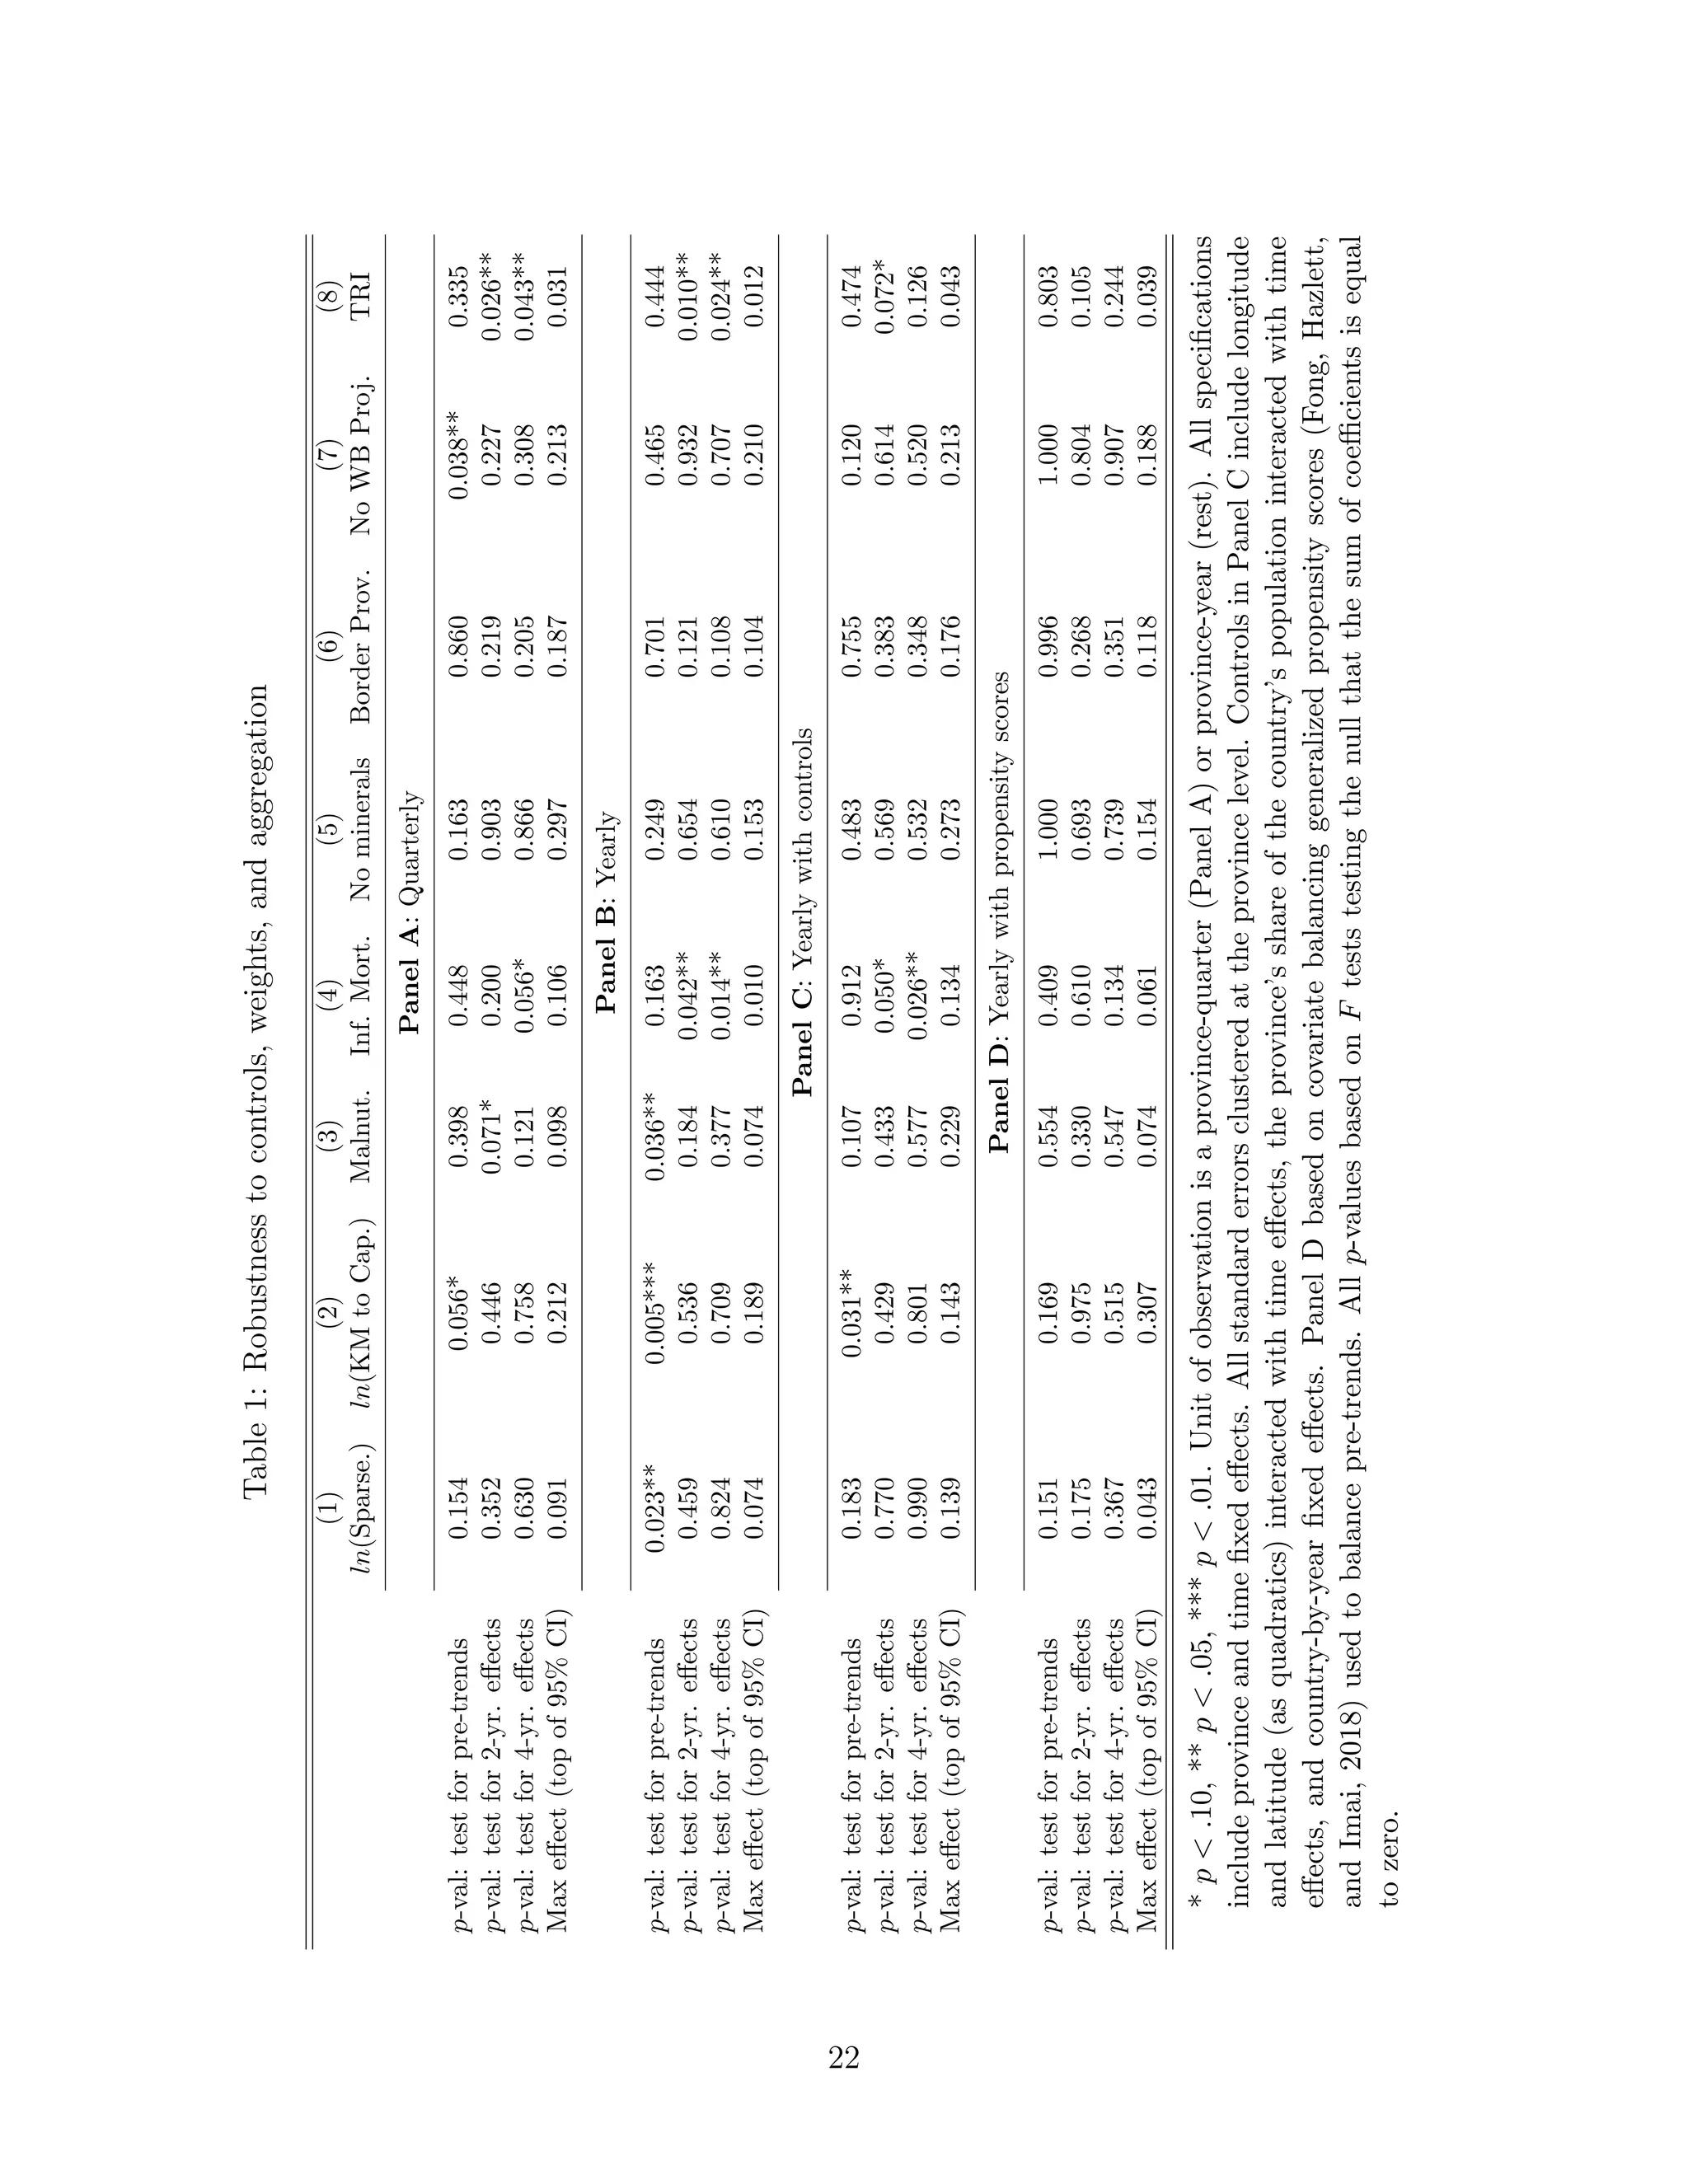
of governance following the invasion of Afghanistan. Table 1 collects the various statistical
results that support this conclusion.
The Table shows four panels, corresponding to the regression results with annual and quar-
terly data, and annual results with controls and propensity scores. For each specification,
the table presents the p-values corresponding to an F test for the joint significance of the
pre-treatment coefficients (i.e., a test for pre-trends), the joint significance of post-treatment
coefficients from the first two years after 2001 and the first four years after 2001 (i.e., 2-year
and 4-year treatment effects), and the top of the highest confidence interval on any coefficient
from the first four years after treatment (i.e., the largest possible increase that is consistent
with the results, or the smallest treatment effect that the results rule out).
11
Often, malnutrition and infant mortality are measured in 1999, and there is a corresponding spike during
that year because shocks in violence affect these child and infant health outcomes (Akresh, Lucchetti, and
Thirumurthy, 2012; Mansour and Rees, 2012; Molina, 2018).
14](https://image.slidesharecdn.com/deterringungovspaces112219-191122104659/75/Did-the-War-on-Terror-Deter-Ungoverned-Spaces-Not-in-Africa-14-2048.jpg)
![[Table 1 about here.]
The table suggests two important conclusions. First, the confidence intervals are generally
very tight. I can often rule out an increase in violence of .10 standard deviations, and I can
almost always rule out an increase of .20 standard deviations. For reference, .10 standard
deviations of the violence distribution is equal to .33 incidents of government-initiated violence
in a year, which is a reasonably small effect.
Second, it is important to notice that some of the estimated effects are statistically significant
(though when they are, they suggest decreasing violence after 2001) and some of the pre-
trends are significant. Including controls usually pushes both the pre-trends and the estimated
effects towards statistical non-significance. Mechanically, the propensity scores eliminate any
statistical evidence of pre-trends. When they do, they also eliminate any evidence of most-2001
effects (which is not mechanical). This is not because the weighting increases the standard
errors. The results in Panel D remain precisely estimated, and I can again often rule out effects
of .10 in half of the cases, and effects of .20 in seven of the eight cases.
5.2 Robustness
I claim that states did not attempt to capture their ungoverned territories following the
2001 Afghan invasion. I base this conclusion on a set of eight proxies drawn from the relevant
literature. My primary results flexibly and transparently present evidence from four different
specifications, for a total of 32 regressions. Of course, there are many other regressions that
could have been run, and in attempting to establish a null finding the burden is on the author
to be exhaustive.
Table 2 presents a variety of additional robustness checks. For simplicity, I present only
coefficients from yearly, unweighted regressions where I estimate a joint effect for the two
immediately following years (2002 and 2003). In other words, I present only the single coefficient
on the differential increase in violence during those two years. The full results are available
upon request.
First, I consider different measures of government-involved violence using the ACLED data.
Row 1 presents my baseline specification (the total count of events). In rows 2-4, I use a binary
indicator for whether there was any event, the number of deaths, and the number of events per
capita. In row 5, I use all ACLED events, rather than only those involving the government, in
case government involvement is not accurately recorded. None of these change the conclusions.
In row 6, I relax the assumption that “ungoverned” is linear in the proxy, and present results
using a dichotomous measure (for above vs. below average). In rows 7-11, I present parallel
15](https://image.slidesharecdn.com/deterringungovspaces112219-191122104659/75/Did-the-War-on-Terror-Deter-Ungoverned-Spaces-Not-in-Africa-15-2048.jpg)
![results using the UCDP data, and again find no effect. With the UCDP data it is also possible
to include a longer time-frame, and so in row 12 I extend the sample back to 1992.
Finally, I consider specific sub-samples. In row 13, I use the ACLED data and consider only
conflict-prone countries (defined as those experiencing a conflict with 25+ battle deaths during
at least one year in the 1990’s). Even in this sub-sample (where instability is high and rebels
are almost surely in control of the ungoverned spaces), there is no effect.
Next, I acknowledge that much of the War on Terror rhetoric centered on religion and
radical Islam. For instance, in the November 15, 2001, House Subcommittee on Africa hearing
on Africa and Global Terrorism, Chair Ed Royce (R-CA) said, “Some believe that segments
of Africa’s large Muslim population will make it difficult for certain African governments to
provide continued support to the United States and may even prove to be a recruiting base for
international terrorist organizations.” Thus, in rows 14 and 15 I consider the set of countries
with large Muslim populations (40% or more of the population, roughly the mean) and growing
Muslim populations, and again find no results. There is a marginally significant (p <.10)
increase in conflict in sparse provinces of countries with growing Muslim populations, but
the magnitude is small (.046 standard deviations, and the 95% confidence interval rules out
increases bigger than .097 standard deviations). In row 16, I focus on the eight countries Royce
specifically mentioned in his opening statement, again finding no effects.
[Table 2 about here.]
Additional results are presented in the appendix. Table A1 presents population-weighted
results. The point estimates are very similar, but population weights make the standard errors
larger. This is potentially because provinces experiencing the most violence and those which
are least likely to be governed (i.e., the provinces driving identification) tend to have relatively
small populations. Thus, it becomes even harder to reject the null that there was no expansion
in governance.
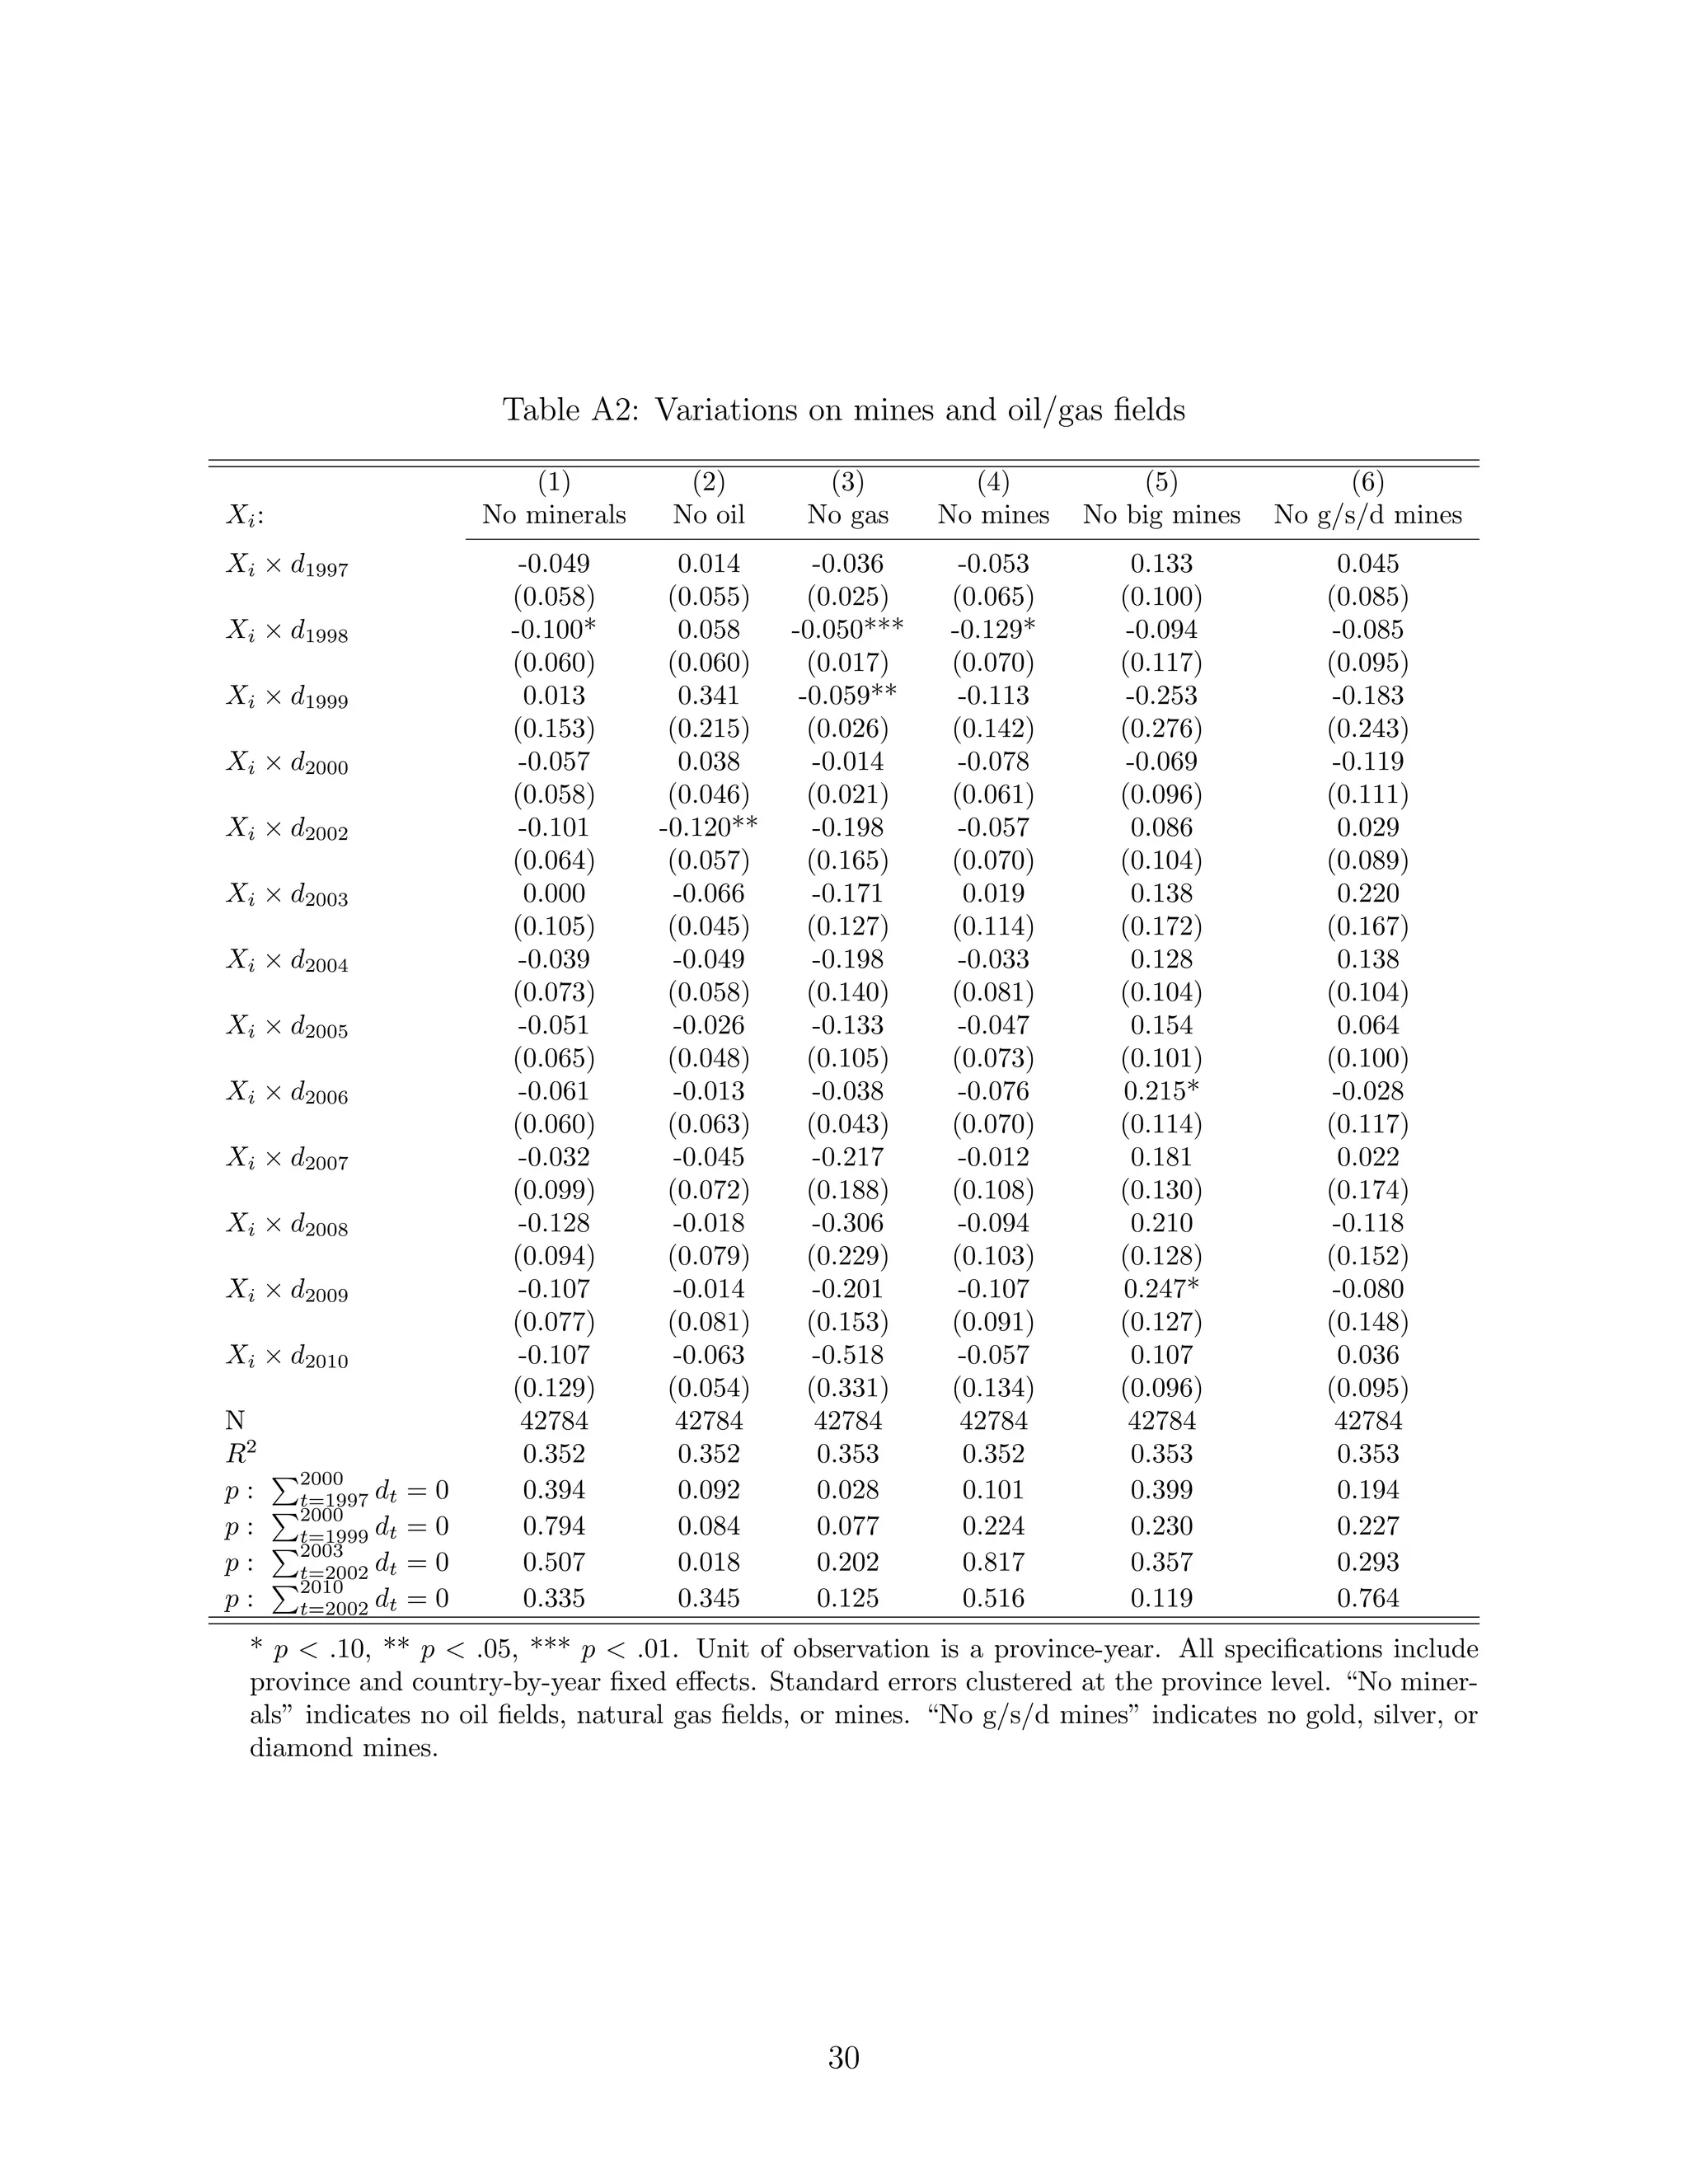
The main mineral resource specification is based on whether the provinces has any mines,
oil fields, or natural gas fields. Table A2 separately break apart mines, oil, and gas. None
show any meaningful evidence of increased conflict. I also look separately at the presence of
especially valuable minerals (gold, silver, and diamonds), which bears the same conclusion.
Finally, I consider especially large mines (those reported in the MRDS as having large or
medium production size, just under a third of mines). These show modestly sized positive
post-2001 coefficients (point estimates from .14 to .22 standard deviations during the first 5
years), one of which is statistically significant (p < .10), though the F-test fails to reject the
null that all post coefficients are jointly zero (p = .119). This is modest evidence of government
expansions, but does not seem particularly compelling.
16](https://image.slidesharecdn.com/deterringungovspaces112219-191122104659/75/Did-the-War-on-Terror-Deter-Ungoverned-Spaces-Not-in-Africa-16-2048.jpg)


![A Additional results
[Table A1 about here.]
[Table A2 about here.]
[Table A3 about here.]
27](https://image.slidesharecdn.com/deterringungovspaces112219-191122104659/75/Did-the-War-on-Terror-Deter-Ungoverned-Spaces-Not-in-Africa-27-2048.jpg)


This document examines the effectiveness of the U.S. war on terror in deterring ungoverned spaces in Africa, concluding that it was largely ineffective. An analysis of post-2001 government engagement in less governed areas shows no significant increase in authority or presence. The findings suggest that military deterrence strategies may not address the complexities of governance in weak states.


