Download to read offline

![Dr. Ved Nath Jha* Dr.Ghanshyam Kumar Singh**
5329
Figure 7: Wavelength (λ) versus normalized output power for medium of different
dielectric constant taken simultaneously ( m = 1.4, 1.7, and 2.0) for probe c.
4. CONCLUSION
Precise measurement of toxic impurities in water is of significant importance in light of human
health. In general, water is highly contaminated and includes different kinds of contaminants
near fertiliser plants and the industry. The article focused on experimental activities to detect
impurities in fluorides, chromium and arsenic using a fibre optic filter sensor in potable
water. The principle of working of the fabricated fiber optic sensor probe is localized surface
plasmon resonance (LSPR). The plasmon resonance induced in the metal nanoparticles under the
influence of an electromagnetic wave of frequency same as the frequency of oscillation of
electron cloud in metal nanoparticles enhances the absorption. We have deposited Silver
nanoparticles on a part of the unclad region of the optical fiber using a laser-induced
nanoparticle deposition technique. This technique of the deposition of the Silver nanoparticle is
very simple and quick. The Silver based sensor is known for its narrow spectral width and the
high detection accuracy. Although, Silver is chemically unstable and is highly vulnerable to
oxidation. Silver nanoparticles are sensitive towards the impurity which inspired us to choose
Silver nanoparticles for the deposition to make the sensor probe.
REFERENCES
[1].N. George, A. M. Paul, and M. S. Saranya, ‘Microbend fiber optic detection of
continuously varying refractive index of chlorinated water’, Optik - International Journal
for Light and Electron Optics, vol. 125, no. 1, pp. 301– 303, Jan. 2014.
[2].M. Afzal, ‘Introduction to fibre-optic sensing system and practical applications in water
quality management’, 2013 Fourth International Conference on Computing,
Communications and Networking Technologies (ICCCNT), Jan. 2013.
[3].M. Li, D. Li, Q. Ding, Y. Chen, and C. Ge, ‘A Multi-parameter Integrated Water Quality
Sensors System’, IFIP Advances in Information and Communication Technology, pp.
260–270, Jan. 2013
[4].Wencel, B. D. MacCraith, and McDonagh, ‘High performance optical ratiometric sol–
gel-based pH sensor’, Sensors and Actuators B: Chemical, vol. 139, no. 1, pp. 208–213,
Jan. 2009.
[5].J.-H. Pai, D. Davey, and H.-Y. Hsu, ‘Essential elements of biosensor development for
water quality monitoring’, 2011 Seventh International Conference on Intelligent Sensors,
Sensor Networks and Information Processing, Jan. 2011.
[6].Sohanghpurwala, Aliasgar, Govind Rao, and Yordan Kostov. "Optical replacement of pH
electrode." Sensors Journal, IEEE 9.3 (2009): 219-220.
[7].Z. Dong, U. Wejinya, J. Vaughan, and A. Albrecht, ‘Fabrication and testing of ISFET
based pH sensor for microliter scale solution targets’, 2012 IEEE Nanotechnology
Materials and Devices Conference (NMDC2012), Jan. 2012.
[8].N. George, A. M. Paul, and M. S. Saranya, ‘Microbend fiber optic detection of
continuously varying refractive index of chlorinated water’, Optik - International Journal
for Light and Electron Optics, vol. 125, no. 1, pp. 301– 303, Jan. 2014.](https://image.slidesharecdn.com/2721-211010170415/75/DEVELOPMENT-OF-OPTICAL-PARAMETER-CALCULATIONS-OF-THE-PROBES-IN-WATER-8-2048.jpg)
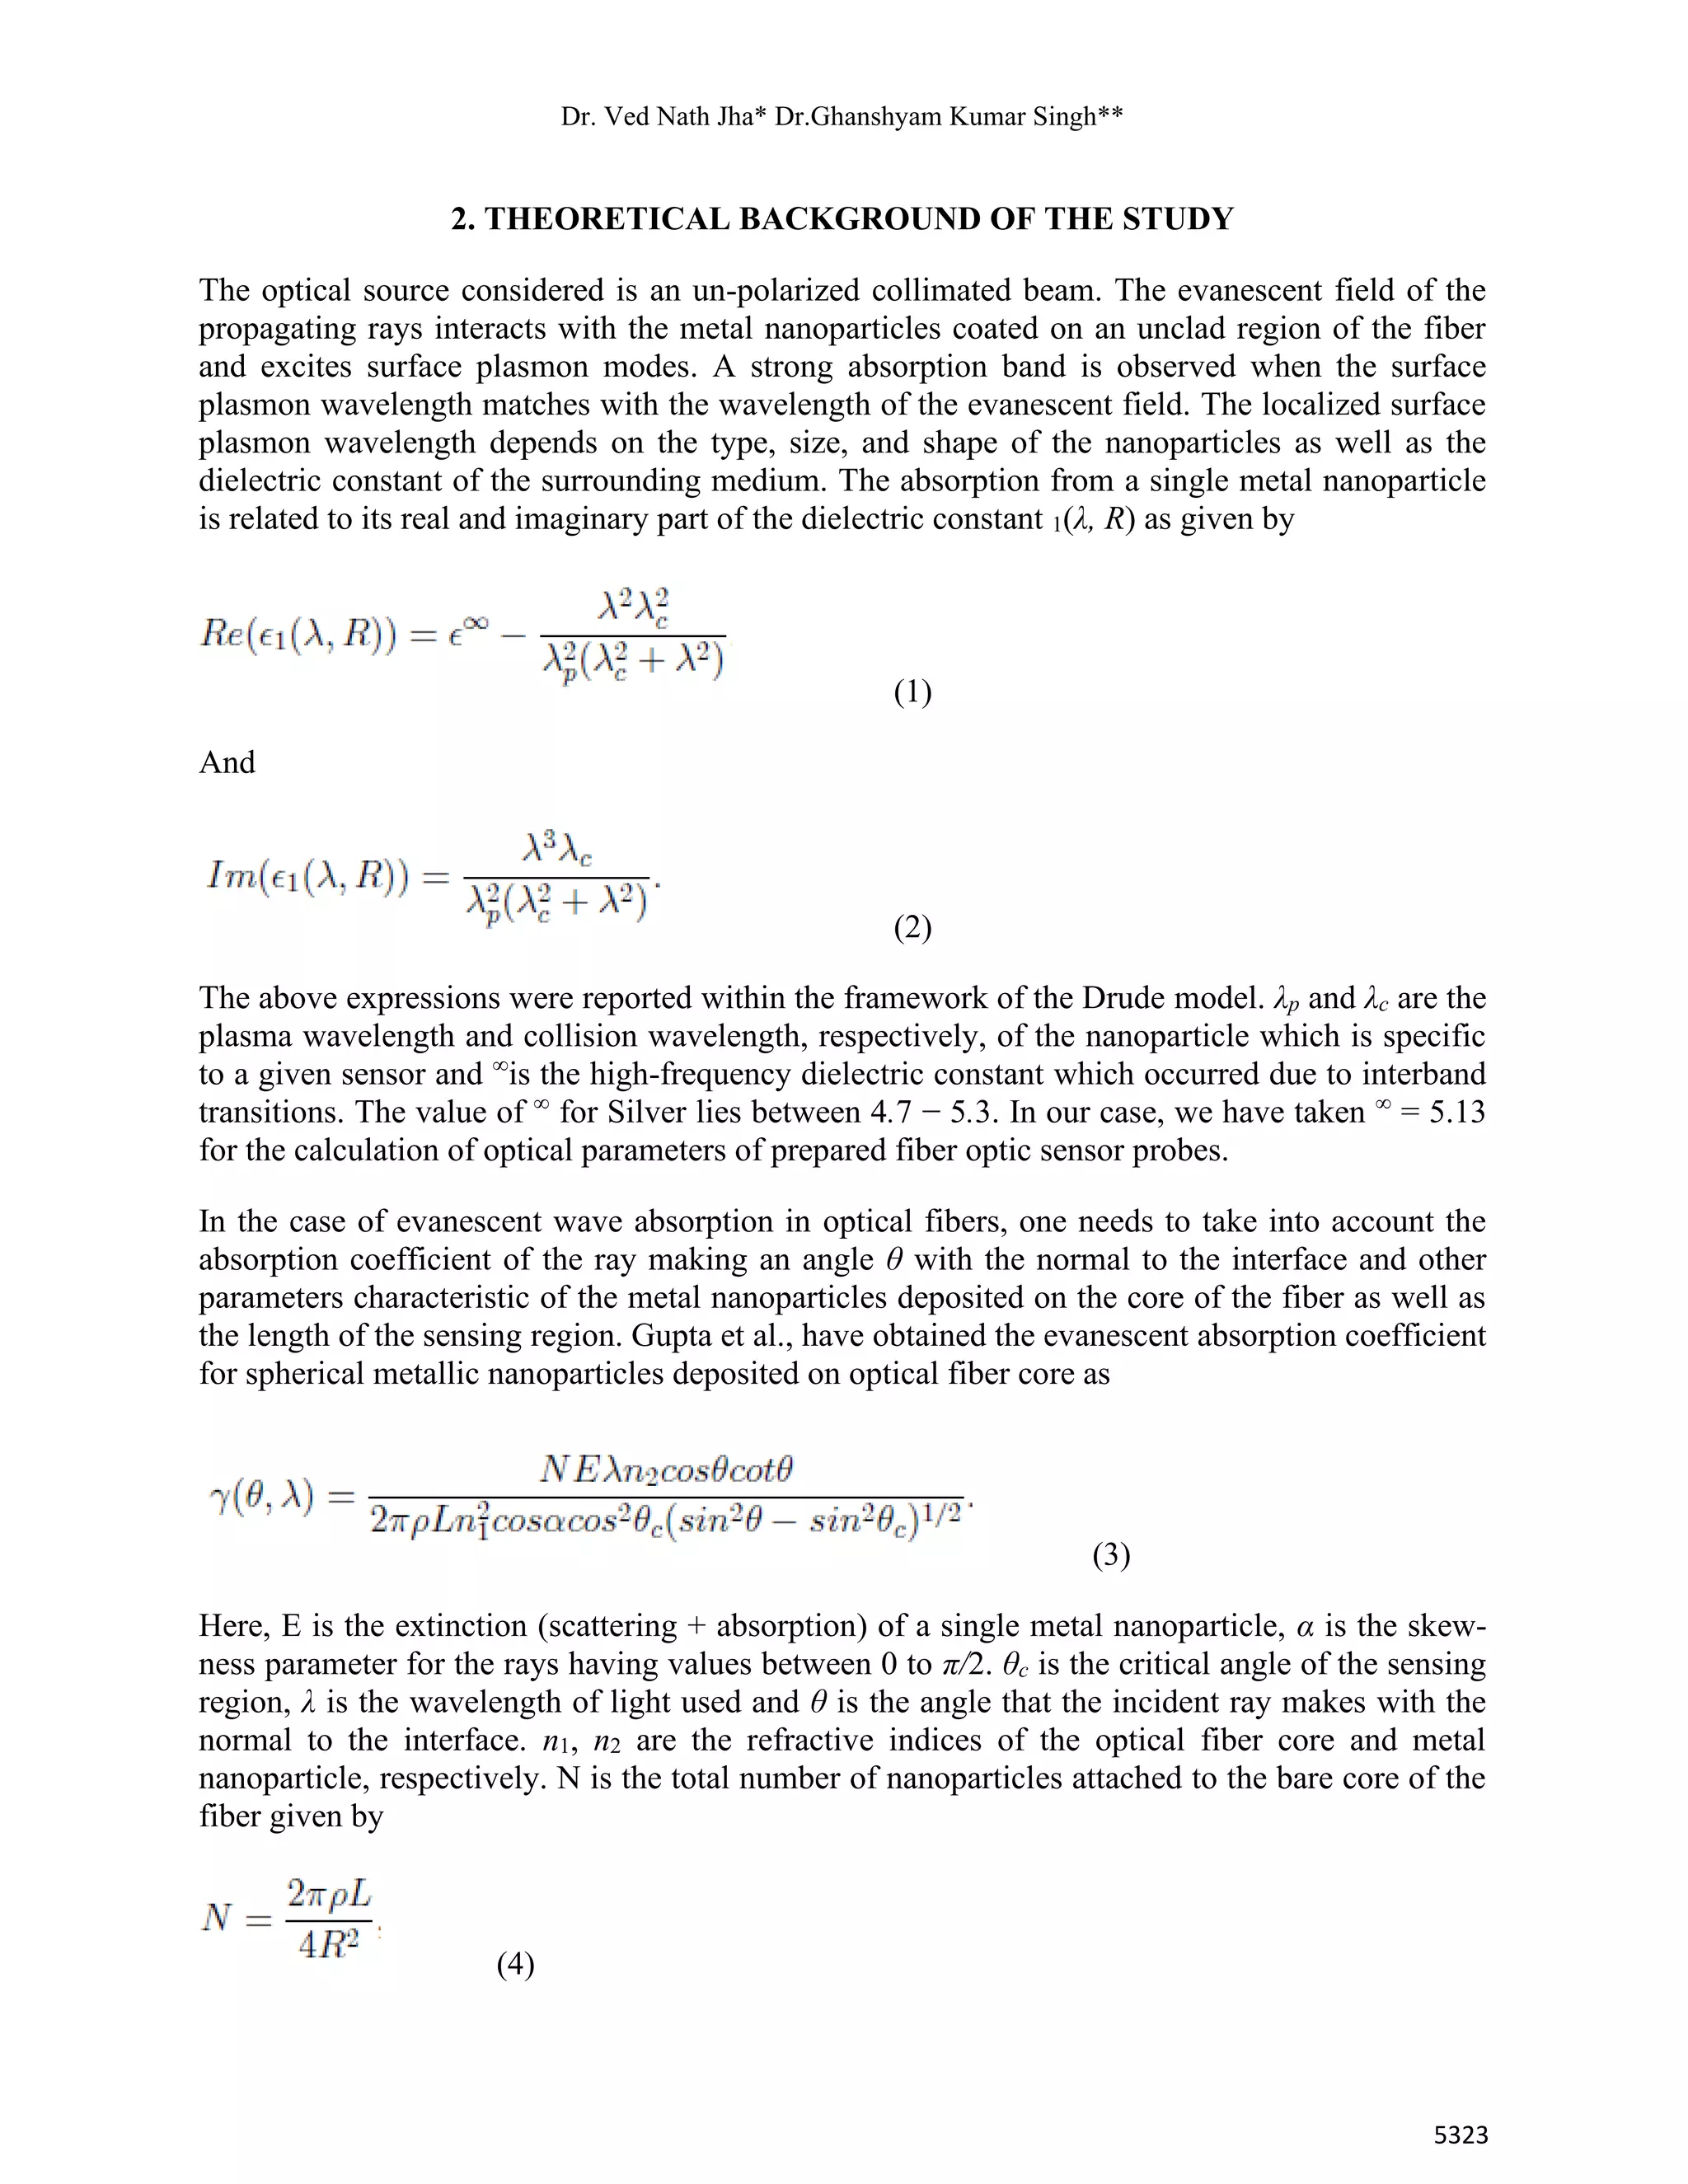
![DEVELOPMENT OF OPTICAL PARAMETER CALCULATIONS OF THE PROBES IN WATER
5330
[9].L. Zhang and X. Gu, ‘Study on residual chlorine detecting system based on dual-
wavelength optical path’, 2010 International Conference on Computer Application and
System Modeling (ICCASM 2010), Jan. 2010.
[10]. Daniyal, W.M.E.M.M.; Saleviter, S.; Fen, Y.W. Development of Surface
Plasmon Resonance Spectroscopy for Metal Ion Detection. Sens. Mater. 2018, 30, 2023–
2038.
[11]. Liu, X.; Yao, Y.; Ying, Y.; Ping, J. Recent advances in nanomaterial-enabled
screen-printed electrochemical sensors for heavy metal detection. Trends Anal.
Chem. 2019, 115, 187–202
[12]. Raj, D.R.; Prasanth, S.; Vineeshkumar, T.V.; Sudarsanakumar, C. Surface
Plasmon Resonance based fiber optic sensor for mercury detection using gold
nanoparticles PVA hybrid. Opt. Commun. 2016, 367, 102–107.](https://image.slidesharecdn.com/2721-211010170415/75/DEVELOPMENT-OF-OPTICAL-PARAMETER-CALCULATIONS-OF-THE-PROBES-IN-WATER-9-2048.jpg)

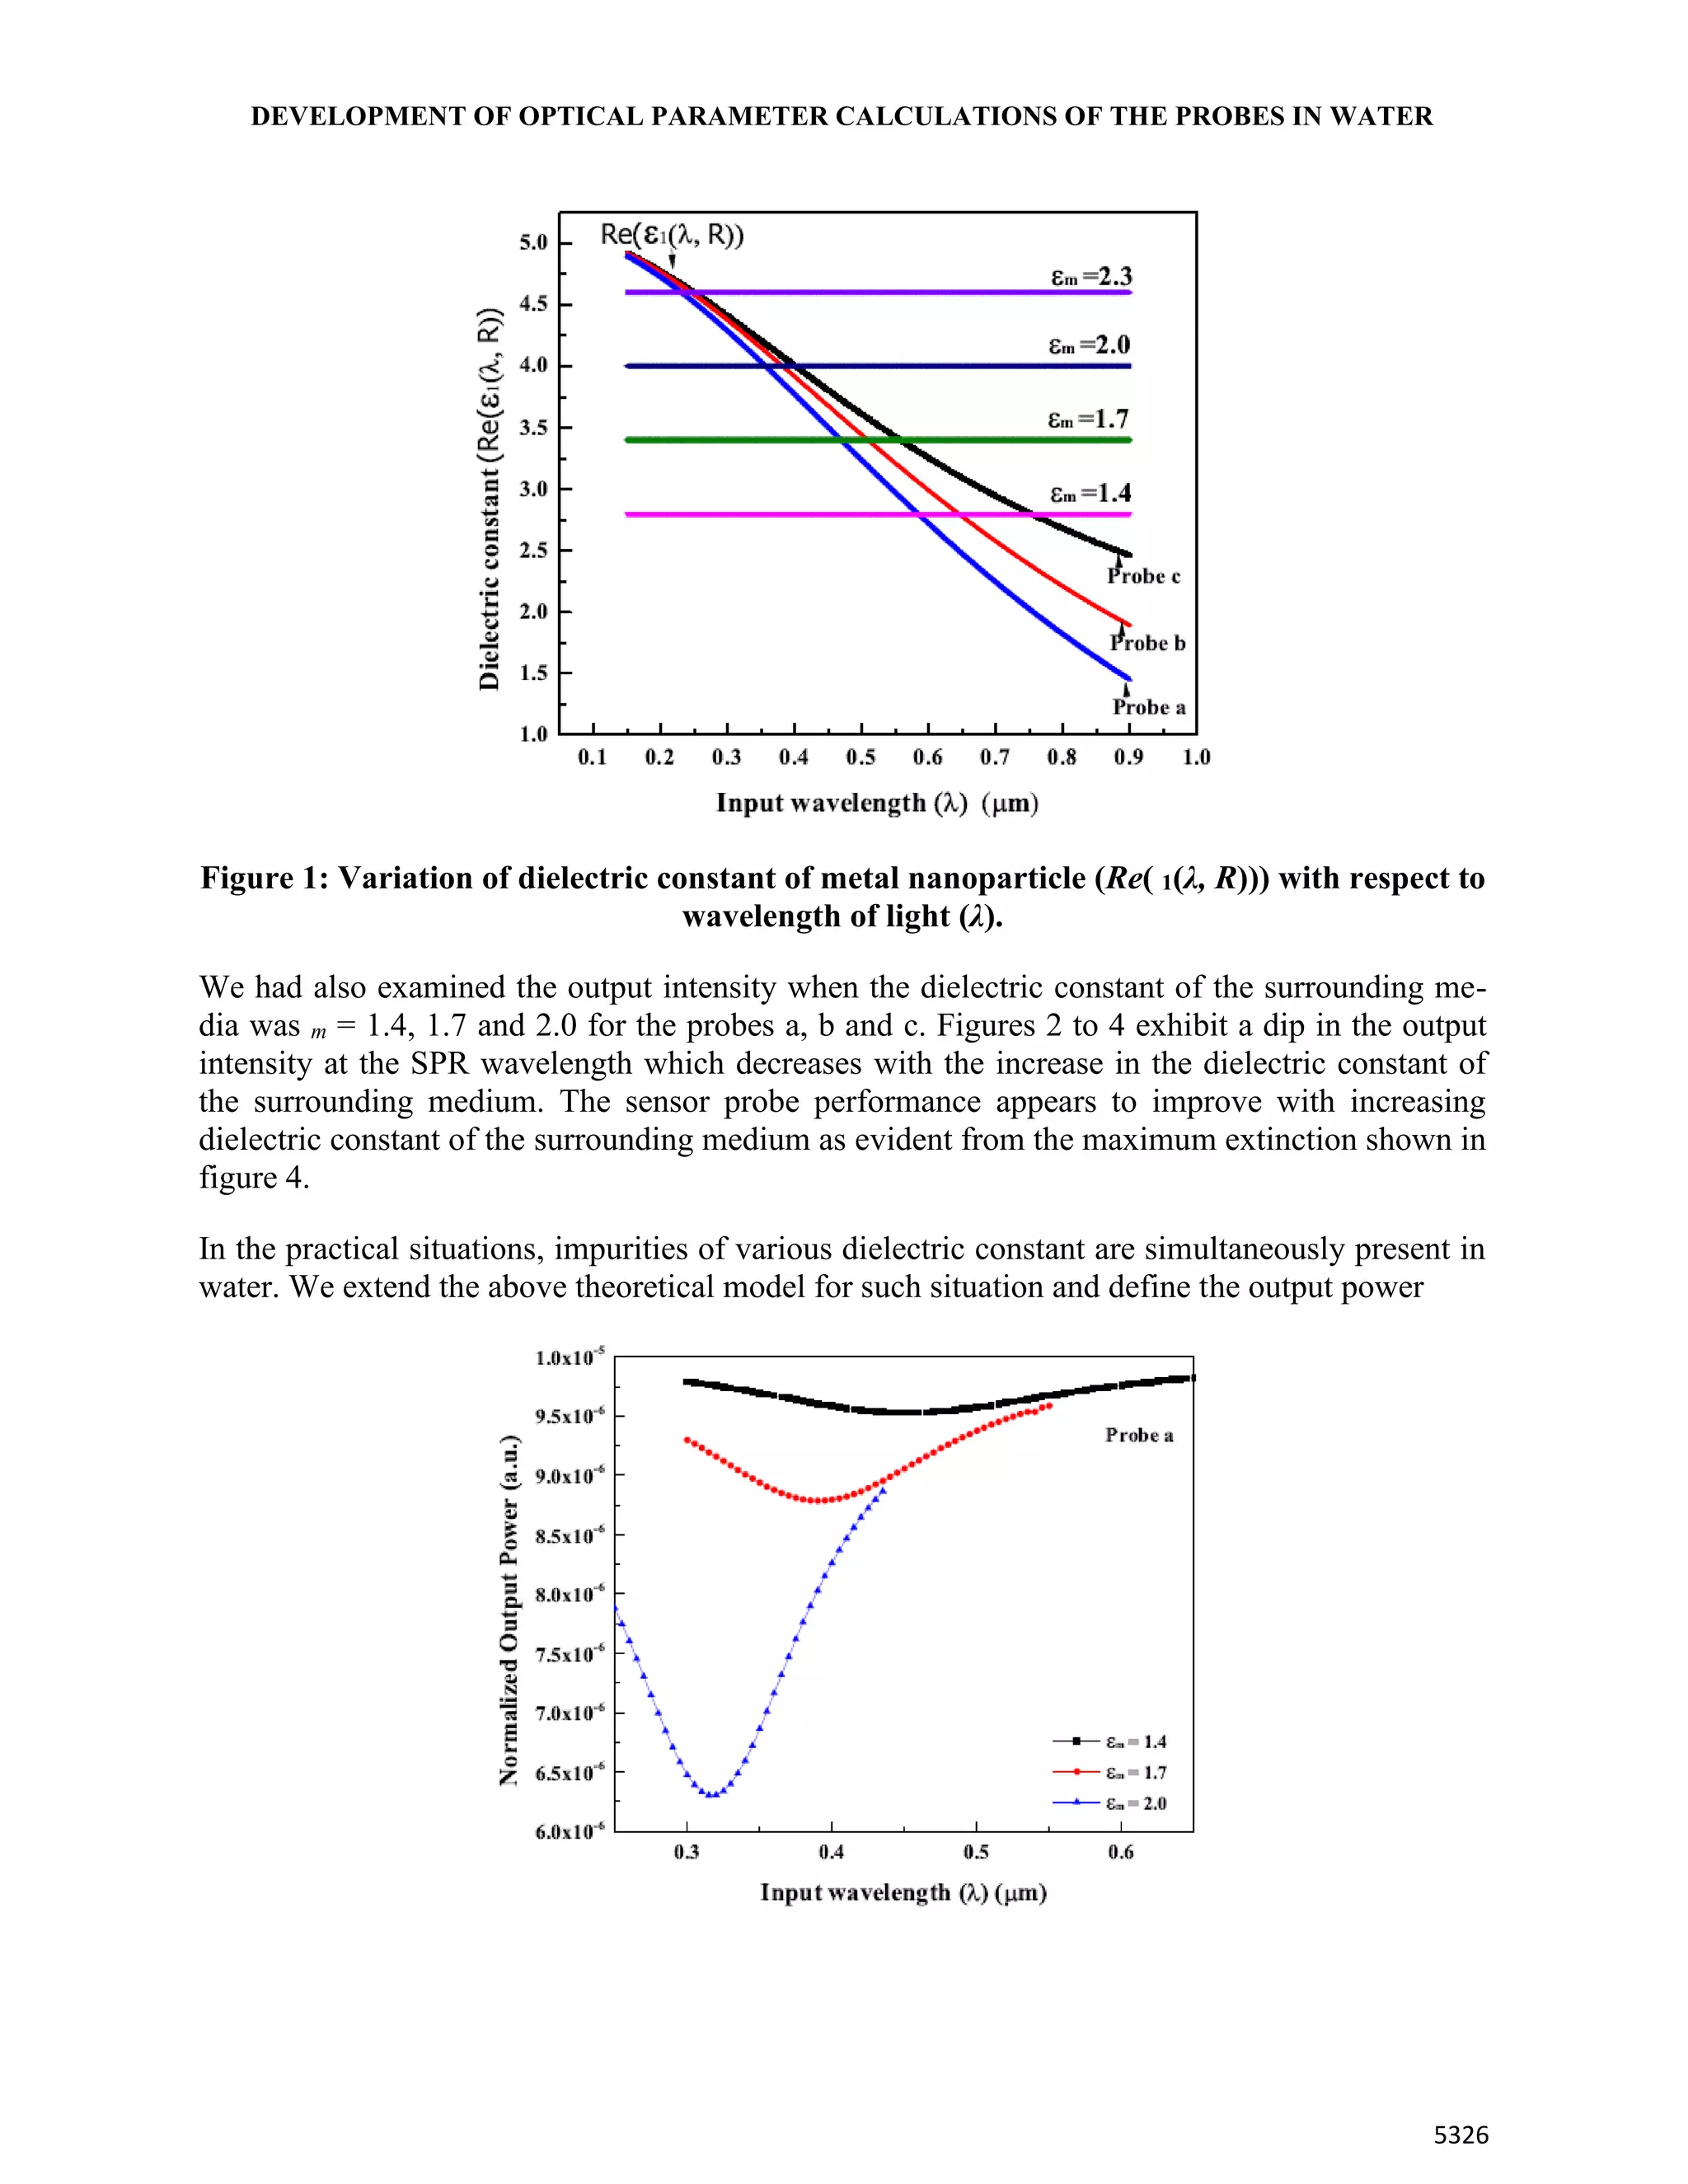
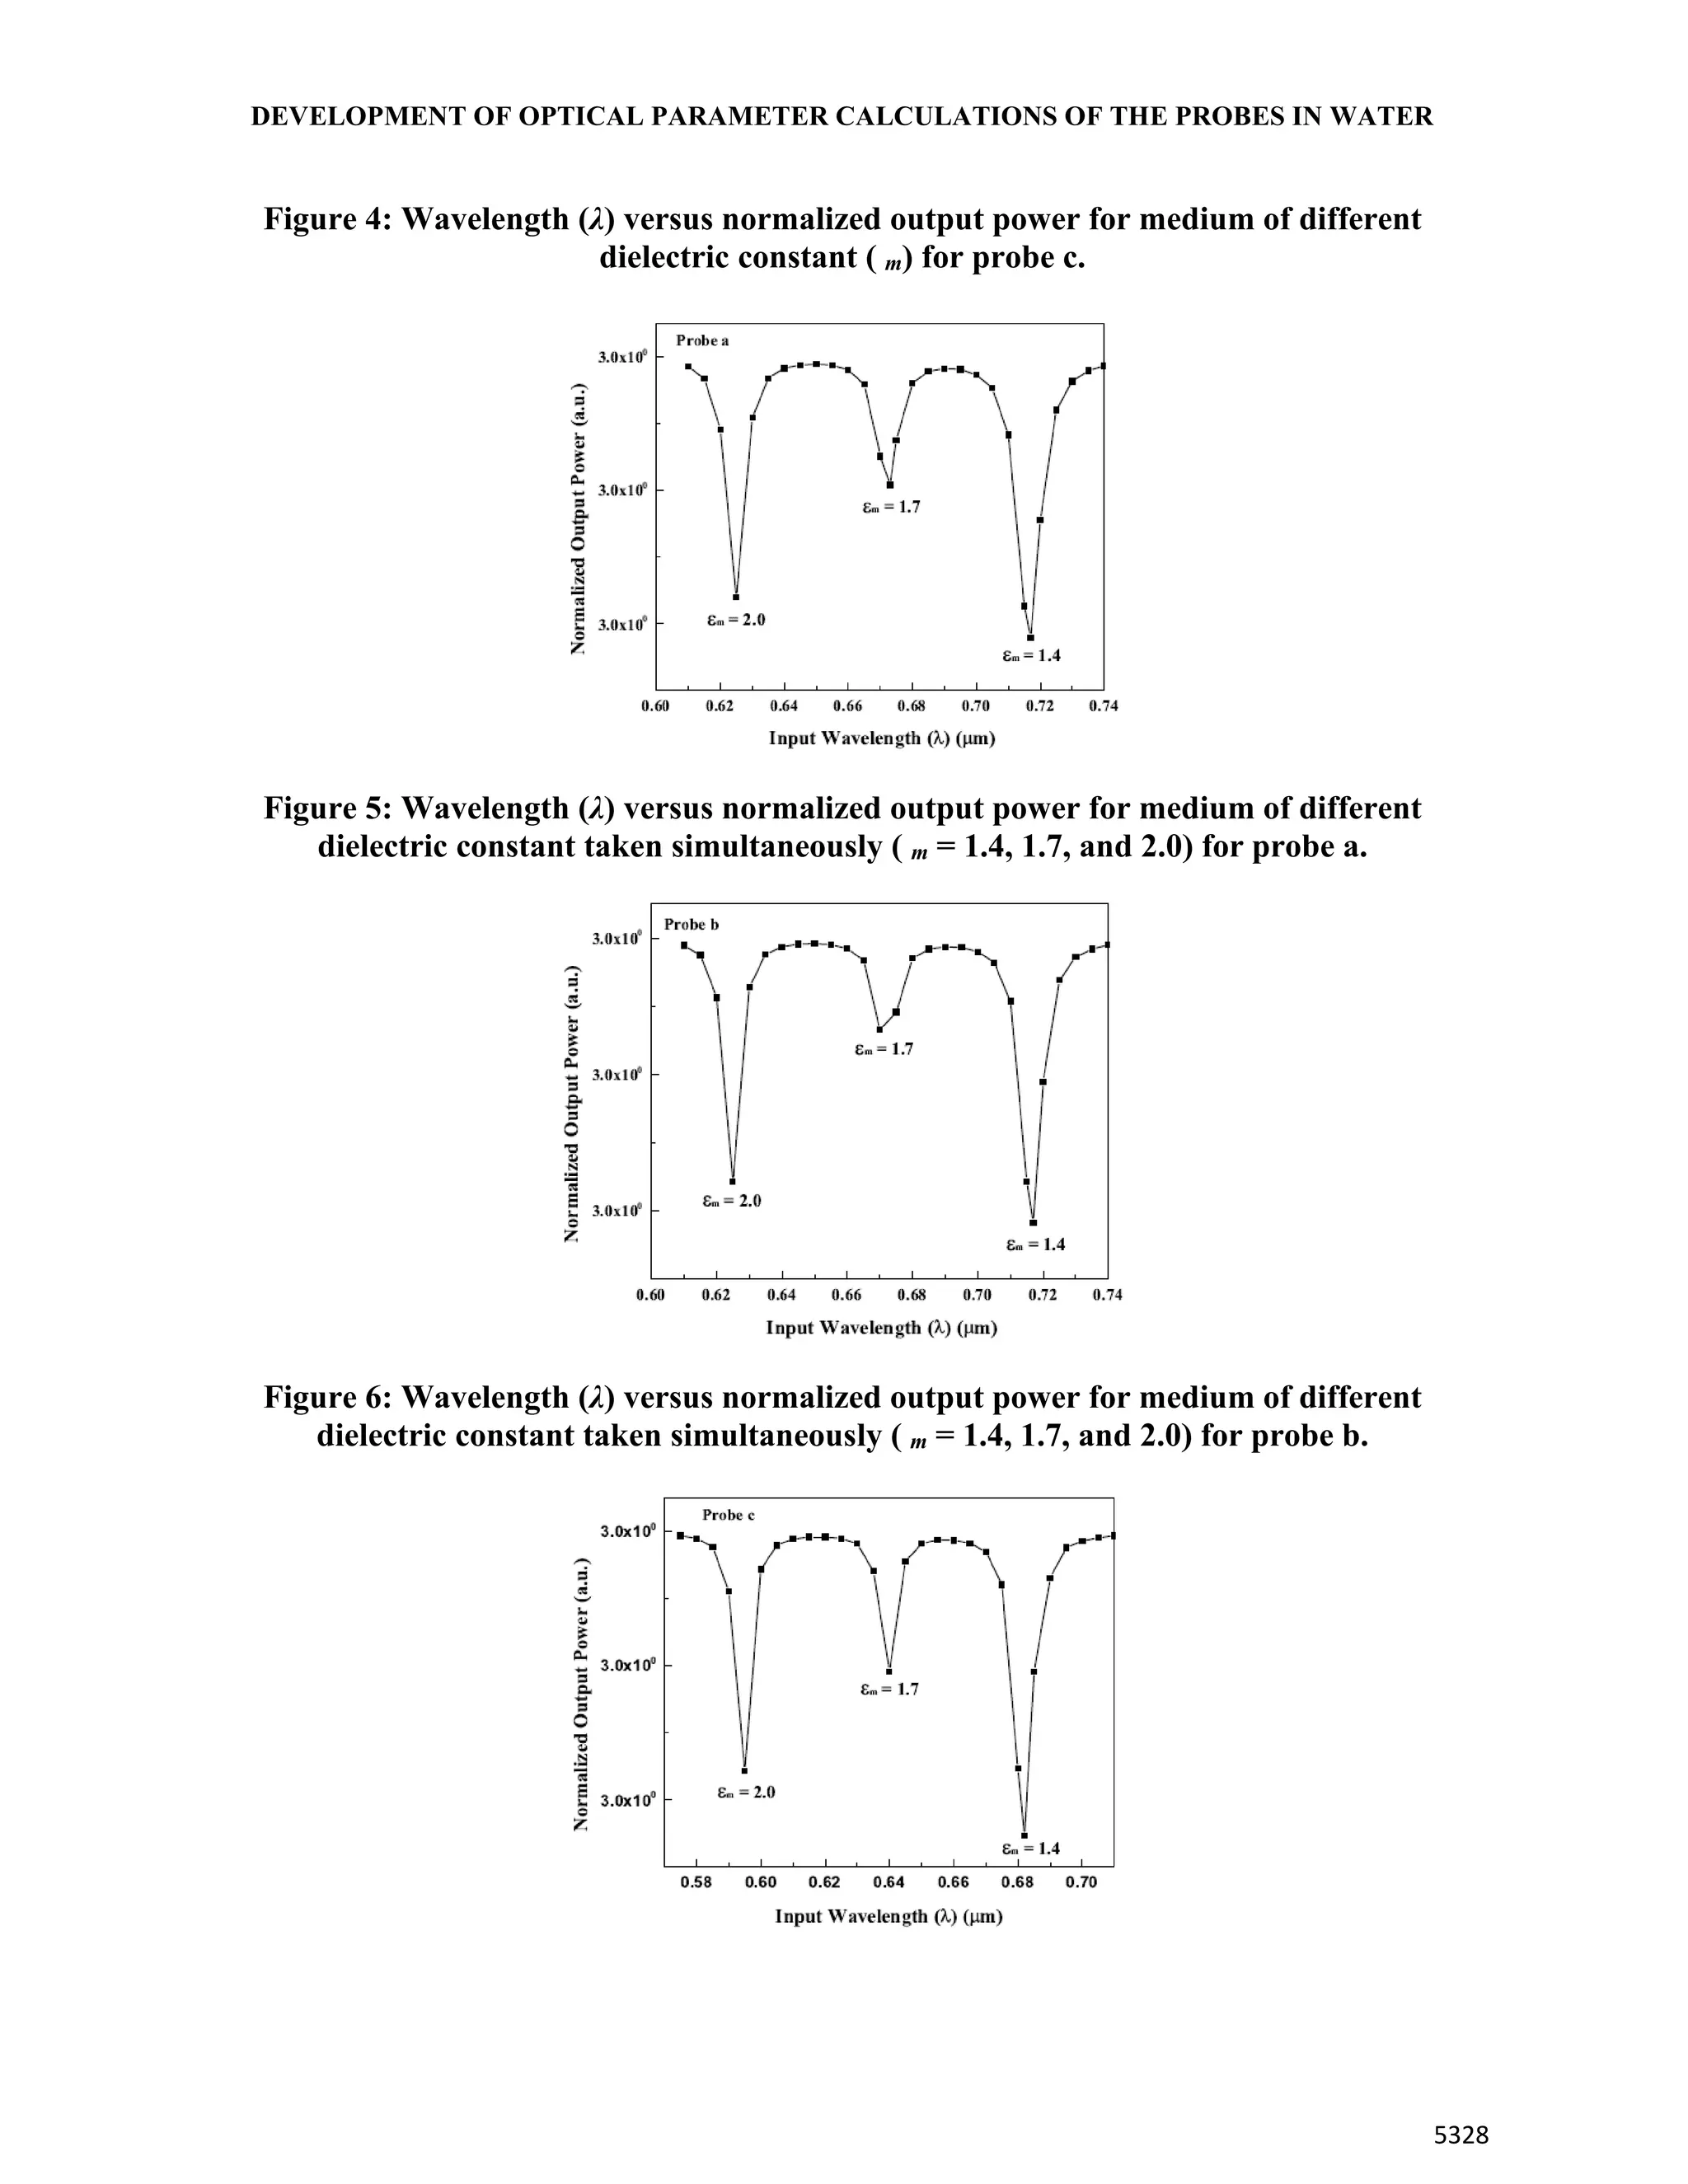
This document describes the development of optical parameter calculations for probes used in water sensing. Three probes (a, b, c) of varying nanoparticle size were developed and their plasma and collision wavelengths were calculated based on experimental measurements in water and air. The probes showed decreasing collision wavelength but nearly constant plasma wavelength with increasing nanoparticle size. Models were developed to calculate output intensity based on the dielectric constant of the surrounding medium. Distinct dips in output intensity correlated with different dielectric components when mixtures were tested, showing ability to detect multiple impurities simultaneously. The probes function best for dielectric constants between 1.4-2.0 and silver nanoparticles provide sensitivity towards targeted impurities in water quality monitoring.


