Designing a Minimum Distance classifier to Class Mean Classifier
•
0 likes•357 views

Implementation of Minimum Distance classifier to Class Mean Classifier using python

Recommended
Recommended
More Related Content
What's hot
What's hot (20)
Similar to Designing a Minimum Distance classifier to Class Mean Classifier
Similar to Designing a Minimum Distance classifier to Class Mean Classifier (20)
Recently uploaded
Recently uploaded (20)
Designing a Minimum Distance classifier to Class Mean Classifier
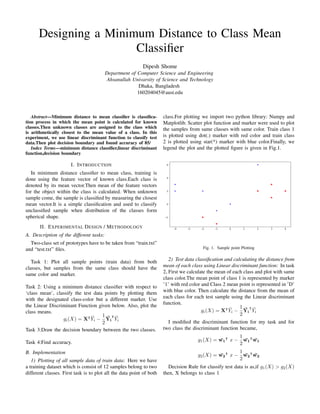
- 1. Designing a Minimum Distance to Class Mean Classifier Dipesh Shome Department of Computer Science and Engineering Ahsanullah Univarsity of Science and Technology Dhaka, Bangladesh 160204045@aust.edu Abstract—Minimum distance to mean classifier is classifica- tion process in which the mean point is calculated for known classes.Then unknown classes are assigned to the class which is arithmetically closest to the mean value of a class. In this experiment, we use linear discriminant function to classify test data.Then plot decision boundary and found accuracy of 85/ Index Terms—minimum distance classifier,linear discriminant function,decision boundary I. INTRODUCTION In minimum distance classifier to mean class, training is done using the feature vector of known class.Each class is denoted by its mean vector.Then mean of the feature vectors for the object within the class is calculated. When unknown sample come, the sample is classified by measuring the closest mean vector.It is a simple classification and used to classify unclassified sample when distribution of the classes form spherical shape. II. EXPERIMENTAL DESIGN / METHODOLOGY A. Description of the different tasks: Two-class set of prototypes have to be taken from “train.txt” and “test.txt” files. Task 1: Plot all sample points (train data) from both classes, but samples from the same class should have the same color and marker. Task 2: Using a minimum distance classifier with respect to ‘class mean’, classify the test data points by plotting them with the designated class-color but a different marker. Use the Linear Discriminant Function given below. Also, plot the class means. gi(X) = X| Ȳi − 1 2 Ȳi | Ȳi Task 3:Draw the decision boundary between the two classes. Task 4:Find accuracy. B. Implementation 1) Plotting of all sample data of train data: Here we have a training dataset which is consist of 12 samples belong to two different classes. First task is to plot all the data point of both class.For plotting we import two python library: Numpy and Matplotlib. Scatter plot function and marker were used to plot the samples from same classes with same color. Train class 1 is plotted using dot(.) marker with red color and train class 2 is plotted using star(*) marker with blue color.Finally, we legend the plot and the plotted figure is given in Fig.1. Fig. 1. Sample point Plotting 2) Test data classification and calculating the distance from mean of each class using Linear discriminant function: In task 2, First we calculate the mean of each class and plot with same class color.The mean point of class 1 is represented by marker ’1’ with red color and Class 2 mean point is represented in ’D’ with blue color. Then calculate the distance from the mean of each class for each test sample using the Linear discriminant function. gi(X) = X| Ȳi − 1 2 Ȳi | Ȳi I modified the discriminant function for my task and for two class the discriminant function became, g1(X) = ¯ w1 | x − 1 2 ¯ w1 | ¯ w1 g2(X) = ¯ w2 | x − 1 2 ¯ w2 | ¯ w2 Decision Rule for classify test data is as,if g1(X) > g2(X) then, X belongs to class 1
- 2. else X belongs to class 2 Fig. 2. Decision Boundary plotting 3) Decision boundary drawing between two classes: For decision boundary drawing, i consider all the possible point within the range as those points maintain equal distance from both classes.Then i used the maximum and minimum value of x to calculate y using the following function for drawing boundary line between two class g1(x) = g2(x) = ¯ w1 | x − 1 2 ¯ w1 | ¯ w1 − ¯ w2 | x + 1 2 ¯ w2 | ¯ w2 = ( ¯ w1 | − ¯ w2)x − 1 2 ( ¯ w1 | ¯ w1 − ¯ w2 | ¯ w2) Now we can consider it as linear equation to determine the decision boundary: ( ¯ w1 | − ¯ w2)x − 1 2 ( ¯ w1 | ¯ w1 − ¯ w2 | ¯ w2) = 0 Where ( ¯ w1 | − ¯ w2) is coefficients and 1 2 ( ¯ w1 | ¯ w1 − ¯ w2 | ¯ w2) is constant.The final equation is look like y = coefficient1 ∗ x + constant coefficient2 After plotting the x and y values, a straight line equation is created with red dot which represent the decision boundary between two class. III. RESULT ANALYSIS Test data is consist of seven sample points and two classes.six out seven data point is correctly classified using minimum distance classifier and all the training sample is classified correctly.So, we can say that accuracy is 85/ Fig. 3. Plotting of mean of the classes and test data using minimum distance classifier with respect to class mean IV. CONCLUSION In this experiment, i tried to implement a simple minimum distance to class mean classifier without complex mathe- matical calculation.Here, some sample classified accurately and some classified wrongly but the calculation speed is too faster.The limitation of this classifier is its accuracy rate is comparatively lower in nonlinear dataset as the decision boundary between two class is linear V. ALGORITHM IMPLEMENTATION / CODE
- 3. REFERENCES [1] Vladimir Curic,“Classification Slide,” [2] Minimum Distance Classifier, ”http://sar.kangwon.ac.kr/etc/rsnote/rsnote/cp11/cp11− 6.htm : : text = The