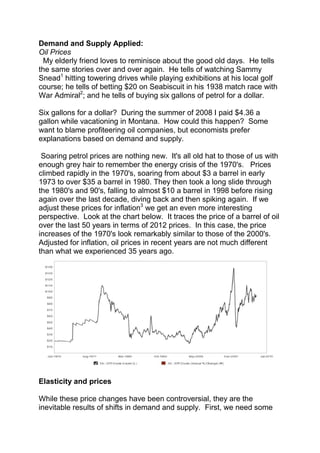
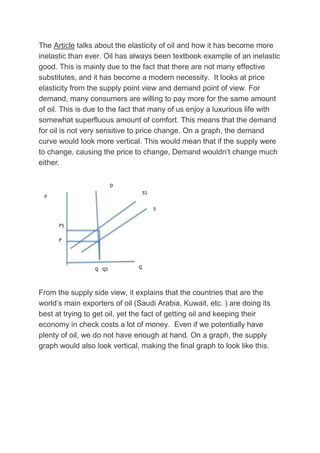
Oil has highly inelastic demand and supply curves in the short run. This means that any shifts in demand or supply will result in large price changes, as quantities demanded and supplied do not respond much to price changes in the short run. The article uses supply and demand graphs to illustrate how oil price increases in the 1970s resulted from OPEC restricting supply, as demand was inelastic. While high prices cause short term pain, in the long run they encourage fuel efficiency, alternative energy sources, and increased exploration and supply. The article argues for letting market forces, not price controls, determine oil prices over time.
![surprisingly, this speculative buying increased demand and drove up
prices still more.
Do you see it? Increased demand from U.S. motorists, from other
countries, and from speculators worried about even higher prices in the
future, coupled with supply cuts in Iraq and Nigeria caused oil prices to
increase. However, by late 2008 problems in U.S. mortgage lending set
off a crisis in global financial markets that led to a global economic
slowdown. The slowdown, in turn, caused a drop in demand for oil and
began pushing the price of oil back down. [Can you picture how a shift in
the demand curve can do this?] Once prices began to fall, speculators
who had purchased large volumes of oil expecting to be able to resell at
a higher future prices, began to lose money rapidly. To cut their losses
they dumped their supplies on the market hoping to unload them quickly
before prices fell further. Of course, this increased market supply and
drove down prices even more rapidly. Oil prices that peaked above
$140 per barrel in July 2008 had fallen to a mere $40 by December.
Waiting worked.
Rats. It didn't last. Unrest in the Middle East, accentuated by
popular uprisings in Tunisia, Egypt, Libya, Yemen, Bahrain and Syria
refueled speculative fears. Will lengthy civil wars break out across the
region? Will oil fields be destroyed? Will pipelines and transportation
corridors be shut off? As firms rushed to lock in supplies, demand
surged and prices soared back above $100 per barrel. By May 2011
domestic petrol prices once again approached $4.00 per gallon.
What now? Most expect the Mideast crises to stabilize and for oil
prices to bump back down. But, given the political instability in the many
major oil-exporting nations, coupled with inelastic demands and supplies
in the short run, the roller coaster price rides of recent decades are likely
to continue.
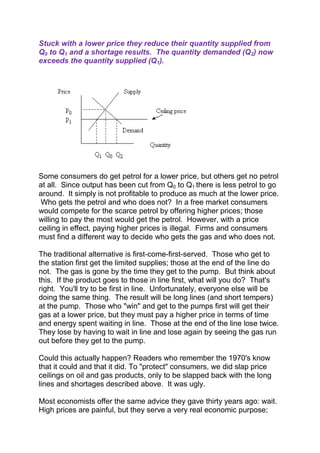
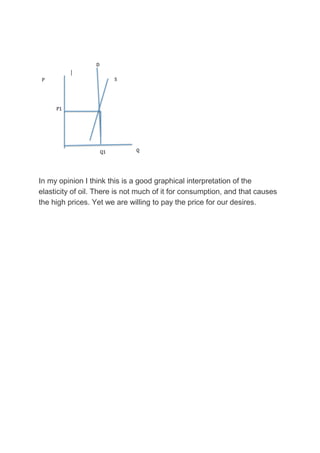
Lower prices?
Some argue that the government should step in and mandate lower
prices. Such schemes pander to populist preconceptions, but make little
economic sense. Are you ready for one last graph? Suppose the
government decides to lower petrol prices by decree and forbids
firms from charging any price higher than P1 in the graph below. In
economic jargon, P1 becomes a ceiling price. Consumers
immediately react to the lower price by increasing their quantity
demanded from Q0 to Q2. However firms react in the opposite way.](https://image.slidesharecdn.com/demandandsupplyapplied-131123154936-phpapp02/85/Demand-and-supply-applied-5-320.jpg)


![Manufacturing-account[1]](https://cdn.slidesharecdn.com/ss_thumbnails/manufacturing-account1-130307085801-phpapp01-thumbnail.jpg?width=640&height=640&fit=bounds)


