SlideShare a Scribd company logo
1 of 15
Download to read offline
October 2016 ©2016, Greater Houston Partnership Page 1
A Mushy Bottom — On September 28, the Organization of the Petroleum Exporting Countries
(OPEC) announced it had reached a tentative deal to cap production between 32.5 and 33.0
million barrels per day. The agreement would remove 0.5 to 1.0 million barrels from the global
market. Commodity traders reacted immediately to the news, boosting the spot price for West
Texas Intermediate (WTI) and Brent by $2 per barrel that day. September closed with WTI at
$48.24 and Brent at $49.24, nearly double their February lows.
OPEC hopes to set formal production quotas before the cartel meets again on November 30 in
Vienna. Quotas will be based on each member’s average production during the year. Libya and
Nigeria, which have suffered outages due to civil unrest, will receive higher quotas. Saudi
Arabia has agreed to let Iran boost its production to levels reached prior to the imposition of
economic sanctions in ’06. The oil ministers hope to bring nonmember producers such as Rus-
sia into the agreement as well.
The decision to limit production marks a reversal of the pump-at-will strategy OPEC adopted
in November ’14. What motivated OPEC to reverse course? The oil ministers didn’t offer any
explanations, but industry analysts have suggested a variety of reasons.
OPEC has grown impatient
waiting for demand to catch
up with supply. The initial
bump from lower prices has
evaporated. Growth remains
weak and the International
Monetary Fund has ratcheted
down its forecast several
times in recent years. With
each adjustment, the Interna-
tional Energy Agency has
ratcheted down its forecast
for crude demand as well.
The oil price collapse has wreaked havoc on member finances. In June, The Wall Street Journal
reported that OPEC countries ran a combined deficit of $99.6 billion in ’15, compared to a
surplus of $238.1 billion in ’14.
A publication of the Greater Houston Partnership Volume 25 Number 10 — October 2016
0.0
0.5
1.0
1.5
2.0
2.5
3.0
3.5
2.0
2.5
3.0
3.5
4.0
4.5
5.0
5.5
6.0
'10 '11 '12 '13 '14 '15 '16 '17
%Change,CrudeDemand
%Change,GlobalGDP
Sources: International Monetary Fund, International Energy Agency
Change in Global GDP and Crude Demand
Global GDP Crude Demand
HOUSTON—THE ECONOMY AT A GLANCE
October 2016 ©2016, Greater Houston Partnership Page 2
Without price relief, member na-
tions will be forced to impose addi-
tional domestic austerity meas-
ures. Public servants in Saudi Ara-
bia have seen their salaries cut 20
percent. The United Arab Emirates
has ended billions of dollars in do-
mestic subsidies. Venezuela suf-
fers severe food shortages. OPEC
ministers fear any more cutbacks
could lead to additional civil un-
rest.
U.S. production has proven more resilient than expected. Though the drilling fleet has lost
nearly 75 percent of its rigs, domestic production has slipped only 10 percent and the rate of
decline may be slowing.
The Saudis want to reassert their role as guardians of the oil market, recapturing the political
influence that goes with it. Bloomberg reports the Kingdom is willing to cut daily production
by 500,000 barrels to help the cartel reach its new production target.
If a formal accord is reached, WTI could to rise to the mid-$50s by the end of this year. Brent
would likely trade $1 to $2 above that. A number of firms, however―Goldman Sachs, Morgan
Stanley, and Citi Group among them―have expressed skepticism that OPEC will succeed in
cutting production and boosting prices. Members have a long history of ignoring production
quotas.
The news from OPEC comes at a time when the energy
industry already may have found a bottom, albeit a
mushy one. The spot price for WTI has rebounded from
its February low of $26 per barrel, trading in the low- to
mid-$40s prior to OPEC’s announcement. The U.S. fleet
has added 109 oil-directed drilling rigs since late May.
In a recent survey by the Federal Reserve Bank of Dal-
las, the number of energy firms reporting their outlook
has improved since the first quarter was double the num-
ber reporting a worsened outlook. The same survey
found the average price for firms to profitably drill a well
was $51 a barrel in the Permian, $53 in the Eagle Ford, and $55 in other parts of Texas. And a
recent Wood Mackenzie study found most U.S. exploration firms are “cash flow neutral” (i.e.,
their income matches their expenses) at $50 per barrel.
Selected Forecasts, West Texas Intermediate,
’17 Average Price
Forecaster $ Per Barrel
Raymond James $80
Merrill Lynch $69
Piper Jaffray $60
Ryan Sitton $60
Wells Fargo $55
Morgan Stanley $51
Goldman Sachs $45-50
Sources: Company websites, presentations
and media reports
7.0
7.5
8.0
8.5
9.0
9.5
10.0
Jan-14 Apr-14 Jul-14 Oct-14 Jan-15 Apr-15 Jul-15 Oct-15 Jan-16 Apr-16 Jul-16
MillionsofBarrels
Source: U.S. Energy Information Administration
Daily U.S. Crude Production
HOUSTON—THE ECONOMY AT A GLANCE
October 2016 ©2016, Greater Houston Partnership Page 3
If the low- to mid-$50s is the new threshold for profitability, how realistic is it to expect WTI
to hold above $50 without an OPEC agreement? Before OPEC’s announcement, a number of
investment banks and industry analysts had already forecast crude would range between $50
and $60 per barrel next year. In early October, WTI priced for February ’17 delivery traded at
$50.48 per barrel on the NYMEX. October ’17 deliveries traded at $53.38. And the U.S. En-
ergy Information Administration forecasts the spot price for WTI to average $52 a barrel in
Q3/17 and $57 in Q4/17.
Oil prices are notoriously volatile, and over the past two and half decades, WTI has traded as
high as $145 per barrel and sunk as low as $12. Over the long run, however, highs and lows
tend to offset each other and approach their long-term average. Economists refer to this phe-
nomenon as “reversion to the mean.” The long-term average may also be a reasonable expec-
tation for crude prices going forward. Few forecasters expect crude to fall below $30 in the
near future, and fewer still expect $100 oil any time soon. If one reviews the past 25 years of
price data, then adjusts for inflation, the long-term price for WTI has averaged $54 per barrel,
which is not too far from what analysts, the EIA, and the futures market suggest for WTI in
’17. With or without OPEC’s help, WTI should hit that mark sometime time next year.
We’re Not Who We Once Were — Houston has become smarter, more ethnically diverse,
and a bit older in recent years, but we still spend an hour a day commuting to and from work.
At least that’s what the most recent American Community Survey (ACS) tells us about the
region. The ACS is the U.S. Census Bureau’s annual snapshot of the nation’s economic, hous-
ing and social characteristics. The survey has been conducted every year since ’05. By exam-
ining the ACS data for the Houston metro area1
, numerous trends become apparent.
Hispanics will soon overtake
Anglos as the region’s largest
ethnic or racial group. The
transition should occur
within the next two years. On
average, the Hispanic popula-
tion grows by 65,000 resi-
dents each year, the Anglo
population by 9,000. In ’15,
the gap between the two pop-
ulations was fewer than
55,000 residents.
Hispanics have accounted for more than half the region’s population growth since ’05, Asians
and blacks around 17 percent, and whites just over 7 percent. No single race or ethnic group
has represented a majority of the region’s population since the late ’90s. Among the U.S.
1
The data reported for the American Community Survey are for the Houston-The Woodlands-Sugar Land Metropolitan Statistical
Area, which includes Austin, Brazoria, Chambers, Fort Bend, Galveston, Harris, Liberty, Montgomery and Waller Counties.
HOUSTON METRO AREA RACE AND ETHNICITY, '05 AND '15
------- ’15 ------- ------- ’05 -------
Estimate % Estimate %
Total population 6,656,946 100.0 5,193,448 100.0
Anglo 2,482,767 37.3 2,313,993 44.6
Hispanic 2,429,487 36.5 1,686,048 32.5
Black 1,122,767 16.9 830,445 16.0
Asian 497,099 7.5 290,923 5.6
American Indian 12,478 0.2 12,969 0.2
Hawaiian/Pacific Islander 1,522 0.1 3,502 0.1
Some other race 12,202 0.2 10,638 0.2
Two or more races 98,624 1.5 44,930 0.9
Source: American Community Surveys, ’05 and ’15
HOUSTON—THE ECONOMY AT A GLANCE
October 2016 ©2016, Greater Houston Partnership Page 4
metro areas, Houston has the nation’s fourth largest Hispanic population, seventh largest
black, seventh largest Asian, and 12th
largest Anglo.
Houston is growing older. In ’05, the median age for the region was 32.9 years. By ’15, it had
risen to 34.1. Still, Houston has a younger population than the nation, where the median age is
37.8 years. Houston is also the youngest among the 10 most populous metros.
The population balance has begun to shift. Children, adolescents and teenagers represented
31.2 percent of Houston’s population in ’05 but only 29.3 percent in ’15. Seniors (i.e., residents
65 and older) represented only 7.7 percent of the population in ’05 but 10.1 percent of the
population today.
Houstonians' average educa-
tional attainment is higher to-
day. Ten years ago, 78.7 per-
cent of Houstonians 25 and
older either had graduated
from high school or had
earned their GED certificate.
Today, 82.3 percent have.
Likewise, in ’05, 27.8 percent
held a bachelor’s or higher de-
gree. Today, 31.5 percent of
the adult population does.
Congestion remains a problem. The ACS reports that 3.0 million Houstonians commute to
work each day, up from 2.3 million in ’05. Ten years ago, 78.3 percent of all commuters drove
alone to work. Today, 80.7 percent drive alone. Only 2.2 percent of Houston commuters use
public transit, down from 2.8 percent in ’05. The share of Houstonians who work at home rose
from 2.9 to 3.7 percent over that period. Average travel time to work in ’15 was 30.2 minutes,
up from 28.1 minutes in ’05.
One in every 18 adults served in the U.S. military. The ratio jumps to one in six for adults over
65. Gulf War veterans (115,000) compose the largest group, followed by Vietnam era (91,000),
and Korean War (21,000). Fewer than 10,000 World War II veterans still live in Houston.
Disabilities are common among the population. One in 10 Houstonians responded to the ACS
that they have some form of impairment (e.g., hearing, vision, ambulatory, cognitive, self-care
or independent living). That ratio jumps to one in three for residents over 65. Some residents
have multiple disabilities.
Incomes have outpaced inflation. The median household income was $61,465 in ’15, meaning
half of all households earned more than that amount and half earned less. The median house-
hold income for Houston was $46,706 in ’05. Adjusted for inflation, that would be $56,681 in
’15.
EDUCATION ATTAINMENT, METRO HOUSTON, POPULATION 25 AND OLDER
Highest Level of Education ’15 Pop % ’05 Pop %
Less than 9th grade 408,571 9.6 330,497 10.3
9th to 12th grade, no diploma 342,291 8.1 352,958 11.0
High school graduate 991,115 23.4 789,342 24.6
Some college, no degree 881,499 20.8 654,576 20.4
Associate's degree 281,166 6.6 186,105 5.8
Bachelor's degree 851,162 20.1 596,820 18.6
Graduate or professional degree 485,577 11.4 298,410 9.3
High school graduate or higher 3,490,519 82.3 2,525,252 78.7
Bachelor's degree or higher 1,336,739 31.5 895,229 27.9
Population 25 years and over 4,241,381 100.0 3,208,707 100.0
Note: Total may not sum evenly due to rounding
Source: American Community Surveys, ’05 and ’15
HOUSTON—THE ECONOMY AT A GLANCE
October 2016 ©2016, Greater Houston Partnership Page 5
Houston has more middle class and affluent households than before. The ACS recorded
494,000 households earning between $100,000 and $200,000 in ’15, up from 273,000 in ’05.
The ACS also reported 197,000 households in Houston with incomes of $200,000 or more in
’15, triple the 65,500 households in ’05. Given the recent layoffs in the energy industry, the
number of households in the upper bracket will likely slip in the next report.
Fewer Houstonians are uninsured. In ’09, 75.4 percent of Houstonians had health insurance.
In ’15, 82.7 percent had coverage. (Insurance data were not collected prior to ’09.)
Houston continues to draw residents from abroad. The ’14 ACS found that nearly 1.6 million
Houstonians were born outside the U.S., up from 1.1 million in ’05. Nearly a quarter (23.7
percent) of all Houstonians are foreign born—roughly double one in eight (13.4 percent) for
the nation as a whole. The bulk of immigrants came from Latin America, followed by Asia,
Africa, and Europe in that order. About one-third of Houston’s population growth over the
past 10 years, 460,000 new residents, can be attributed to immigration.
But not all growth comes from domestic migration and foreign immigration. The ACS re-
ported that 100,000 births occurred in Houston last year, of which 32.4 percent were to un-
married women, compared to 28.2 percent in ’05.
Metro Area Still on Top — Houston shipped more than $97.1 billion in goods and commod-
ities overseas in ’15, marking the fourth consecutive year in which the metro area led the nation
in exports. New York, with
$95.6 billion, ranked sec-
ond, and Seattle, with $67.2
billion, ranked third. The
data come from the U.S.
Metropolitan Area Exports,
2015 report recently re-
leased by the U.S. Interna-
tional Trade Administration.
Houston retained the top
spot even though the re-
gion’s exports fell 18.4 per-
cent from a peak of $119.0
billion in ’14. Lower oil
prices reduced the value of
Houston’s leading export,
petroleum products. The strong U.S. dollar made other goods produced and sold from Houston
less affordable, further reducing shipments. Houston suffered the worst drop among the na-
tion’s 20 largest metro areas, but managed to hold onto its place as the nation’s leading ex-
porter. This is only the second time in the past 10 years that Houston’s export value has de-
clined.
Petroleum
Products
$27.0B, 27.9%
Chemicals
$26.1B, 26.9%
Machinery
$12.1B, 12.5%
Oil and Gas
Extraction
$7.0B, 7.2%
Computer and
Electronics
$6.9B, 7.1%
All Others
$17.8B, 18.4%
'15 Metro Houston Exports
Source: U.S. International Trade Administration
HOUSTON—THE ECONOMY AT A GLANCE
October 2016 ©2016, Greater Houston Partnership Page 6
Houston’s top export destination was Mexico ($15.9 billion), followed by Canada ($10.3 bil-
lion), China ($6.7 billion), Brazil ($4.8 billion) and The Netherlands ($4.3 billion).
Firm Grip on Fourth Place — Metro Houston’s gross domestic product (GDP) totaled $503.3
billion in ’15, according to recent estimates by the U.S. Bureau of Economic Analysis (BEA).
That’s down 3.6 percent from $522.0 billion in ’14. Houston’s economy still ranks fourth
among U.S. metros, behind New York, Los Angeles and Chicago, but ahead of Washington,
D.C. and Dallas-Fort Worth. Though Dallas-Fort Worth grew, Washington, D.C. grew faster,
and as a result the DFW Metroplex slipped to sixth place.
20 Largest U.S. Metro Economies – ’15
Rank Metro Area GDP $ Billions
% Change
’14 – ’15
Rank Metro Area GDP $ Billions
% Change
’14 – ’15
1 New York $1,602.7 4.3 11 Miami $317.9 6.0
2 Los Angeles 930.8 5.8 12 Seattle 313.7 5.2
3 Chicago 640.7 5.2 13 Minneapolis-St. Paul 248.8 4.7
4 Houston 503.3 -3.6 14 Detroit 245.6 5.3
5 Washington 491.0 3.5 15 San Jose 235.2 10.4
6 Dallas-Fort Worth 485.7 1.5 16 San Diego 220.6 4.8
7 San Francisco 431.7 5.8 17 Phoenix 219.9 4.2
8 Philadelphia 411.2 3.5 18 Denver 193.2 2.7
9 Boston 396.6 4.6 19 Baltimore 181.4 4.0
10 Atlanta 339.2 5.3 20 Portland 158.8 6.5
Source: U.S. Bureau of Economic Analysis
No Sign of Recovery — Houston’s office woes continue. Absorption totaled -800,000 square
feet through the first nine months of ’16. That’s likely to exceed -1.0 million by the end of the
year. The “direct” vacancy rate is in the mid-teens. The “effective” rate, which includes sub-
lease space, approaches 20 percent.
Nearly 12 million square feet of sublease space is on the market; another half million is ex-
pected to hit in the fourth quarter. The average sublet asking rent is about $7 per square foot
less than the asking rent for direct space. Sublease space now competes head-to-head with
direct space, forcing some landlords to offer generous concessions to retain or attract tenants.
Of the meager leasing activity in the third quarter, notes JLL, less than one-fifth of the space
went to firms new to Houston or existing firms expanding their footprint in the market.
Houston’s overall office market will need to absorb nearly 10.5 million square feet to return to
the 20-year average availability of 16 percent, CBRE notes. The firm forecasts it will take three
to five years for downtown to recover, perhaps longer for West Houston and the Energy Cor-
ridor. Greenspoint/North Belt, with a vacancy rate in the mid- to low-40s, faces an even more
uncertain future. Factoring in the typical lag between an economic upturn and the eventual
impact on real estate, the office market probably won’t tighten until ’19 or ’20, according to
Newmark Grubb Knight Frank.
HOUSTON—THE ECONOMY AT A GLANCE
October 2016 ©2016, Greater Houston Partnership Page 7
Don’t expect the recent rebound in oil prices to spur the oil and gas industry to go on a leasing
spree. Even with a price recovery, hiring, and thus office transactions, will remain subdued.
According to JLL, about one-third of Houston’s lease activity in the third quarter involved
professional service firms, another third
from transportation-related firms, but only
13 percent involved energy firms or utili-
ties. In the decade of the ’90s, a period of
chronically low oil prices, the energy indus-
try added only 2,100 jobs while the market
absorbed 24 million square feet of office
space. Even in a period of minimal growth
in the energy industry, Houston office mar-
ket can post positive absorption.
Developers broke ground on only three buildings in the third quarter; between 2.3 and 3.3
million square feet is now under construction. While that’s good news for the office market,
that doesn’t bode well for the construction industry, which will have to scramble to find work
in Houston next year and likely into ’18 as well.
Employment Update — Metro Houston created 500 jobs in August, according to the Texas
Workforce Commission (TWC). Though one of the weakest reports for August in recent his-
tory, the data reflect an improvement over August ’15, when the region lost 800 jobs. The
report also suggests that employment in several sectors hit hard in the downturn—mining and
logging; trade, transportation, and utilities; and professional services—may be stabilizing, al-
beit at much lower levels than 18 months ago. Though August employment numbers will be
revised later this month and again in March ’17, at first blush, the numbers look promising.
In the 12 months ending August ’16, Houston created 14,200 jobs. That performance is far
weaker than 46,400 jobs in the 12 months ending August ’15. One must remember that the
August ’15 total included the last four months of ’14, a period in which the region created more
than 73,000 jobs. Those last four months offset the following eight months of job losses, mask-
ing just how weak Houston’s economy was in early ’15. One should note that during the current
downturn, TWC has yet to report a 12-month period in which Houston lost employment.
The region, however, has not recouped the seasonal loss of 47,800 jobs that occurred in January
’16. Layoffs of this magnitude occur every year as workers hired for the holiday season are
dismissed and restructuring decisions made in the fall are acted upon. As growth resumes in
February, the region usually returns to its previous employment peak by May or June. That
hasn’t been the case this year. Though Houston has recorded net employment gains in five of
the past seven months, those gains have not been enough to offset January’s losses. The region
remains 27,500 jobs below its previous peak.
September through December are typically strong months for job growth in Houston. Payrolls
HOUSTON OFFICE MARKET SNAPSHOT - Q3/16
% Direct % W/Sublease
Sublease
MM Sq Ft
CBRE 15.6 20.9 11.4
JLL 16.8 19.7 12.2
Newmark Grubb 17.0 19.4 11.7
Transwestern 13.8 15.6 11.8
Note: Firms differ in how the define the market and whether they include
owner-occupied buildings in the mix, hence the variation in the numbers.
Source: Real estate firms quarterly reports
HOUSTON—THE ECONOMY AT A GLANCE
October 2016 ©2016, Greater Houston Partnership Page 8
expand as stores, hotels, restaurants and bars hire additional help for the holidays, transporta-
tion firms hire drivers and package sorters for the shipping season, school districts and univer-
sities contract for additional staff to handle larger fall enrollments, and businesses take on tem-
porary workers to help meet year-end deadlines. In boom times, Houston may add 40,000 to
60,000 jobs in the latter part of the year. In lean times, 18,000 to 20,000 is typical. Given the
historical pattern, and the suggestion from the data in this month’s jobs report that the worst of
the local layoffs are over, Houston may finish the year with a slight net job gain.
The big losers in the jobs report were the construction (-2,400 jobs) and manufacturing sectors
(-1,500 jobs). Construction employment will soften as office and chemical plant work winds
down. The big winners were education and health care (+3,600 jobs); trade, transportation, and
utilities (+3,200 jobs); and professional services (+1,600 jobs). The job gains in TTU came
primarily from retail as merchants began hiring to fill stores recently opened. The job gains in
professional services came mainly from employment services (i.e., contract workers), an in-
dustry in which job gains and losses are highly correlated with Houston’s business cycle.
Mining and logging (i.e., oil and gas extraction and oil field services) gained 1,200 jobs. The
industry probably didn’t create that many jobs in August. More likely, TWC adjusted August
employment data to compensate for overestimating job cuts earlier in the year. Government
shed 5,100 jobs in August,in line with the five-year average of 5,000 jobs lost in a typical
August. The sector usually adds 15,000-20,000 jobs in September as teachers and administra-
tors return to work. Education employment will likely reach a new peak this fall.
Save the Date — The Greater Houston Partner-
ship’s 2017 Economic Outlook event is sched-
uled for Friday, December 9, 10 a.m. at the
Royal Sonesta Hotel. This year's event will fea-
ture a keynote from Dr. Kevin Swift, chief
economist and managing director at the Ameri-
can Chemistry Council. Dr. Swift is responsible for economic and other analyses dealing with
policy issues as well as the business environment and the benefits of chemistry.
KHOU-11 news anchor Shern-min Chow will moderate this year’s panel discussion as local
business leaders from various industries will share their perspective on the region's economy.
This year’s panel of experts includes:
 Energy: Vicki Hollub, CEO, Occidental Petroleum;
 Banking: John Sotoodeh, Regional Banking Executive, Wells Fargo;
 Real Estate: Richard J. Campo, Chairman and CEO, Camden Property Trust; and
 Health Care: Marc L. Boom, M.D., President and CEO, Houston Methodist.
Partnership Senior Vice President of Research, Patrick Jankowski, will also review the Part-
nership's employment forecast for 2017. Additional details about the event and how to pur-
chase tickets are available at the Partnership’s website.
HOUSTON—THE ECONOMY AT A GLANCE
October 2016 ©2016, Greater Houston Partnership Page 9
SNAPSHOT — KEY ECONOMIC INDICATORS
Aviation — The Houston Airport System handled 36.7 million passengers through the first
eight months of this year, down 0.2 percent from the 36.8 million handled over the same period
in ’15. Domestic passengers totaled 28.7 million, down 2.8 percent from 29.5 million handled
YTD in ’15. International passengers totaled 8.1 million, up 10.4 percent from the 7.3 million
handled YTD in ’15.
Building Permits — City of Houston building permits totaled $413.0 million in August ’16,
down 32.9 percent from $615.0 million in August ’15, according to the City’s Department of
Public Works & Engineering Planning & Development Services. Year-to-date, city building
permits totaled $4.8 billion, down 11.3 percent from $5.5 billion over the same period in ’15.
Inflation — The cost of consumer goods and services as measured by the Consumer Price
Index for All Urban Consumers (CPI-U) rose 1.1 percent nationwide from August ’15 to Au-
gust ’16, according to the U.S. Bureau of Labor Statistics. Core inflation (all items less the
volatile food and energy categories) increased 2.3 percent since August ’15.
Home Sales — Houston-area single-family home sales rose 8.2 percent from 7,314 in August
’15 to 7,914 in August ’16. The August total is the most ever for a single month in metro
Houston, according to the Houston Association of RealtorsÂź (HAR). Year to date, single-
family home sales total 51,457, up 1.6 percent from 50,660 sales during the same period in
’15. The median price for a single-family home sold in metro Houston rose 4.2 percent to
$225,000, compared to $216,000 in August of last year. The average sales price rose 2.4 per-
cent to $289,613.
Vehicle Sales — Houston-area auto dealers sold 28,399 vehicles in August, a 7.2 percent
decrease from the 30,588 sold in August the previous year, according to TexAuto Facts, pub-
lished by InfoNation, Inc. of Sugar Land. August marks the eighth consecutive month of over-
the-year declines in vehicle sales, despite being the strongest month of sales since October
’15.
Purchasing Managers Index — The Houston Purchasing Managers Index (PMI), a short-
term leading indicator for regional production, registered 46.1 in August, up from 43.8 in July,
according to the latest report from the Institute for Supply Management-Houston (ISM-
Houston). With the August reading, the PMI has signaled economic contraction in Houston
for 20 consecutive months.
Sales Tax Collections — City of Houston sales tax collections totaled $477.5 million through
September of this year, down 4.5 percent from $499.9 million from the same period last year.
HOUSTON—THE ECONOMY AT A GLANCE
October 2016 ©2016, Greater Houston Partnership Page 10
Patrick Jankowski, Josh Pherigo,
and Jenny Philip
contributed to this issue of
Houston: The Economy at a Glance
STAY UP TO DATE!
To access past issues of Economy at a Glance, please click here.
If you are a not a member of the Greater Houston Partnership and would like to subscribe to
Economy at a Glance, please click here and enter your email address. For information about
joining the Greater Houston Partnership, call Member Engagement at 713-844-3683.
The Key Economic Indicators table is updated whenever any data change — typically, 11 or so
times per month. If you would like to receive these updates by e-mail, usually accompanied by
commentary, please email your request for Key Economic Indicators to aellis@housto.org with
your name, title and phone number and your company’s name and address.
HOUSTON—THE ECONOMY AT A GLANCE
October 2016 ©2016, Greater Houston Partnership Page 11
HOUSTON—THE ECONOMY AT A GLANCE
October 2016 ©2016, Greater Houston Partnership Page 12
Houston Economic Indicators
A Service of the Greater Houston Partnership
Most Year % Most Year %
Month Recent Earlier Change Recent Earlier Change
ENERGY
U.S. Active Rotary Rigs Sep '16 509 848 -40.0 487 * 1,059 * -54.0
Spot Crude Oil Price ($/bbl, West Texas Intermediate) Aug '16 44.72 42.87 4.3 40.87 * 51.63 * -20.8
Spot Natural Gas ($/MMBtu, Henry Hub) Aug '16 2.82 2.77 1.8 2.26 * 2.82 * -19.9
UTILITIES AND PRODUCTION
Houston Purchasing Managers Index Aug '16 46.1 47.3 -2.5 45.0 * 46.8 * -3.8
Nonresidential Electric Current Sales (Mwh, CNP Service Area) Aug '16 5,314,931 5,184,990 2.5 38,204,095 37,339,247 2.3
CONSTRUCTION
Total Building Contracts ($, Houston MSA) Aug '16 1,168,310,000 1,323,070,000 -11.7 9,831,800,000 11,993,980,000 -18.0
Nonresidential Aug '16 441,418,000 472,999,000 -6.7 3,788,786,000 4,781,003,000 -20.8
Residential Aug '16 726,892,000 850,071,000 -14.5 6,043,014,000 7,212,977,000 -16.2
Building Permits ($, City of Houston) Aug '16 412,972,876 615,000,608 -32.9 4,840,326,510 5,459,252,302 -11.3
Nonresidential Aug '16 261,853,368 390,417,722 -32.9 3,245,225,184 3,481,194,433 -6.8
New Nonresidential Aug '16 133,358,107 227,753,872 -41.4 1,326,376,838 1,787,125,207 -25.8
Nonresidential Additions/Alterations/Conversions Aug '16 128,495,261 162,663,850 -21.0 1,918,848,346 1,694,069,226 13.3
Residential Aug '16 151,119,508 224,582,886 -32.7 1,595,101,326 1,978,057,869 -19.4
New Residential Aug '16 127,097,467 180,377,993 -29.5 1,210,805,545 1,780,598,080 -32.0
Residential Additions/Alterations/Conversions Aug '16 24,022,041 44,204,893 -45.7 384,295,781 197,459,789 94.6
Multiple Listing Service (MLS) Activity
Property Sales Aug '16 9,319 8,699 7.1 61,613 61,054 0.9
Median Sales Price - SF Detached Aug '16 225,000 216,000 4.2 219,187 * 212,100 * 3.3
Active Listings Aug '16 38,056 33,856 12.4 35,170 * 30,381 * 15.8
EMPLOYMENT (Houston-Sugar Land-Baytown MSA)
Nonfarm Payroll Employment Aug '16 2,993,400 2,979,200 0.5 2,990,088 * 2,979,376 * 0.4
Goods Producing (Natural Resources/Mining/Const/Mfg) Aug '16 532,200 560,000 -5.0 539,775 0 569,213 * -5.2
Service Providing Aug '16 2,461,200 2,419,200 1.7 2,450,313 0 2,410,163 * 1.7
Unemployment Rate (%) - Not Seasonally Adjusted
Houston-Sugar Land-Baytown MSA Aug '16 5.8 4.9 5.1 * 4.6 *
Texas Aug '16 5.0 4.6 4.6 * 4.5 *
U.S. Aug '16 5.0 5.2 5.0 * 5.5 *
TRANSPORTATION
Port of Houston Authority Shipments (Short Tons) July '16 3,893,616 3,654,829 6.5 26,096,412 28,222,939 -7.5
Air Passengers (Houston Airport System) Aug '16 4,605,137 4,789,130 -3.8 36,714,840 36,771,039 -0.2
Domestic Passengers Aug '16 3,569,747 3,782,749 -5.6 28,662,150 29,479,777 -2.8
International Passengers Aug '16 1,035,390 1,006,381 2.9 8,052,690 7,291,262 10.4
Landings and Takeoffs Aug '16 68,268 67,499 1.1 525,101 536,245 -2.1
Air Freight (metric tons) Aug '16 33,147 32,350 2.5 266,409 275,328 -3.2
Enplaned Aug '16 15,673 16,776 -6.6 129,215 143,171 -9.7
Deplaned Aug '16 17,475 15,574 12.2 137,194 132,157 3.8
CONSUMERS
New Car and Truck Sales (Units, Houston MSA) Aug '16 28,399 30,588 -7.2 204,307 255,154 -19.9
Cars Aug '16 9,934 12,058 -17.6 74,404 104,243 -28.6
Trucks, SUVs and Commercials Aug '16 18,465 18,530 -0.4 129,903 150,911 -13.9
Total Retail Sales ($000,000, Houston MSA, NAICS Basis) Q4/15 31,941 35,393 -9.8 112,143 125,047 -10.3
Consumer Price Index for All Urban Consumers ('82-'84=100)
Houston-Galveston-Brazoria CMSA Aug '16 216.573 214.652 0.9 215.747 * 212.662 * 1.5
United States Aug '16 240.853 238.316 1.1 239.274 * 236.820 * 1.0
Hotel Performance (Houston MSA)
Occupancy (%) Q2/16 66.2 71.1 65.9 * 70.6 *
Average Room Rate ($) Q2/16 110.75 112.10 -1.2 107.96 * 108.09 * -0.1
Revenue Per Available Room ($) Q2/16 73.29 79.70 -8.0 71.07 * 76.28 * -6.8
YEAR-TO-DATE TOTAL or
YTD AVERAGE*MONTHLY DATA
HOUSTON—THE ECONOMY AT A GLANCE
October 2016 ©2016, Greater Houston Partnership Page 13
Sources
Rig Count Baker Hughes Incorporated
Spot WTI, Spot Natural Gas U.S. Energy Information Admin.
Houston Purchasing Managers National Association of
Index Purchasing Management –
Houston, Inc.
Electricity CenterPoint Energy
Building Construction Contracts McGraw-Hill Construction
City of Houston Building Permits Building Permit Department,
City of Houston
MLS Data Houston Association of Realtors
Employment, Unemployment Texas Workforce Commission
Port Shipments Port of Houston Authority
Aviation Aviation Department, City of
Houston
Car and Truck Sales TexAuto Facts Report, InfoNation, Inc.,
Sugar Land TX
Retail Sales Texas Comptroller’s Office
Consumer Price Index U.S. Bureau of Labor Statistics
Hotels PKF Consulting/HospitalityAsset
Advisors International
Postings, Foreclosures Foreclosure Information &Listing
Service
HOUSTON—THE ECONOMY AT A GLANCE
October 2016 ©2016, Greater Houston Partnership Page 14
-150
-120
-90
-60
-30
0
30
60
90
120
150
2,000
2,100
2,200
2,300
2,400
2,500
2,600
2,700
2,800
2,900
3,000
3,100
'06 '07 '08 '09 '10 '11 '12 '13 '14 '15 '16 '17
12-MonthChange(000)
NonfarmPayrollEmployment(000)
Source: Texas Workforce Commission
Nonfarm Payroll Employment, Houston MSA
12-Month Change Total Payroll Employment
1,800
1,900
2,000
2,100
2,200
2,300
2,400
2,500
420
460
500
540
580
620
'06 '07 '08 '09 '10 '11 '12 '13 '14 '15 '16 '17
Service-ProvidingJobs(000s)
Goods-ProducingJobs(000s)
Source: Texas Workforce Commission
Goods-Producing and Service-Providing Employment
Houston MSA
Goods-Producing Jobs Service-Providing Jobs
HOUSTON—THE ECONOMY AT A GLANCE
October 2016 ©2016, Greater Houston Partnership Page 15
3
4
5
6
7
8
9
10
11
'06 '07 '08 '09 '10 '11 '12 '13 '14 '15 '16 '17
%CivilianLaborForce
Source: Texas Workforce Commission
Unemployment Rate - Houston, Texas and U.S.
Houston Texas U.S.
0
2
4
6
8
10
12
14
16
0
20
40
60
80
100
120
140
160
'06 '07 '08 '09 '10 '11 '12 '13 '14 '15 '16 '17
NaturalGas,$/MMBtu
WTI,$barrel
Source: U.S. Energy Information Administration
Spot Crude and Natural Gas Prices
Monthly Averages
WTI Natural Gas

More Related Content

What's hot

New base special 31 july 2014
New base special  31 july 2014New base special  31 july 2014
New base special 31 july 2014Khaled Al Awadi
 
Oil price - Demand or supply factors at work
Oil price - Demand or supply factors at workOil price - Demand or supply factors at work
Oil price - Demand or supply factors at workradhikaburman
 
Nigeria_s_Oil_Revenue_Crunch_web
Nigeria_s_Oil_Revenue_Crunch_webNigeria_s_Oil_Revenue_Crunch_web
Nigeria_s_Oil_Revenue_Crunch_webPatrick Rankowitz
 
Bord GĂĄis Energy Index November 2015
Bord GĂĄis Energy Index November 2015Bord GĂĄis Energy Index November 2015
Bord GĂĄis Energy Index November 2015Bord GĂĄis Energy
 
An Investigation of Crude Oil and its Implication for Financial Markets
An Investigation of Crude Oil and its Implication for Financial Markets An Investigation of Crude Oil and its Implication for Financial Markets
An Investigation of Crude Oil and its Implication for Financial Markets Priesnell Warren ✔
 
EY Price Point: Global Oil and Gas Market Outlook - Q3
EY Price Point: Global Oil and Gas Market Outlook - Q3EY Price Point: Global Oil and Gas Market Outlook - Q3
EY Price Point: Global Oil and Gas Market Outlook - Q3EY
 
BMA Capital - E&p crude oil bleak outlook on oversupply and weak macros
BMA Capital - E&p crude oil bleak outlook on oversupply and weak macrosBMA Capital - E&p crude oil bleak outlook on oversupply and weak macros
BMA Capital - E&p crude oil bleak outlook on oversupply and weak macrosbmacapital
 
Devaluation of Crude Oil and its Impact on World Economy
Devaluation of Crude Oil and its Impact on World EconomyDevaluation of Crude Oil and its Impact on World Economy
Devaluation of Crude Oil and its Impact on World EconomyRushita Thakkar
 
U.S. Petrochemical Industry Future - Upstream - Crude Oil - Logic Versus Fai...
U.S. Petrochemical Industry Future -  Upstream - Crude Oil - Logic Versus Fai...U.S. Petrochemical Industry Future -  Upstream - Crude Oil - Logic Versus Fai...
U.S. Petrochemical Industry Future - Upstream - Crude Oil - Logic Versus Fai...Bruce LaCour
 
Energy trading scenario 2016
Energy trading scenario 2016Energy trading scenario 2016
Energy trading scenario 2016Financial Algorithms
 
Countering peak oil ERM 02
Countering peak oil ERM 02Countering peak oil ERM 02
Countering peak oil ERM 02Sandip Sen
 
The breathtaking decline
The breathtaking declineThe breathtaking decline
The breathtaking declineanvithaphutane
 
Cheaper Oil - Markaz Research (Bilingual)
Cheaper Oil - Markaz Research (Bilingual)Cheaper Oil - Markaz Research (Bilingual)
Cheaper Oil - Markaz Research (Bilingual)Karthik Ramesh
 
Commodity markets outlook
Commodity markets outlookCommodity markets outlook
Commodity markets outlookDr Lendy Spires
 
Oil addtiction and ISIS - SOAN 265 Sam Brown Gabriel Nunez Jon Ross Final Pap...
Oil addtiction and ISIS - SOAN 265 Sam Brown Gabriel Nunez Jon Ross Final Pap...Oil addtiction and ISIS - SOAN 265 Sam Brown Gabriel Nunez Jon Ross Final Pap...
Oil addtiction and ISIS - SOAN 265 Sam Brown Gabriel Nunez Jon Ross Final Pap...Gabriel Nunez
 
Weltweiter IPO-Markt schwÀchelt
Weltweiter IPO-Markt schwÀcheltWeltweiter IPO-Markt schwÀchelt
Weltweiter IPO-Markt schwÀcheltEY
 

What's hot (20)

New base special 31 july 2014
New base special  31 july 2014New base special  31 july 2014
New base special 31 july 2014
 
Oil price - Demand or supply factors at work
Oil price - Demand or supply factors at workOil price - Demand or supply factors at work
Oil price - Demand or supply factors at work
 
PMCWeeklyReview_082115
PMCWeeklyReview_082115PMCWeeklyReview_082115
PMCWeeklyReview_082115
 
Nigeria_s_Oil_Revenue_Crunch_web
Nigeria_s_Oil_Revenue_Crunch_webNigeria_s_Oil_Revenue_Crunch_web
Nigeria_s_Oil_Revenue_Crunch_web
 
Bord GĂĄis Energy Index November 2015
Bord GĂĄis Energy Index November 2015Bord GĂĄis Energy Index November 2015
Bord GĂĄis Energy Index November 2015
 
Factors affecting demand and supply of oil
Factors affecting demand and supply of oilFactors affecting demand and supply of oil
Factors affecting demand and supply of oil
 
An Investigation of Crude Oil and its Implication for Financial Markets
An Investigation of Crude Oil and its Implication for Financial Markets An Investigation of Crude Oil and its Implication for Financial Markets
An Investigation of Crude Oil and its Implication for Financial Markets
 
EY Price Point: Global Oil and Gas Market Outlook - Q3
EY Price Point: Global Oil and Gas Market Outlook - Q3EY Price Point: Global Oil and Gas Market Outlook - Q3
EY Price Point: Global Oil and Gas Market Outlook - Q3
 
BMA Capital - E&p crude oil bleak outlook on oversupply and weak macros
BMA Capital - E&p crude oil bleak outlook on oversupply and weak macrosBMA Capital - E&p crude oil bleak outlook on oversupply and weak macros
BMA Capital - E&p crude oil bleak outlook on oversupply and weak macros
 
Devaluation of Crude Oil and its Impact on World Economy
Devaluation of Crude Oil and its Impact on World EconomyDevaluation of Crude Oil and its Impact on World Economy
Devaluation of Crude Oil and its Impact on World Economy
 
U.S. Petrochemical Industry Future - Upstream - Crude Oil - Logic Versus Fai...
U.S. Petrochemical Industry Future -  Upstream - Crude Oil - Logic Versus Fai...U.S. Petrochemical Industry Future -  Upstream - Crude Oil - Logic Versus Fai...
U.S. Petrochemical Industry Future - Upstream - Crude Oil - Logic Versus Fai...
 
SPRE 2017 oil price outlook final
SPRE 2017 oil price outlook finalSPRE 2017 oil price outlook final
SPRE 2017 oil price outlook final
 
Energy trading scenario 2016
Energy trading scenario 2016Energy trading scenario 2016
Energy trading scenario 2016
 
Countering peak oil ERM 02
Countering peak oil ERM 02Countering peak oil ERM 02
Countering peak oil ERM 02
 
Lower for Longer
Lower for LongerLower for Longer
Lower for Longer
 
The breathtaking decline
The breathtaking declineThe breathtaking decline
The breathtaking decline
 
Cheaper Oil - Markaz Research (Bilingual)
Cheaper Oil - Markaz Research (Bilingual)Cheaper Oil - Markaz Research (Bilingual)
Cheaper Oil - Markaz Research (Bilingual)
 
Commodity markets outlook
Commodity markets outlookCommodity markets outlook
Commodity markets outlook
 
Oil addtiction and ISIS - SOAN 265 Sam Brown Gabriel Nunez Jon Ross Final Pap...
Oil addtiction and ISIS - SOAN 265 Sam Brown Gabriel Nunez Jon Ross Final Pap...Oil addtiction and ISIS - SOAN 265 Sam Brown Gabriel Nunez Jon Ross Final Pap...
Oil addtiction and ISIS - SOAN 265 Sam Brown Gabriel Nunez Jon Ross Final Pap...
 
Weltweiter IPO-Markt schwÀchelt
Weltweiter IPO-Markt schwÀcheltWeltweiter IPO-Markt schwÀchelt
Weltweiter IPO-Markt schwÀchelt
 

Viewers also liked

Sample Appraisal Report Industrial
Sample Appraisal Report IndustrialSample Appraisal Report Industrial
Sample Appraisal Report Industrialcutmytaxes
 
April disbursement-reports-hcad
April disbursement-reports-hcadApril disbursement-reports-hcad
April disbursement-reports-hcadcutmytaxes
 
Spring 2016 course schedule MCAD
Spring 2016 course schedule MCADSpring 2016 course schedule MCAD
Spring 2016 course schedule MCADcutmytaxes
 
FY 2016 adopted budget book CCAD
FY 2016 adopted budget book CCADFY 2016 adopted budget book CCAD
FY 2016 adopted budget book CCADcutmytaxes
 
Galveston central appraisal district reappraisalplan 2015 2016
Galveston central appraisal district reappraisalplan 2015 2016Galveston central appraisal district reappraisalplan 2015 2016
Galveston central appraisal district reappraisalplan 2015 2016cutmytaxes
 
Brazoriacad plan
Brazoriacad planBrazoriacad plan
Brazoriacad plancutmytaxes
 
Brazoria trust list
Brazoria trust listBrazoria trust list
Brazoria trust listcutmytaxes
 
2016 property tax case summaries
2016 property tax case summaries2016 property tax case summaries
2016 property tax case summariescutmytaxes
 
Us taxation of foreign nationals
Us taxation of foreign nationalsUs taxation of foreign nationals
Us taxation of foreign nationalscutmytaxes
 
Business personal property rendition GCAD
Business personal property rendition GCADBusiness personal property rendition GCAD
Business personal property rendition GCADcutmytaxes
 
Fbcad financial report
Fbcad financial reportFbcad financial report
Fbcad financial reportcutmytaxes
 
Pasa demo graphic update wcad
Pasa demo graphic update wcadPasa demo graphic update wcad
Pasa demo graphic update wcadcutmytaxes
 
Texas housing market 2016
Texas housing market 2016Texas housing market 2016
Texas housing market 2016cutmytaxes
 
Commercial realestate market overview 2016
Commercial realestate market overview 2016Commercial realestate market overview 2016
Commercial realestate market overview 2016cutmytaxes
 
Updated property tax information for texas taxpayers
Updated property tax information for texas taxpayersUpdated property tax information for texas taxpayers
Updated property tax information for texas taxpayerscutmytaxes
 
FY17 population report HCAD
FY17 population report HCADFY17 population report HCAD
FY17 population report HCADcutmytaxes
 

Viewers also liked (16)

Sample Appraisal Report Industrial
Sample Appraisal Report IndustrialSample Appraisal Report Industrial
Sample Appraisal Report Industrial
 
April disbursement-reports-hcad
April disbursement-reports-hcadApril disbursement-reports-hcad
April disbursement-reports-hcad
 
Spring 2016 course schedule MCAD
Spring 2016 course schedule MCADSpring 2016 course schedule MCAD
Spring 2016 course schedule MCAD
 
FY 2016 adopted budget book CCAD
FY 2016 adopted budget book CCADFY 2016 adopted budget book CCAD
FY 2016 adopted budget book CCAD
 
Galveston central appraisal district reappraisalplan 2015 2016
Galveston central appraisal district reappraisalplan 2015 2016Galveston central appraisal district reappraisalplan 2015 2016
Galveston central appraisal district reappraisalplan 2015 2016
 
Brazoriacad plan
Brazoriacad planBrazoriacad plan
Brazoriacad plan
 
Brazoria trust list
Brazoria trust listBrazoria trust list
Brazoria trust list
 
2016 property tax case summaries
2016 property tax case summaries2016 property tax case summaries
2016 property tax case summaries
 
Us taxation of foreign nationals
Us taxation of foreign nationalsUs taxation of foreign nationals
Us taxation of foreign nationals
 
Business personal property rendition GCAD
Business personal property rendition GCADBusiness personal property rendition GCAD
Business personal property rendition GCAD
 
Fbcad financial report
Fbcad financial reportFbcad financial report
Fbcad financial report
 
Pasa demo graphic update wcad
Pasa demo graphic update wcadPasa demo graphic update wcad
Pasa demo graphic update wcad
 
Texas housing market 2016
Texas housing market 2016Texas housing market 2016
Texas housing market 2016
 
Commercial realestate market overview 2016
Commercial realestate market overview 2016Commercial realestate market overview 2016
Commercial realestate market overview 2016
 
Updated property tax information for texas taxpayers
Updated property tax information for texas taxpayersUpdated property tax information for texas taxpayers
Updated property tax information for texas taxpayers
 
FY17 population report HCAD
FY17 population report HCADFY17 population report HCAD
FY17 population report HCAD
 

Similar to The Economy at a glance houston

Energy monthly 26th oct'16
Energy monthly   26th oct'16Energy monthly   26th oct'16
Energy monthly 26th oct'16Choice Equity
 
A Crude Oil Overview Part 2 Summer 2012
A Crude Oil  Overview Part 2 Summer 2012A Crude Oil  Overview Part 2 Summer 2012
A Crude Oil Overview Part 2 Summer 2012Shamik Bhose
 
Newsletter 082415 Final Volume 1 Issue 9
Newsletter 082415 Final Volume 1 Issue 9Newsletter 082415 Final Volume 1 Issue 9
Newsletter 082415 Final Volume 1 Issue 9Jonathan M. Lamb
 
Newsletter 10192015 Final Volume 1 Issue 17
Newsletter 10192015 Final Volume 1 Issue 17Newsletter 10192015 Final Volume 1 Issue 17
Newsletter 10192015 Final Volume 1 Issue 17Jonathan M. Lamb
 
Houston economy at_a_glance_vol24
Houston economy at_a_glance_vol24Houston economy at_a_glance_vol24
Houston economy at_a_glance_vol24Mandar Trivedi
 
Crude Oil Supply Concerns Over The Middle East Tensions with Peter Esho
Crude Oil Supply Concerns Over The Middle East Tensions with Peter EshoCrude Oil Supply Concerns Over The Middle East Tensions with Peter Esho
Crude Oil Supply Concerns Over The Middle East Tensions with Peter EshoInvast Financial Services
 
EY Price Point Q4 2022.pdf
EY Price Point Q4 2022.pdfEY Price Point Q4 2022.pdf
EY Price Point Q4 2022.pdfPaulBogenrieder1
 
Pain at the pump why does it cost more to fill your tank
Pain at the pump why does it cost more to fill your tankPain at the pump why does it cost more to fill your tank
Pain at the pump why does it cost more to fill your tankJason Fuchs
 
June 2021 - Sonoro Gold - Equity Research Report
June 2021 - Sonoro Gold - Equity Research ReportJune 2021 - Sonoro Gold - Equity Research Report
June 2021 - Sonoro Gold - Equity Research ReportMomentumPR
 
Cheap Oil, Share Revolution and World of Abundance
Cheap Oil, Share Revolution and World of AbundanceCheap Oil, Share Revolution and World of Abundance
Cheap Oil, Share Revolution and World of AbundanceBienvenido "Nonoy" Oplas, Jr.
 
Energy monthly 30th aug'16
Energy monthly   30th aug'16Energy monthly   30th aug'16
Energy monthly 30th aug'16choice broking
 
CUSHMAN & WAKEFIELD U.S. Macro Forecast
CUSHMAN & WAKEFIELD U.S. Macro ForecastCUSHMAN & WAKEFIELD U.S. Macro Forecast
CUSHMAN & WAKEFIELD U.S. Macro ForecastMatthew Marshall
 
Oil prices and global economy
Oil prices and global economyOil prices and global economy
Oil prices and global economysharusharief94
 
Bord GĂĄis Energy Index December 2014
Bord GĂĄis Energy Index December 2014Bord GĂĄis Energy Index December 2014
Bord GĂĄis Energy Index December 2014Bord GĂĄis Energy
 
As Consumers Cheer, Plunge in Oil Prices Poses Test for Texas Real Estate
As Consumers Cheer, Plunge in Oil Prices Poses Test for Texas Real EstateAs Consumers Cheer, Plunge in Oil Prices Poses Test for Texas Real Estate
As Consumers Cheer, Plunge in Oil Prices Poses Test for Texas Real EstateWee-Ping Low
 
2016 year in review
2016 year in review2016 year in review
2016 year in reviewLouise Newburry
 
Current Thinking, Q1 2015
Current Thinking, Q1 2015Current Thinking, Q1 2015
Current Thinking, Q1 2015Kevin Lenox
 

Similar to The Economy at a glance houston (20)

Energy monthly 26th oct'16
Energy monthly   26th oct'16Energy monthly   26th oct'16
Energy monthly 26th oct'16
 
A Crude Oil Overview Part 2 Summer 2012
A Crude Oil  Overview Part 2 Summer 2012A Crude Oil  Overview Part 2 Summer 2012
A Crude Oil Overview Part 2 Summer 2012
 
Newsletter 082415 Final Volume 1 Issue 9
Newsletter 082415 Final Volume 1 Issue 9Newsletter 082415 Final Volume 1 Issue 9
Newsletter 082415 Final Volume 1 Issue 9
 
OPEC August 2016
OPEC August 2016OPEC August 2016
OPEC August 2016
 
Newsletter 10192015 Final Volume 1 Issue 17
Newsletter 10192015 Final Volume 1 Issue 17Newsletter 10192015 Final Volume 1 Issue 17
Newsletter 10192015 Final Volume 1 Issue 17
 
Houston economy at_a_glance_vol24
Houston economy at_a_glance_vol24Houston economy at_a_glance_vol24
Houston economy at_a_glance_vol24
 
Crude Oil Supply Concerns Over The Middle East Tensions with Peter Esho
Crude Oil Supply Concerns Over The Middle East Tensions with Peter EshoCrude Oil Supply Concerns Over The Middle East Tensions with Peter Esho
Crude Oil Supply Concerns Over The Middle East Tensions with Peter Esho
 
EY Price Point Q4 2022.pdf
EY Price Point Q4 2022.pdfEY Price Point Q4 2022.pdf
EY Price Point Q4 2022.pdf
 
Pain at the pump why does it cost more to fill your tank
Pain at the pump why does it cost more to fill your tankPain at the pump why does it cost more to fill your tank
Pain at the pump why does it cost more to fill your tank
 
June 2021 - Sonoro Gold - Equity Research Report
June 2021 - Sonoro Gold - Equity Research ReportJune 2021 - Sonoro Gold - Equity Research Report
June 2021 - Sonoro Gold - Equity Research Report
 
Cheap Oil, Share Revolution and World of Abundance
Cheap Oil, Share Revolution and World of AbundanceCheap Oil, Share Revolution and World of Abundance
Cheap Oil, Share Revolution and World of Abundance
 
Energy monthly 30th aug'16
Energy monthly   30th aug'16Energy monthly   30th aug'16
Energy monthly 30th aug'16
 
Tpl oct 22 17
Tpl oct 22 17Tpl oct 22 17
Tpl oct 22 17
 
CUSHMAN & WAKEFIELD U.S. Macro Forecast
CUSHMAN & WAKEFIELD U.S. Macro ForecastCUSHMAN & WAKEFIELD U.S. Macro Forecast
CUSHMAN & WAKEFIELD U.S. Macro Forecast
 
Oil prices and global economy
Oil prices and global economyOil prices and global economy
Oil prices and global economy
 
Bord GĂĄis Energy Index December 2014
Bord GĂĄis Energy Index December 2014Bord GĂĄis Energy Index December 2014
Bord GĂĄis Energy Index December 2014
 
As Consumers Cheer, Plunge in Oil Prices Poses Test for Texas Real Estate
As Consumers Cheer, Plunge in Oil Prices Poses Test for Texas Real EstateAs Consumers Cheer, Plunge in Oil Prices Poses Test for Texas Real Estate
As Consumers Cheer, Plunge in Oil Prices Poses Test for Texas Real Estate
 
2016 year in review
2016 year in review2016 year in review
2016 year in review
 
2016 Year In Review
2016 Year In Review2016 Year In Review
2016 Year In Review
 
Current Thinking, Q1 2015
Current Thinking, Q1 2015Current Thinking, Q1 2015
Current Thinking, Q1 2015
 

More from cutmytaxes

Commercial property tax appeal services
Commercial property tax appeal servicesCommercial property tax appeal services
Commercial property tax appeal servicescutmytaxes
 
Property Tax Strategy
Property Tax StrategyProperty Tax Strategy
Property Tax Strategycutmytaxes
 
2017 Final Tax Brochure
2017 Final Tax Brochure2017 Final Tax Brochure
2017 Final Tax Brochurecutmytaxes
 
ARB Protest Hearing Procedues - WallerCAD
ARB Protest Hearing Procedues - WallerCADARB Protest Hearing Procedues - WallerCAD
ARB Protest Hearing Procedues - WallerCADcutmytaxes
 
HFF Investment Overview
HFF Investment OverviewHFF Investment Overview
HFF Investment Overviewcutmytaxes
 
HCAD News Release - June 2017
HCAD News Release - June 2017HCAD News Release - June 2017
HCAD News Release - June 2017cutmytaxes
 
FY 2017-2018 State Tax Revenue
FY 2017-2018 State Tax RevenueFY 2017-2018 State Tax Revenue
FY 2017-2018 State Tax Revenuecutmytaxes
 
Notice of a Public Meeting Agenda - Harris County
Notice of a Public Meeting Agenda - Harris CountyNotice of a Public Meeting Agenda - Harris County
Notice of a Public Meeting Agenda - Harris Countycutmytaxes
 
Texas Economy Outlook 2017
Texas Economy Outlook 2017Texas Economy Outlook 2017
Texas Economy Outlook 2017cutmytaxes
 
May 2017 Rev - Tarrant County
May 2017 Rev - Tarrant CountyMay 2017 Rev - Tarrant County
May 2017 Rev - Tarrant Countycutmytaxes
 
Property Tax Appeals Real Property Petition and Instructions for Filing
Property Tax Appeals Real Property Petition and Instructions for FilingProperty Tax Appeals Real Property Petition and Instructions for Filing
Property Tax Appeals Real Property Petition and Instructions for Filingcutmytaxes
 
2017 Commercial Lending Trends Survey
2017 Commercial Lending Trends Survey2017 Commercial Lending Trends Survey
2017 Commercial Lending Trends Surveycutmytaxes
 
Tax Services For Private Capital
Tax Services For Private CapitalTax Services For Private Capital
Tax Services For Private Capitalcutmytaxes
 
HCAD News Release 2017
HCAD News Release 2017HCAD News Release 2017
HCAD News Release 2017cutmytaxes
 
Property Tax Bills 2017
Property Tax Bills 2017Property Tax Bills 2017
Property Tax Bills 2017cutmytaxes
 
Tarrant Tax Sale - 2017
Tarrant Tax Sale - 2017Tarrant Tax Sale - 2017
Tarrant Tax Sale - 2017cutmytaxes
 
Williamson CAD 2017 Protest Procedures
Williamson CAD 2017 Protest ProceduresWilliamson CAD 2017 Protest Procedures
Williamson CAD 2017 Protest Procedurescutmytaxes
 
Commercial Real Estate Market Trends - 2017
Commercial Real Estate Market Trends - 2017Commercial Real Estate Market Trends - 2017
Commercial Real Estate Market Trends - 2017cutmytaxes
 
Tax rates 2017
Tax rates 2017Tax rates 2017
Tax rates 2017cutmytaxes
 
Property Tax Deferral Disabled Senior Citizens
Property Tax Deferral Disabled Senior CitizensProperty Tax Deferral Disabled Senior Citizens
Property Tax Deferral Disabled Senior Citizenscutmytaxes
 

More from cutmytaxes (20)

Commercial property tax appeal services
Commercial property tax appeal servicesCommercial property tax appeal services
Commercial property tax appeal services
 
Property Tax Strategy
Property Tax StrategyProperty Tax Strategy
Property Tax Strategy
 
2017 Final Tax Brochure
2017 Final Tax Brochure2017 Final Tax Brochure
2017 Final Tax Brochure
 
ARB Protest Hearing Procedues - WallerCAD
ARB Protest Hearing Procedues - WallerCADARB Protest Hearing Procedues - WallerCAD
ARB Protest Hearing Procedues - WallerCAD
 
HFF Investment Overview
HFF Investment OverviewHFF Investment Overview
HFF Investment Overview
 
HCAD News Release - June 2017
HCAD News Release - June 2017HCAD News Release - June 2017
HCAD News Release - June 2017
 
FY 2017-2018 State Tax Revenue
FY 2017-2018 State Tax RevenueFY 2017-2018 State Tax Revenue
FY 2017-2018 State Tax Revenue
 
Notice of a Public Meeting Agenda - Harris County
Notice of a Public Meeting Agenda - Harris CountyNotice of a Public Meeting Agenda - Harris County
Notice of a Public Meeting Agenda - Harris County
 
Texas Economy Outlook 2017
Texas Economy Outlook 2017Texas Economy Outlook 2017
Texas Economy Outlook 2017
 
May 2017 Rev - Tarrant County
May 2017 Rev - Tarrant CountyMay 2017 Rev - Tarrant County
May 2017 Rev - Tarrant County
 
Property Tax Appeals Real Property Petition and Instructions for Filing
Property Tax Appeals Real Property Petition and Instructions for FilingProperty Tax Appeals Real Property Petition and Instructions for Filing
Property Tax Appeals Real Property Petition and Instructions for Filing
 
2017 Commercial Lending Trends Survey
2017 Commercial Lending Trends Survey2017 Commercial Lending Trends Survey
2017 Commercial Lending Trends Survey
 
Tax Services For Private Capital
Tax Services For Private CapitalTax Services For Private Capital
Tax Services For Private Capital
 
HCAD News Release 2017
HCAD News Release 2017HCAD News Release 2017
HCAD News Release 2017
 
Property Tax Bills 2017
Property Tax Bills 2017Property Tax Bills 2017
Property Tax Bills 2017
 
Tarrant Tax Sale - 2017
Tarrant Tax Sale - 2017Tarrant Tax Sale - 2017
Tarrant Tax Sale - 2017
 
Williamson CAD 2017 Protest Procedures
Williamson CAD 2017 Protest ProceduresWilliamson CAD 2017 Protest Procedures
Williamson CAD 2017 Protest Procedures
 
Commercial Real Estate Market Trends - 2017
Commercial Real Estate Market Trends - 2017Commercial Real Estate Market Trends - 2017
Commercial Real Estate Market Trends - 2017
 
Tax rates 2017
Tax rates 2017Tax rates 2017
Tax rates 2017
 
Property Tax Deferral Disabled Senior Citizens
Property Tax Deferral Disabled Senior CitizensProperty Tax Deferral Disabled Senior Citizens
Property Tax Deferral Disabled Senior Citizens
 

Recently uploaded

Call Girls in Kashmiri Gate Delhi 💯Call Us 🔝8264348440🔝
Call Girls in Kashmiri Gate Delhi 💯Call Us 🔝8264348440🔝Call Girls in Kashmiri Gate Delhi 💯Call Us 🔝8264348440🔝
Call Girls in Kashmiri Gate Delhi 💯Call Us 🔝8264348440🔝soniya singh
 
Namrata 7 Plumeria Drive Pimpri Chinchwad Pune Brochure.pdf
Namrata 7 Plumeria Drive Pimpri Chinchwad Pune Brochure.pdfNamrata 7 Plumeria Drive Pimpri Chinchwad Pune Brochure.pdf
Namrata 7 Plumeria Drive Pimpri Chinchwad Pune Brochure.pdfPrachiRudram
 
Call Girls In Mundka Industrial Metro@꧂8447779280 ↬Enjoy ꧂Escort Service in ...
Call Girls In Mundka Industrial Metro@꧂8447779280 ↬Enjoy ꧂Escort Service in  ...Call Girls In Mundka Industrial Metro@꧂8447779280 ↬Enjoy ꧂Escort Service in  ...
Call Girls In Mundka Industrial Metro@꧂8447779280 ↬Enjoy ꧂Escort Service in ...asmaqueen5
 
Ajmera Prive at Juhu, Mumbai E-Brochure.pdf
Ajmera Prive at Juhu, Mumbai  E-Brochure.pdfAjmera Prive at Juhu, Mumbai  E-Brochure.pdf
Ajmera Prive at Juhu, Mumbai E-Brochure.pdfManishSaxena95
 
Rustomjee The Panorama At Pali Hill, Bandra West, Mumbai - Brochure.pdf
Rustomjee The Panorama At Pali Hill, Bandra West, Mumbai - Brochure.pdfRustomjee The Panorama At Pali Hill, Bandra West, Mumbai - Brochure.pdf
Rustomjee The Panorama At Pali Hill, Bandra West, Mumbai - Brochure.pdfmonikasharma630
 
Call Girls In The Lalit New Delhi ❀8860477959 Good Looking Escorts In 24/7 D...
Call Girls In The Lalit New Delhi ❀8860477959 Good Looking Escorts In 24/7 D...Call Girls In The Lalit New Delhi ❀8860477959 Good Looking Escorts In 24/7 D...
Call Girls In The Lalit New Delhi ❀8860477959 Good Looking Escorts In 24/7 D...lizamodels9
 
Call Girls In Mayur Vihar-1 Delhi ❀8860477959 Good Looking Escorts In 24/7 D...
Call Girls In Mayur Vihar-1 Delhi ❀8860477959 Good Looking Escorts In 24/7 D...Call Girls In Mayur Vihar-1 Delhi ❀8860477959 Good Looking Escorts In 24/7 D...
Call Girls In Mayur Vihar-1 Delhi ❀8860477959 Good Looking Escorts In 24/7 D...lizamodels9
 
Purva Palm Hills Devanahalli, Bangalore E- Brochure.pdf
Purva Palm Hills Devanahalli, Bangalore E- Brochure.pdfPurva Palm Hills Devanahalli, Bangalore E- Brochure.pdf
Purva Palm Hills Devanahalli, Bangalore E- Brochure.pdffaheemali990101
 
9990771857 Call Girls in Noida Sector 11 Noida (Call Girls) Delhi
9990771857 Call Girls in Noida Sector 11 Noida (Call Girls) Delhi9990771857 Call Girls in Noida Sector 11 Noida (Call Girls) Delhi
9990771857 Call Girls in Noida Sector 11 Noida (Call Girls) Delhidelhimodel235
 
Low Rate Call Girls in Lajpat Nagar Delhi Call 9990771857
Low Rate Call Girls in Lajpat Nagar Delhi Call 9990771857Low Rate Call Girls in Lajpat Nagar Delhi Call 9990771857
Low Rate Call Girls in Lajpat Nagar Delhi Call 9990771857delhimodel235
 
8 Key Elements for Comfortable Farmland Living
8 Key Elements for Comfortable Farmland Living 8 Key Elements for Comfortable Farmland Living
8 Key Elements for Comfortable Farmland Living Farmland Bazaar
 
Call Girls in Inderpuri Delhi 💯Call Us 🔝8264348440🔝
Call Girls in Inderpuri Delhi 💯Call Us 🔝8264348440🔝Call Girls in Inderpuri Delhi 💯Call Us 🔝8264348440🔝
Call Girls in Inderpuri Delhi 💯Call Us 🔝8264348440🔝soniya singh
 
Low Rate Call Girls in Tughlakabad Delhi Call 9990771857
Low Rate Call Girls in Tughlakabad Delhi Call 9990771857Low Rate Call Girls in Tughlakabad Delhi Call 9990771857
Low Rate Call Girls in Tughlakabad Delhi Call 9990771857delhimodel235
 
9990771857 Call Girls in Noida Sector 06 Noida (Call Girls) Delhi
9990771857 Call Girls in Noida Sector 06 Noida (Call Girls) Delhi9990771857 Call Girls in Noida Sector 06 Noida (Call Girls) Delhi
9990771857 Call Girls in Noida Sector 06 Noida (Call Girls) Delhidelhimodel235
 
SVN Live 4.22.24 Weekly Property Broadcast
SVN Live 4.22.24 Weekly Property BroadcastSVN Live 4.22.24 Weekly Property Broadcast
SVN Live 4.22.24 Weekly Property BroadcastSVN International Corp.
 
Ryan Mahoney - How Property Technology Is Altering the Real Estate Market
Ryan Mahoney - How Property Technology Is Altering the Real Estate MarketRyan Mahoney - How Property Technology Is Altering the Real Estate Market
Ryan Mahoney - How Property Technology Is Altering the Real Estate MarketRyan Mahoney
 
Call Girls in Khan Market 9654467111 ESCORTS SERVICE
Call Girls in Khan Market 9654467111 ESCORTS SERVICECall Girls in Khan Market 9654467111 ESCORTS SERVICE
Call Girls in Khan Market 9654467111 ESCORTS SERVICESapana Sha
 
9990771857 Call Girls in Noida Sector 34 Noida (Call Girls) Delhi
9990771857 Call Girls in Noida Sector 34 Noida (Call Girls) Delhi9990771857 Call Girls in Noida Sector 34 Noida (Call Girls) Delhi
9990771857 Call Girls in Noida Sector 34 Noida (Call Girls) Delhidelhimodel235
 

Recently uploaded (20)

Call Girls in Kashmiri Gate Delhi 💯Call Us 🔝8264348440🔝
Call Girls in Kashmiri Gate Delhi 💯Call Us 🔝8264348440🔝Call Girls in Kashmiri Gate Delhi 💯Call Us 🔝8264348440🔝
Call Girls in Kashmiri Gate Delhi 💯Call Us 🔝8264348440🔝
 
Namrata 7 Plumeria Drive Pimpri Chinchwad Pune Brochure.pdf
Namrata 7 Plumeria Drive Pimpri Chinchwad Pune Brochure.pdfNamrata 7 Plumeria Drive Pimpri Chinchwad Pune Brochure.pdf
Namrata 7 Plumeria Drive Pimpri Chinchwad Pune Brochure.pdf
 
Call Girls In Mundka Industrial Metro@꧂8447779280 ↬Enjoy ꧂Escort Service in ...
Call Girls In Mundka Industrial Metro@꧂8447779280 ↬Enjoy ꧂Escort Service in  ...Call Girls In Mundka Industrial Metro@꧂8447779280 ↬Enjoy ꧂Escort Service in  ...
Call Girls In Mundka Industrial Metro@꧂8447779280 ↬Enjoy ꧂Escort Service in ...
 
Ajmera Prive at Juhu, Mumbai E-Brochure.pdf
Ajmera Prive at Juhu, Mumbai  E-Brochure.pdfAjmera Prive at Juhu, Mumbai  E-Brochure.pdf
Ajmera Prive at Juhu, Mumbai E-Brochure.pdf
 
Low Rate Call Girls in Triveni Complex Delhi Call 9873940964
Low Rate Call Girls in Triveni Complex Delhi Call 9873940964Low Rate Call Girls in Triveni Complex Delhi Call 9873940964
Low Rate Call Girls in Triveni Complex Delhi Call 9873940964
 
Rustomjee The Panorama At Pali Hill, Bandra West, Mumbai - Brochure.pdf
Rustomjee The Panorama At Pali Hill, Bandra West, Mumbai - Brochure.pdfRustomjee The Panorama At Pali Hill, Bandra West, Mumbai - Brochure.pdf
Rustomjee The Panorama At Pali Hill, Bandra West, Mumbai - Brochure.pdf
 
Call Girls In The Lalit New Delhi ❀8860477959 Good Looking Escorts In 24/7 D...
Call Girls In The Lalit New Delhi ❀8860477959 Good Looking Escorts In 24/7 D...Call Girls In The Lalit New Delhi ❀8860477959 Good Looking Escorts In 24/7 D...
Call Girls In The Lalit New Delhi ❀8860477959 Good Looking Escorts In 24/7 D...
 
Call Girls In Mayur Vihar-1 Delhi ❀8860477959 Good Looking Escorts In 24/7 D...
Call Girls In Mayur Vihar-1 Delhi ❀8860477959 Good Looking Escorts In 24/7 D...Call Girls In Mayur Vihar-1 Delhi ❀8860477959 Good Looking Escorts In 24/7 D...
Call Girls In Mayur Vihar-1 Delhi ❀8860477959 Good Looking Escorts In 24/7 D...
 
Purva Palm Hills Devanahalli, Bangalore E- Brochure.pdf
Purva Palm Hills Devanahalli, Bangalore E- Brochure.pdfPurva Palm Hills Devanahalli, Bangalore E- Brochure.pdf
Purva Palm Hills Devanahalli, Bangalore E- Brochure.pdf
 
9990771857 Call Girls in Noida Sector 11 Noida (Call Girls) Delhi
9990771857 Call Girls in Noida Sector 11 Noida (Call Girls) Delhi9990771857 Call Girls in Noida Sector 11 Noida (Call Girls) Delhi
9990771857 Call Girls in Noida Sector 11 Noida (Call Girls) Delhi
 
Low Rate Call Girls in Lajpat Nagar Delhi Call 9990771857
Low Rate Call Girls in Lajpat Nagar Delhi Call 9990771857Low Rate Call Girls in Lajpat Nagar Delhi Call 9990771857
Low Rate Call Girls in Lajpat Nagar Delhi Call 9990771857
 
Call Girls in Mahavir Nagar whatsaap call US +919953056974
Call Girls in Mahavir Nagar  whatsaap call US  +919953056974Call Girls in Mahavir Nagar  whatsaap call US  +919953056974
Call Girls in Mahavir Nagar whatsaap call US +919953056974
 
8 Key Elements for Comfortable Farmland Living
8 Key Elements for Comfortable Farmland Living 8 Key Elements for Comfortable Farmland Living
8 Key Elements for Comfortable Farmland Living
 
Call Girls in Inderpuri Delhi 💯Call Us 🔝8264348440🔝
Call Girls in Inderpuri Delhi 💯Call Us 🔝8264348440🔝Call Girls in Inderpuri Delhi 💯Call Us 🔝8264348440🔝
Call Girls in Inderpuri Delhi 💯Call Us 🔝8264348440🔝
 
Low Rate Call Girls in Tughlakabad Delhi Call 9990771857
Low Rate Call Girls in Tughlakabad Delhi Call 9990771857Low Rate Call Girls in Tughlakabad Delhi Call 9990771857
Low Rate Call Girls in Tughlakabad Delhi Call 9990771857
 
9990771857 Call Girls in Noida Sector 06 Noida (Call Girls) Delhi
9990771857 Call Girls in Noida Sector 06 Noida (Call Girls) Delhi9990771857 Call Girls in Noida Sector 06 Noida (Call Girls) Delhi
9990771857 Call Girls in Noida Sector 06 Noida (Call Girls) Delhi
 
SVN Live 4.22.24 Weekly Property Broadcast
SVN Live 4.22.24 Weekly Property BroadcastSVN Live 4.22.24 Weekly Property Broadcast
SVN Live 4.22.24 Weekly Property Broadcast
 
Ryan Mahoney - How Property Technology Is Altering the Real Estate Market
Ryan Mahoney - How Property Technology Is Altering the Real Estate MarketRyan Mahoney - How Property Technology Is Altering the Real Estate Market
Ryan Mahoney - How Property Technology Is Altering the Real Estate Market
 
Call Girls in Khan Market 9654467111 ESCORTS SERVICE
Call Girls in Khan Market 9654467111 ESCORTS SERVICECall Girls in Khan Market 9654467111 ESCORTS SERVICE
Call Girls in Khan Market 9654467111 ESCORTS SERVICE
 
9990771857 Call Girls in Noida Sector 34 Noida (Call Girls) Delhi
9990771857 Call Girls in Noida Sector 34 Noida (Call Girls) Delhi9990771857 Call Girls in Noida Sector 34 Noida (Call Girls) Delhi
9990771857 Call Girls in Noida Sector 34 Noida (Call Girls) Delhi
 

The Economy at a glance houston

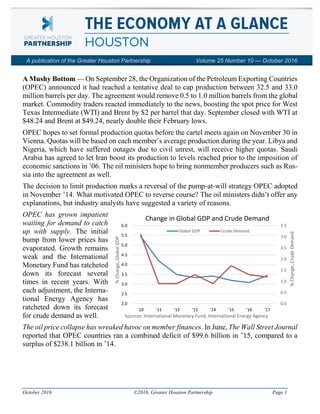
  • 1. October 2016 ©2016, Greater Houston Partnership Page 1 A Mushy Bottom — On September 28, the Organization of the Petroleum Exporting Countries (OPEC) announced it had reached a tentative deal to cap production between 32.5 and 33.0 million barrels per day. The agreement would remove 0.5 to 1.0 million barrels from the global market. Commodity traders reacted immediately to the news, boosting the spot price for West Texas Intermediate (WTI) and Brent by $2 per barrel that day. September closed with WTI at $48.24 and Brent at $49.24, nearly double their February lows. OPEC hopes to set formal production quotas before the cartel meets again on November 30 in Vienna. Quotas will be based on each member’s average production during the year. Libya and Nigeria, which have suffered outages due to civil unrest, will receive higher quotas. Saudi Arabia has agreed to let Iran boost its production to levels reached prior to the imposition of economic sanctions in ’06. The oil ministers hope to bring nonmember producers such as Rus- sia into the agreement as well. The decision to limit production marks a reversal of the pump-at-will strategy OPEC adopted in November ’14. What motivated OPEC to reverse course? The oil ministers didn’t offer any explanations, but industry analysts have suggested a variety of reasons. OPEC has grown impatient waiting for demand to catch up with supply. The initial bump from lower prices has evaporated. Growth remains weak and the International Monetary Fund has ratcheted down its forecast several times in recent years. With each adjustment, the Interna- tional Energy Agency has ratcheted down its forecast for crude demand as well. The oil price collapse has wreaked havoc on member finances. In June, The Wall Street Journal reported that OPEC countries ran a combined deficit of $99.6 billion in ’15, compared to a surplus of $238.1 billion in ’14. A publication of the Greater Houston Partnership Volume 25 Number 10 — October 2016 0.0 0.5 1.0 1.5 2.0 2.5 3.0 3.5 2.0 2.5 3.0 3.5 4.0 4.5 5.0 5.5 6.0 '10 '11 '12 '13 '14 '15 '16 '17 %Change,CrudeDemand %Change,GlobalGDP Sources: International Monetary Fund, International Energy Agency Change in Global GDP and Crude Demand Global GDP Crude Demand
  • 2. HOUSTON—THE ECONOMY AT A GLANCE October 2016 ©2016, Greater Houston Partnership Page 2 Without price relief, member na- tions will be forced to impose addi- tional domestic austerity meas- ures. Public servants in Saudi Ara- bia have seen their salaries cut 20 percent. The United Arab Emirates has ended billions of dollars in do- mestic subsidies. Venezuela suf- fers severe food shortages. OPEC ministers fear any more cutbacks could lead to additional civil un- rest. U.S. production has proven more resilient than expected. Though the drilling fleet has lost nearly 75 percent of its rigs, domestic production has slipped only 10 percent and the rate of decline may be slowing. The Saudis want to reassert their role as guardians of the oil market, recapturing the political influence that goes with it. Bloomberg reports the Kingdom is willing to cut daily production by 500,000 barrels to help the cartel reach its new production target. If a formal accord is reached, WTI could to rise to the mid-$50s by the end of this year. Brent would likely trade $1 to $2 above that. A number of firms, however―Goldman Sachs, Morgan Stanley, and Citi Group among them―have expressed skepticism that OPEC will succeed in cutting production and boosting prices. Members have a long history of ignoring production quotas. The news from OPEC comes at a time when the energy industry already may have found a bottom, albeit a mushy one. The spot price for WTI has rebounded from its February low of $26 per barrel, trading in the low- to mid-$40s prior to OPEC’s announcement. The U.S. fleet has added 109 oil-directed drilling rigs since late May. In a recent survey by the Federal Reserve Bank of Dal- las, the number of energy firms reporting their outlook has improved since the first quarter was double the num- ber reporting a worsened outlook. The same survey found the average price for firms to profitably drill a well was $51 a barrel in the Permian, $53 in the Eagle Ford, and $55 in other parts of Texas. And a recent Wood Mackenzie study found most U.S. exploration firms are “cash flow neutral” (i.e., their income matches their expenses) at $50 per barrel. Selected Forecasts, West Texas Intermediate, ’17 Average Price Forecaster $ Per Barrel Raymond James $80 Merrill Lynch $69 Piper Jaffray $60 Ryan Sitton $60 Wells Fargo $55 Morgan Stanley $51 Goldman Sachs $45-50 Sources: Company websites, presentations and media reports 7.0 7.5 8.0 8.5 9.0 9.5 10.0 Jan-14 Apr-14 Jul-14 Oct-14 Jan-15 Apr-15 Jul-15 Oct-15 Jan-16 Apr-16 Jul-16 MillionsofBarrels Source: U.S. Energy Information Administration Daily U.S. Crude Production
  • 3. HOUSTON—THE ECONOMY AT A GLANCE October 2016 ©2016, Greater Houston Partnership Page 3 If the low- to mid-$50s is the new threshold for profitability, how realistic is it to expect WTI to hold above $50 without an OPEC agreement? Before OPEC’s announcement, a number of investment banks and industry analysts had already forecast crude would range between $50 and $60 per barrel next year. In early October, WTI priced for February ’17 delivery traded at $50.48 per barrel on the NYMEX. October ’17 deliveries traded at $53.38. And the U.S. En- ergy Information Administration forecasts the spot price for WTI to average $52 a barrel in Q3/17 and $57 in Q4/17. Oil prices are notoriously volatile, and over the past two and half decades, WTI has traded as high as $145 per barrel and sunk as low as $12. Over the long run, however, highs and lows tend to offset each other and approach their long-term average. Economists refer to this phe- nomenon as “reversion to the mean.” The long-term average may also be a reasonable expec- tation for crude prices going forward. Few forecasters expect crude to fall below $30 in the near future, and fewer still expect $100 oil any time soon. If one reviews the past 25 years of price data, then adjusts for inflation, the long-term price for WTI has averaged $54 per barrel, which is not too far from what analysts, the EIA, and the futures market suggest for WTI in ’17. With or without OPEC’s help, WTI should hit that mark sometime time next year. We’re Not Who We Once Were — Houston has become smarter, more ethnically diverse, and a bit older in recent years, but we still spend an hour a day commuting to and from work. At least that’s what the most recent American Community Survey (ACS) tells us about the region. The ACS is the U.S. Census Bureau’s annual snapshot of the nation’s economic, hous- ing and social characteristics. The survey has been conducted every year since ’05. By exam- ining the ACS data for the Houston metro area1 , numerous trends become apparent. Hispanics will soon overtake Anglos as the region’s largest ethnic or racial group. The transition should occur within the next two years. On average, the Hispanic popula- tion grows by 65,000 resi- dents each year, the Anglo population by 9,000. In ’15, the gap between the two pop- ulations was fewer than 55,000 residents. Hispanics have accounted for more than half the region’s population growth since ’05, Asians and blacks around 17 percent, and whites just over 7 percent. No single race or ethnic group has represented a majority of the region’s population since the late ’90s. Among the U.S. 1 The data reported for the American Community Survey are for the Houston-The Woodlands-Sugar Land Metropolitan Statistical Area, which includes Austin, Brazoria, Chambers, Fort Bend, Galveston, Harris, Liberty, Montgomery and Waller Counties. HOUSTON METRO AREA RACE AND ETHNICITY, '05 AND '15 ------- ’15 ------- ------- ’05 ------- Estimate % Estimate % Total population 6,656,946 100.0 5,193,448 100.0 Anglo 2,482,767 37.3 2,313,993 44.6 Hispanic 2,429,487 36.5 1,686,048 32.5 Black 1,122,767 16.9 830,445 16.0 Asian 497,099 7.5 290,923 5.6 American Indian 12,478 0.2 12,969 0.2 Hawaiian/Pacific Islander 1,522 0.1 3,502 0.1 Some other race 12,202 0.2 10,638 0.2 Two or more races 98,624 1.5 44,930 0.9 Source: American Community Surveys, ’05 and ’15
  • 4. HOUSTON—THE ECONOMY AT A GLANCE October 2016 ©2016, Greater Houston Partnership Page 4 metro areas, Houston has the nation’s fourth largest Hispanic population, seventh largest black, seventh largest Asian, and 12th largest Anglo. Houston is growing older. In ’05, the median age for the region was 32.9 years. By ’15, it had risen to 34.1. Still, Houston has a younger population than the nation, where the median age is 37.8 years. Houston is also the youngest among the 10 most populous metros. The population balance has begun to shift. Children, adolescents and teenagers represented 31.2 percent of Houston’s population in ’05 but only 29.3 percent in ’15. Seniors (i.e., residents 65 and older) represented only 7.7 percent of the population in ’05 but 10.1 percent of the population today. Houstonians' average educa- tional attainment is higher to- day. Ten years ago, 78.7 per- cent of Houstonians 25 and older either had graduated from high school or had earned their GED certificate. Today, 82.3 percent have. Likewise, in ’05, 27.8 percent held a bachelor’s or higher de- gree. Today, 31.5 percent of the adult population does. Congestion remains a problem. The ACS reports that 3.0 million Houstonians commute to work each day, up from 2.3 million in ’05. Ten years ago, 78.3 percent of all commuters drove alone to work. Today, 80.7 percent drive alone. Only 2.2 percent of Houston commuters use public transit, down from 2.8 percent in ’05. The share of Houstonians who work at home rose from 2.9 to 3.7 percent over that period. Average travel time to work in ’15 was 30.2 minutes, up from 28.1 minutes in ’05. One in every 18 adults served in the U.S. military. The ratio jumps to one in six for adults over 65. Gulf War veterans (115,000) compose the largest group, followed by Vietnam era (91,000), and Korean War (21,000). Fewer than 10,000 World War II veterans still live in Houston. Disabilities are common among the population. One in 10 Houstonians responded to the ACS that they have some form of impairment (e.g., hearing, vision, ambulatory, cognitive, self-care or independent living). That ratio jumps to one in three for residents over 65. Some residents have multiple disabilities. Incomes have outpaced inflation. The median household income was $61,465 in ’15, meaning half of all households earned more than that amount and half earned less. The median house- hold income for Houston was $46,706 in ’05. Adjusted for inflation, that would be $56,681 in ’15. EDUCATION ATTAINMENT, METRO HOUSTON, POPULATION 25 AND OLDER Highest Level of Education ’15 Pop % ’05 Pop % Less than 9th grade 408,571 9.6 330,497 10.3 9th to 12th grade, no diploma 342,291 8.1 352,958 11.0 High school graduate 991,115 23.4 789,342 24.6 Some college, no degree 881,499 20.8 654,576 20.4 Associate's degree 281,166 6.6 186,105 5.8 Bachelor's degree 851,162 20.1 596,820 18.6 Graduate or professional degree 485,577 11.4 298,410 9.3 High school graduate or higher 3,490,519 82.3 2,525,252 78.7 Bachelor's degree or higher 1,336,739 31.5 895,229 27.9 Population 25 years and over 4,241,381 100.0 3,208,707 100.0 Note: Total may not sum evenly due to rounding Source: American Community Surveys, ’05 and ’15
  • 5. HOUSTON—THE ECONOMY AT A GLANCE October 2016 ©2016, Greater Houston Partnership Page 5 Houston has more middle class and affluent households than before. The ACS recorded 494,000 households earning between $100,000 and $200,000 in ’15, up from 273,000 in ’05. The ACS also reported 197,000 households in Houston with incomes of $200,000 or more in ’15, triple the 65,500 households in ’05. Given the recent layoffs in the energy industry, the number of households in the upper bracket will likely slip in the next report. Fewer Houstonians are uninsured. In ’09, 75.4 percent of Houstonians had health insurance. In ’15, 82.7 percent had coverage. (Insurance data were not collected prior to ’09.) Houston continues to draw residents from abroad. The ’14 ACS found that nearly 1.6 million Houstonians were born outside the U.S., up from 1.1 million in ’05. Nearly a quarter (23.7 percent) of all Houstonians are foreign born—roughly double one in eight (13.4 percent) for the nation as a whole. The bulk of immigrants came from Latin America, followed by Asia, Africa, and Europe in that order. About one-third of Houston’s population growth over the past 10 years, 460,000 new residents, can be attributed to immigration. But not all growth comes from domestic migration and foreign immigration. The ACS re- ported that 100,000 births occurred in Houston last year, of which 32.4 percent were to un- married women, compared to 28.2 percent in ’05. Metro Area Still on Top — Houston shipped more than $97.1 billion in goods and commod- ities overseas in ’15, marking the fourth consecutive year in which the metro area led the nation in exports. New York, with $95.6 billion, ranked sec- ond, and Seattle, with $67.2 billion, ranked third. The data come from the U.S. Metropolitan Area Exports, 2015 report recently re- leased by the U.S. Interna- tional Trade Administration. Houston retained the top spot even though the re- gion’s exports fell 18.4 per- cent from a peak of $119.0 billion in ’14. Lower oil prices reduced the value of Houston’s leading export, petroleum products. The strong U.S. dollar made other goods produced and sold from Houston less affordable, further reducing shipments. Houston suffered the worst drop among the na- tion’s 20 largest metro areas, but managed to hold onto its place as the nation’s leading ex- porter. This is only the second time in the past 10 years that Houston’s export value has de- clined. Petroleum Products $27.0B, 27.9% Chemicals $26.1B, 26.9% Machinery $12.1B, 12.5% Oil and Gas Extraction $7.0B, 7.2% Computer and Electronics $6.9B, 7.1% All Others $17.8B, 18.4% '15 Metro Houston Exports Source: U.S. International Trade Administration
  • 6. HOUSTON—THE ECONOMY AT A GLANCE October 2016 ©2016, Greater Houston Partnership Page 6 Houston’s top export destination was Mexico ($15.9 billion), followed by Canada ($10.3 bil- lion), China ($6.7 billion), Brazil ($4.8 billion) and The Netherlands ($4.3 billion). Firm Grip on Fourth Place — Metro Houston’s gross domestic product (GDP) totaled $503.3 billion in ’15, according to recent estimates by the U.S. Bureau of Economic Analysis (BEA). That’s down 3.6 percent from $522.0 billion in ’14. Houston’s economy still ranks fourth among U.S. metros, behind New York, Los Angeles and Chicago, but ahead of Washington, D.C. and Dallas-Fort Worth. Though Dallas-Fort Worth grew, Washington, D.C. grew faster, and as a result the DFW Metroplex slipped to sixth place. 20 Largest U.S. Metro Economies – ’15 Rank Metro Area GDP $ Billions % Change ’14 – ’15 Rank Metro Area GDP $ Billions % Change ’14 – ’15 1 New York $1,602.7 4.3 11 Miami $317.9 6.0 2 Los Angeles 930.8 5.8 12 Seattle 313.7 5.2 3 Chicago 640.7 5.2 13 Minneapolis-St. Paul 248.8 4.7 4 Houston 503.3 -3.6 14 Detroit 245.6 5.3 5 Washington 491.0 3.5 15 San Jose 235.2 10.4 6 Dallas-Fort Worth 485.7 1.5 16 San Diego 220.6 4.8 7 San Francisco 431.7 5.8 17 Phoenix 219.9 4.2 8 Philadelphia 411.2 3.5 18 Denver 193.2 2.7 9 Boston 396.6 4.6 19 Baltimore 181.4 4.0 10 Atlanta 339.2 5.3 20 Portland 158.8 6.5 Source: U.S. Bureau of Economic Analysis No Sign of Recovery — Houston’s office woes continue. Absorption totaled -800,000 square feet through the first nine months of ’16. That’s likely to exceed -1.0 million by the end of the year. The “direct” vacancy rate is in the mid-teens. The “effective” rate, which includes sub- lease space, approaches 20 percent. Nearly 12 million square feet of sublease space is on the market; another half million is ex- pected to hit in the fourth quarter. The average sublet asking rent is about $7 per square foot less than the asking rent for direct space. Sublease space now competes head-to-head with direct space, forcing some landlords to offer generous concessions to retain or attract tenants. Of the meager leasing activity in the third quarter, notes JLL, less than one-fifth of the space went to firms new to Houston or existing firms expanding their footprint in the market. Houston’s overall office market will need to absorb nearly 10.5 million square feet to return to the 20-year average availability of 16 percent, CBRE notes. The firm forecasts it will take three to five years for downtown to recover, perhaps longer for West Houston and the Energy Cor- ridor. Greenspoint/North Belt, with a vacancy rate in the mid- to low-40s, faces an even more uncertain future. Factoring in the typical lag between an economic upturn and the eventual impact on real estate, the office market probably won’t tighten until ’19 or ’20, according to Newmark Grubb Knight Frank.
  • 7. HOUSTON—THE ECONOMY AT A GLANCE October 2016 ©2016, Greater Houston Partnership Page 7 Don’t expect the recent rebound in oil prices to spur the oil and gas industry to go on a leasing spree. Even with a price recovery, hiring, and thus office transactions, will remain subdued. According to JLL, about one-third of Houston’s lease activity in the third quarter involved professional service firms, another third from transportation-related firms, but only 13 percent involved energy firms or utili- ties. In the decade of the ’90s, a period of chronically low oil prices, the energy indus- try added only 2,100 jobs while the market absorbed 24 million square feet of office space. Even in a period of minimal growth in the energy industry, Houston office mar- ket can post positive absorption. Developers broke ground on only three buildings in the third quarter; between 2.3 and 3.3 million square feet is now under construction. While that’s good news for the office market, that doesn’t bode well for the construction industry, which will have to scramble to find work in Houston next year and likely into ’18 as well. Employment Update — Metro Houston created 500 jobs in August, according to the Texas Workforce Commission (TWC). Though one of the weakest reports for August in recent his- tory, the data reflect an improvement over August ’15, when the region lost 800 jobs. The report also suggests that employment in several sectors hit hard in the downturn—mining and logging; trade, transportation, and utilities; and professional services—may be stabilizing, al- beit at much lower levels than 18 months ago. Though August employment numbers will be revised later this month and again in March ’17, at first blush, the numbers look promising. In the 12 months ending August ’16, Houston created 14,200 jobs. That performance is far weaker than 46,400 jobs in the 12 months ending August ’15. One must remember that the August ’15 total included the last four months of ’14, a period in which the region created more than 73,000 jobs. Those last four months offset the following eight months of job losses, mask- ing just how weak Houston’s economy was in early ’15. One should note that during the current downturn, TWC has yet to report a 12-month period in which Houston lost employment. The region, however, has not recouped the seasonal loss of 47,800 jobs that occurred in January ’16. Layoffs of this magnitude occur every year as workers hired for the holiday season are dismissed and restructuring decisions made in the fall are acted upon. As growth resumes in February, the region usually returns to its previous employment peak by May or June. That hasn’t been the case this year. Though Houston has recorded net employment gains in five of the past seven months, those gains have not been enough to offset January’s losses. The region remains 27,500 jobs below its previous peak. September through December are typically strong months for job growth in Houston. Payrolls HOUSTON OFFICE MARKET SNAPSHOT - Q3/16 % Direct % W/Sublease Sublease MM Sq Ft CBRE 15.6 20.9 11.4 JLL 16.8 19.7 12.2 Newmark Grubb 17.0 19.4 11.7 Transwestern 13.8 15.6 11.8 Note: Firms differ in how the define the market and whether they include owner-occupied buildings in the mix, hence the variation in the numbers. Source: Real estate firms quarterly reports
  • 8. HOUSTON—THE ECONOMY AT A GLANCE October 2016 ©2016, Greater Houston Partnership Page 8 expand as stores, hotels, restaurants and bars hire additional help for the holidays, transporta- tion firms hire drivers and package sorters for the shipping season, school districts and univer- sities contract for additional staff to handle larger fall enrollments, and businesses take on tem- porary workers to help meet year-end deadlines. In boom times, Houston may add 40,000 to 60,000 jobs in the latter part of the year. In lean times, 18,000 to 20,000 is typical. Given the historical pattern, and the suggestion from the data in this month’s jobs report that the worst of the local layoffs are over, Houston may finish the year with a slight net job gain. The big losers in the jobs report were the construction (-2,400 jobs) and manufacturing sectors (-1,500 jobs). Construction employment will soften as office and chemical plant work winds down. The big winners were education and health care (+3,600 jobs); trade, transportation, and utilities (+3,200 jobs); and professional services (+1,600 jobs). The job gains in TTU came primarily from retail as merchants began hiring to fill stores recently opened. The job gains in professional services came mainly from employment services (i.e., contract workers), an in- dustry in which job gains and losses are highly correlated with Houston’s business cycle. Mining and logging (i.e., oil and gas extraction and oil field services) gained 1,200 jobs. The industry probably didn’t create that many jobs in August. More likely, TWC adjusted August employment data to compensate for overestimating job cuts earlier in the year. Government shed 5,100 jobs in August,in line with the five-year average of 5,000 jobs lost in a typical August. The sector usually adds 15,000-20,000 jobs in September as teachers and administra- tors return to work. Education employment will likely reach a new peak this fall. Save the Date — The Greater Houston Partner- ship’s 2017 Economic Outlook event is sched- uled for Friday, December 9, 10 a.m. at the Royal Sonesta Hotel. This year's event will fea- ture a keynote from Dr. Kevin Swift, chief economist and managing director at the Ameri- can Chemistry Council. Dr. Swift is responsible for economic and other analyses dealing with policy issues as well as the business environment and the benefits of chemistry. KHOU-11 news anchor Shern-min Chow will moderate this year’s panel discussion as local business leaders from various industries will share their perspective on the region's economy. This year’s panel of experts includes:  Energy: Vicki Hollub, CEO, Occidental Petroleum;  Banking: John Sotoodeh, Regional Banking Executive, Wells Fargo;  Real Estate: Richard J. Campo, Chairman and CEO, Camden Property Trust; and  Health Care: Marc L. Boom, M.D., President and CEO, Houston Methodist. Partnership Senior Vice President of Research, Patrick Jankowski, will also review the Part- nership's employment forecast for 2017. Additional details about the event and how to pur- chase tickets are available at the Partnership’s website.
  • 9. HOUSTON—THE ECONOMY AT A GLANCE October 2016 ©2016, Greater Houston Partnership Page 9 SNAPSHOT — KEY ECONOMIC INDICATORS Aviation — The Houston Airport System handled 36.7 million passengers through the first eight months of this year, down 0.2 percent from the 36.8 million handled over the same period in ’15. Domestic passengers totaled 28.7 million, down 2.8 percent from 29.5 million handled YTD in ’15. International passengers totaled 8.1 million, up 10.4 percent from the 7.3 million handled YTD in ’15. Building Permits — City of Houston building permits totaled $413.0 million in August ’16, down 32.9 percent from $615.0 million in August ’15, according to the City’s Department of Public Works & Engineering Planning & Development Services. Year-to-date, city building permits totaled $4.8 billion, down 11.3 percent from $5.5 billion over the same period in ’15. Inflation — The cost of consumer goods and services as measured by the Consumer Price Index for All Urban Consumers (CPI-U) rose 1.1 percent nationwide from August ’15 to Au- gust ’16, according to the U.S. Bureau of Labor Statistics. Core inflation (all items less the volatile food and energy categories) increased 2.3 percent since August ’15. Home Sales — Houston-area single-family home sales rose 8.2 percent from 7,314 in August ’15 to 7,914 in August ’16. The August total is the most ever for a single month in metro Houston, according to the Houston Association of RealtorsÂź (HAR). Year to date, single- family home sales total 51,457, up 1.6 percent from 50,660 sales during the same period in ’15. The median price for a single-family home sold in metro Houston rose 4.2 percent to $225,000, compared to $216,000 in August of last year. The average sales price rose 2.4 per- cent to $289,613. Vehicle Sales — Houston-area auto dealers sold 28,399 vehicles in August, a 7.2 percent decrease from the 30,588 sold in August the previous year, according to TexAuto Facts, pub- lished by InfoNation, Inc. of Sugar Land. August marks the eighth consecutive month of over- the-year declines in vehicle sales, despite being the strongest month of sales since October ’15. Purchasing Managers Index — The Houston Purchasing Managers Index (PMI), a short- term leading indicator for regional production, registered 46.1 in August, up from 43.8 in July, according to the latest report from the Institute for Supply Management-Houston (ISM- Houston). With the August reading, the PMI has signaled economic contraction in Houston for 20 consecutive months. Sales Tax Collections — City of Houston sales tax collections totaled $477.5 million through September of this year, down 4.5 percent from $499.9 million from the same period last year.
  • 10. HOUSTON—THE ECONOMY AT A GLANCE October 2016 ©2016, Greater Houston Partnership Page 10 Patrick Jankowski, Josh Pherigo, and Jenny Philip contributed to this issue of Houston: The Economy at a Glance STAY UP TO DATE! To access past issues of Economy at a Glance, please click here. If you are a not a member of the Greater Houston Partnership and would like to subscribe to Economy at a Glance, please click here and enter your email address. For information about joining the Greater Houston Partnership, call Member Engagement at 713-844-3683. The Key Economic Indicators table is updated whenever any data change — typically, 11 or so times per month. If you would like to receive these updates by e-mail, usually accompanied by commentary, please email your request for Key Economic Indicators to aellis@housto.org with your name, title and phone number and your company’s name and address.
  • 11. HOUSTON—THE ECONOMY AT A GLANCE October 2016 ©2016, Greater Houston Partnership Page 11
  • 12. HOUSTON—THE ECONOMY AT A GLANCE October 2016 ©2016, Greater Houston Partnership Page 12 Houston Economic Indicators A Service of the Greater Houston Partnership Most Year % Most Year % Month Recent Earlier Change Recent Earlier Change ENERGY U.S. Active Rotary Rigs Sep '16 509 848 -40.0 487 * 1,059 * -54.0 Spot Crude Oil Price ($/bbl, West Texas Intermediate) Aug '16 44.72 42.87 4.3 40.87 * 51.63 * -20.8 Spot Natural Gas ($/MMBtu, Henry Hub) Aug '16 2.82 2.77 1.8 2.26 * 2.82 * -19.9 UTILITIES AND PRODUCTION Houston Purchasing Managers Index Aug '16 46.1 47.3 -2.5 45.0 * 46.8 * -3.8 Nonresidential Electric Current Sales (Mwh, CNP Service Area) Aug '16 5,314,931 5,184,990 2.5 38,204,095 37,339,247 2.3 CONSTRUCTION Total Building Contracts ($, Houston MSA) Aug '16 1,168,310,000 1,323,070,000 -11.7 9,831,800,000 11,993,980,000 -18.0 Nonresidential Aug '16 441,418,000 472,999,000 -6.7 3,788,786,000 4,781,003,000 -20.8 Residential Aug '16 726,892,000 850,071,000 -14.5 6,043,014,000 7,212,977,000 -16.2 Building Permits ($, City of Houston) Aug '16 412,972,876 615,000,608 -32.9 4,840,326,510 5,459,252,302 -11.3 Nonresidential Aug '16 261,853,368 390,417,722 -32.9 3,245,225,184 3,481,194,433 -6.8 New Nonresidential Aug '16 133,358,107 227,753,872 -41.4 1,326,376,838 1,787,125,207 -25.8 Nonresidential Additions/Alterations/Conversions Aug '16 128,495,261 162,663,850 -21.0 1,918,848,346 1,694,069,226 13.3 Residential Aug '16 151,119,508 224,582,886 -32.7 1,595,101,326 1,978,057,869 -19.4 New Residential Aug '16 127,097,467 180,377,993 -29.5 1,210,805,545 1,780,598,080 -32.0 Residential Additions/Alterations/Conversions Aug '16 24,022,041 44,204,893 -45.7 384,295,781 197,459,789 94.6 Multiple Listing Service (MLS) Activity Property Sales Aug '16 9,319 8,699 7.1 61,613 61,054 0.9 Median Sales Price - SF Detached Aug '16 225,000 216,000 4.2 219,187 * 212,100 * 3.3 Active Listings Aug '16 38,056 33,856 12.4 35,170 * 30,381 * 15.8 EMPLOYMENT (Houston-Sugar Land-Baytown MSA) Nonfarm Payroll Employment Aug '16 2,993,400 2,979,200 0.5 2,990,088 * 2,979,376 * 0.4 Goods Producing (Natural Resources/Mining/Const/Mfg) Aug '16 532,200 560,000 -5.0 539,775 0 569,213 * -5.2 Service Providing Aug '16 2,461,200 2,419,200 1.7 2,450,313 0 2,410,163 * 1.7 Unemployment Rate (%) - Not Seasonally Adjusted Houston-Sugar Land-Baytown MSA Aug '16 5.8 4.9 5.1 * 4.6 * Texas Aug '16 5.0 4.6 4.6 * 4.5 * U.S. Aug '16 5.0 5.2 5.0 * 5.5 * TRANSPORTATION Port of Houston Authority Shipments (Short Tons) July '16 3,893,616 3,654,829 6.5 26,096,412 28,222,939 -7.5 Air Passengers (Houston Airport System) Aug '16 4,605,137 4,789,130 -3.8 36,714,840 36,771,039 -0.2 Domestic Passengers Aug '16 3,569,747 3,782,749 -5.6 28,662,150 29,479,777 -2.8 International Passengers Aug '16 1,035,390 1,006,381 2.9 8,052,690 7,291,262 10.4 Landings and Takeoffs Aug '16 68,268 67,499 1.1 525,101 536,245 -2.1 Air Freight (metric tons) Aug '16 33,147 32,350 2.5 266,409 275,328 -3.2 Enplaned Aug '16 15,673 16,776 -6.6 129,215 143,171 -9.7 Deplaned Aug '16 17,475 15,574 12.2 137,194 132,157 3.8 CONSUMERS New Car and Truck Sales (Units, Houston MSA) Aug '16 28,399 30,588 -7.2 204,307 255,154 -19.9 Cars Aug '16 9,934 12,058 -17.6 74,404 104,243 -28.6 Trucks, SUVs and Commercials Aug '16 18,465 18,530 -0.4 129,903 150,911 -13.9 Total Retail Sales ($000,000, Houston MSA, NAICS Basis) Q4/15 31,941 35,393 -9.8 112,143 125,047 -10.3 Consumer Price Index for All Urban Consumers ('82-'84=100) Houston-Galveston-Brazoria CMSA Aug '16 216.573 214.652 0.9 215.747 * 212.662 * 1.5 United States Aug '16 240.853 238.316 1.1 239.274 * 236.820 * 1.0 Hotel Performance (Houston MSA) Occupancy (%) Q2/16 66.2 71.1 65.9 * 70.6 * Average Room Rate ($) Q2/16 110.75 112.10 -1.2 107.96 * 108.09 * -0.1 Revenue Per Available Room ($) Q2/16 73.29 79.70 -8.0 71.07 * 76.28 * -6.8 YEAR-TO-DATE TOTAL or YTD AVERAGE*MONTHLY DATA
  • 13. HOUSTON—THE ECONOMY AT A GLANCE October 2016 ©2016, Greater Houston Partnership Page 13 Sources Rig Count Baker Hughes Incorporated Spot WTI, Spot Natural Gas U.S. Energy Information Admin. Houston Purchasing Managers National Association of Index Purchasing Management – Houston, Inc. Electricity CenterPoint Energy Building Construction Contracts McGraw-Hill Construction City of Houston Building Permits Building Permit Department, City of Houston MLS Data Houston Association of Realtors Employment, Unemployment Texas Workforce Commission Port Shipments Port of Houston Authority Aviation Aviation Department, City of Houston Car and Truck Sales TexAuto Facts Report, InfoNation, Inc., Sugar Land TX Retail Sales Texas Comptroller’s Office Consumer Price Index U.S. Bureau of Labor Statistics Hotels PKF Consulting/HospitalityAsset Advisors International Postings, Foreclosures Foreclosure Information &Listing Service
  • 14. HOUSTON—THE ECONOMY AT A GLANCE October 2016 ©2016, Greater Houston Partnership Page 14 -150 -120 -90 -60 -30 0 30 60 90 120 150 2,000 2,100 2,200 2,300 2,400 2,500 2,600 2,700 2,800 2,900 3,000 3,100 '06 '07 '08 '09 '10 '11 '12 '13 '14 '15 '16 '17 12-MonthChange(000) NonfarmPayrollEmployment(000) Source: Texas Workforce Commission Nonfarm Payroll Employment, Houston MSA 12-Month Change Total Payroll Employment 1,800 1,900 2,000 2,100 2,200 2,300 2,400 2,500 420 460 500 540 580 620 '06 '07 '08 '09 '10 '11 '12 '13 '14 '15 '16 '17 Service-ProvidingJobs(000s) Goods-ProducingJobs(000s) Source: Texas Workforce Commission Goods-Producing and Service-Providing Employment Houston MSA Goods-Producing Jobs Service-Providing Jobs
  • 15. HOUSTON—THE ECONOMY AT A GLANCE October 2016 ©2016, Greater Houston Partnership Page 15 3 4 5 6 7 8 9 10 11 '06 '07 '08 '09 '10 '11 '12 '13 '14 '15 '16 '17 %CivilianLaborForce Source: Texas Workforce Commission Unemployment Rate - Houston, Texas and U.S. Houston Texas U.S. 0 2 4 6 8 10 12 14 16 0 20 40 60 80 100 120 140 160 '06 '07 '08 '09 '10 '11 '12 '13 '14 '15 '16 '17 NaturalGas,$/MMBtu WTI,$barrel Source: U.S. Energy Information Administration Spot Crude and Natural Gas Prices Monthly Averages WTI Natural Gas