Downloaded 144 times


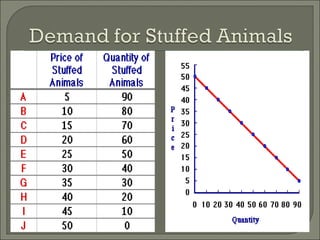


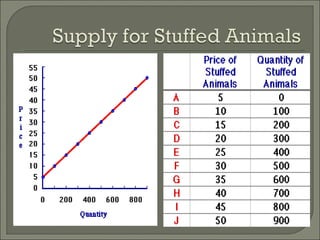

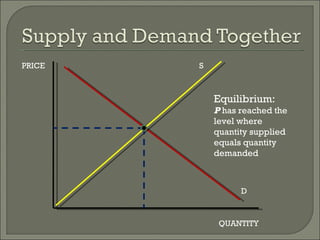
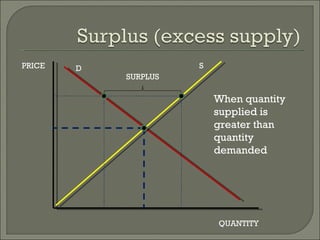
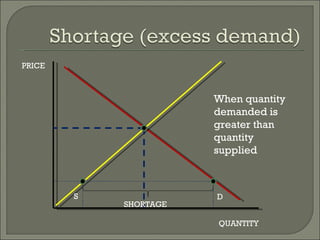
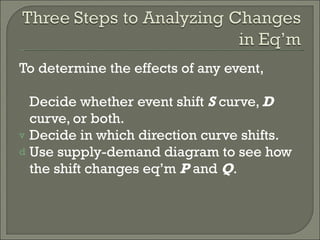
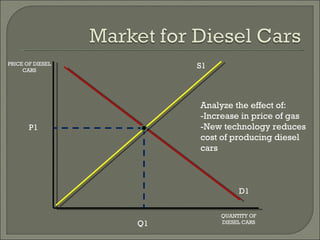
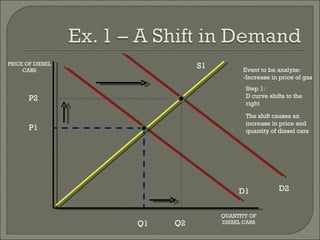
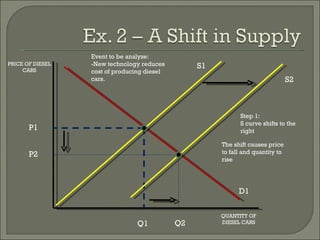
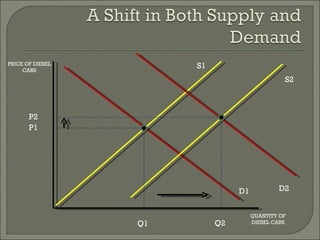
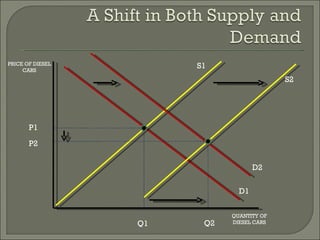

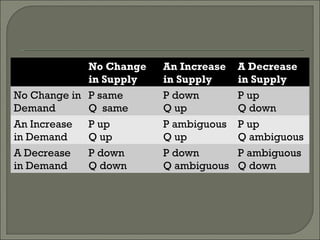
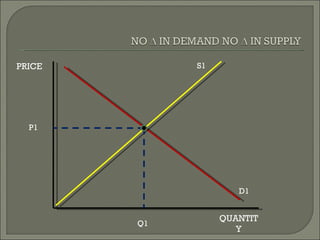

The document discusses the laws of supply and demand. It defines quantity demanded and quantity supplied, and explains how each is affected by different variables according to the laws of supply and demand. Specifically, it states that quantity demanded decreases when price increases, and quantity supplied increases when price increases. It also provides examples of how to analyze the effects of events using supply-demand diagrams.


