Download to read offline

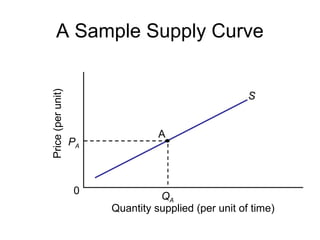
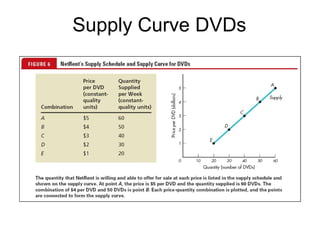

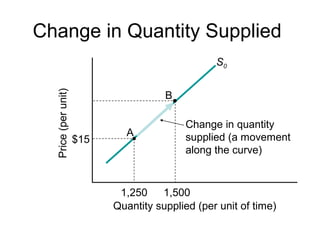
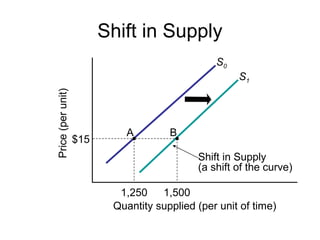
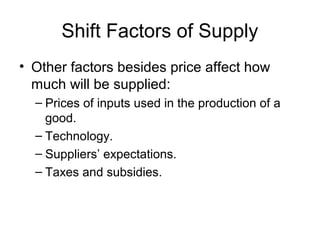
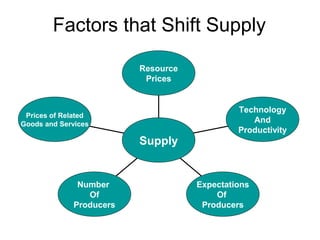
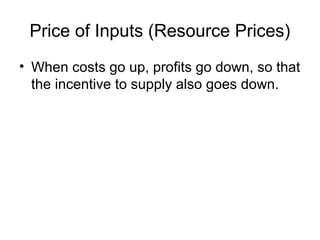
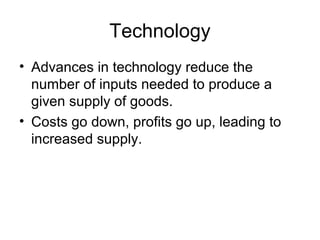
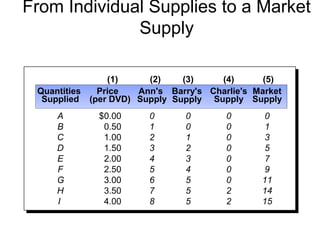

The document discusses supply in economics, highlighting that individuals control production factors which are supplied to firms. It explains the law of supply, stating that quantity supplied rises with price and detailing shifts in supply versus movements along a supply curve based on other factors like technology and input prices. Additionally, it covers how changes in suppliers' expectations and the number of producers can affect market supply.


