This document provides a reconciliation of GAAP financial measures to non-GAAP financial measures for United Airlines for calendar year 2001 and each quarter of 2001. It excludes various one-time costs such as severance, asset impairments, and stabilization act compensation in order to show adjusted operating expenses, losses, costs, and debt-to-capital ratios on a non-GAAP basis. For the full year and each quarter, GAAP and non-GAAP results are provided along with an explanation of reconciling items and their financial impact.
This document provides a reconciliation of GAAP financial measures to non-GAAP financial measures for Continental Airlines for the December 2002 calendar year and quarter. It reports operating expenses, operating loss, pretax loss, net loss, diluted EPS, operating margin, CASM, passenger load factor, and other metrics under both GAAP and non-GAAP measures, excluding various one-time costs. It also provides details on costs as a percentage of expenses and revenues, as well as cost per ASM metrics. The net debt-to-capital ratio is reported as well.
Delta provided a reconciliation of its GAAP financial measures to non-GAAP financial measures for the December 2003 calendar year and quarter. Some key points:
- For the full year, Delta reported a GAAP net loss of $773 million but a non-GAAP net loss of $1,042 million after excluding various unusual items.
- For the quarter, Delta reported a GAAP net loss of $327 million but a non-GAAP net loss of $207 million after excluding items such as pension charges and gains/losses.
- Delta provided fuel price neutralized CASM measures to adjust for changes in fuel prices between periods. Fuel price neutralized CASM excluding unusual items increased 2.
This document provides a reconciliation of GAAP financial measures to non-GAAP financial measures for Delta Air Lines. It excludes certain items from various financial metrics like pre-tax income, cost per available seat mile (CASM), passenger revenue per available seat mile (PRASM), and EBITDAR to provide a more meaningful comparison of the company's performance to prior periods and the industry. Items excluded include reorganization costs, fuel price fluctuations, and other one-time charges. The reconciliations are intended to help investors evaluate Delta's recurring operational performance.
This document provides financial information for Advanced Micro Devices for the first quarter of 2009 including statements of operations, balance sheets, and selected corporate data. It shows a net loss of $414 million for the quarter, decreased revenue compared to the same quarter last year, and cash, cash equivalents, and marketable securities of $2.719 billion as of the end of the quarter. Non-GAAP information is also provided to show financial results excluding AMD's Foundry segment.
The Tribune Company reported financial results for the first quarter of 2007. Operating revenues decreased 4.3% from the prior year to $1.2 billion due to declines in publishing and broadcasting revenues. Operating profit decreased 16.3% to $181 million due to lower revenues and a $76 million loss on derivatives and investments. Net loss was $15.6 million compared to net income of $102.8 million in the prior year, as discontinued operations had a $34.4 million loss from expected sales of newspapers. Advertising revenues declined for publishing, with national down 1.4% and classified down 16%.
- Tribune Company reported lower operating revenues and profits for Q2 2006 compared to Q2 2005. Net income decreased 62.4% due to an expected loss from the sale of two television stations.
- Publishing revenues were down slightly but expenses increased, lowering operating cash flow and profit. Broadcasting revenues decreased for television but were flat overall.
- Income from continuing operations fell 29.1% while discontinued operations recorded a loss due to writing down assets of stations being sold. Earnings per share decreased across both continuing and discontinued operations.
Ryder System, Inc. and Subsidiaries reported financial results for the fourth quarter and full year 2005. Revenue for the quarter increased 13.3% to $1.54 billion compared to the same period in 2004. For the full year, revenue rose 11.5% to $5.74 billion. Net earnings for the quarter were $58.8 million compared to $62.6 million in 2004, while full year net earnings increased to $226.9 million from $215.6 million in the prior year. The company saw growth across its business segments, with the largest increases in supply chain solutions and fuel revenue.
The Tribune Company saw a decline in operating revenues and profits in Q3 2007 compared to 2006. However, net income was boosted by $66.95 million in income from discontinued operations. Several non-operating items impacted net income, including $84.97 million in losses on derivatives and investments, but this was offset by $90.7 million in tax benefits. Earnings per share increased significantly year-over-year due to lower outstanding shares.
This document summarizes Ryder System Inc.'s financial performance for the second quarter and first half of 2006 compared to the same periods in 2005. Some key highlights include:
- Total revenue increased 14.8% to $1.6 billion for the quarter and 14.3% to $3.1 billion for the first half.
- Earnings before income taxes rose 15.5% to $104.6 million for the quarter and 16.5% to $183.8 million for the first half.
- The Fleet Management Solutions segment saw revenue increase 8.2% for the quarter and 7.2% for the first half, while earnings before taxes grew 6.8% and
Ryder System, Inc. reported financial results for the third quarter and first nine months of 2005. Revenue increased 14.1% to $1.49 billion for the quarter and 10.8% to $4.2 billion for the nine month period. Net earnings grew 16.7% to $63.3 million for the quarter and 9.9% to $168.1 million for the nine months. Earnings per share increased 17.6% to $0.98 for the quarter on higher revenue and earnings across business segments. The Fleet Management Solutions segment saw the largest revenue growth at 10.0% for the quarter due to increased fuel sales and rental revenues.
The document provides a reconciliation of GAAP financial measures to non-GAAP measures for the company for the periods of March 31, 2008 and March 31, 2007. It also provides forecasts for non-GAAP measures for the quarter ending June 2008 and full year 2008. Some of the reconciling items between GAAP and non-GAAP measures include impairment of goodwill, restructuring and related items, and reorganization costs. The reconciliation is provided for metrics like net loss, operating expenses, cash flow, costs per available seat mile (CASM), and operating margins.
The document provides consolidated financial statements for a company for the years 2005-2007. It shows that total revenues increased from $10.2 billion in 2005 to $13.6 billion in 2007. Net income decreased from $549 million in 2005 to a net loss of $95 million in 2007. Key line items include total revenues, operating expenses, income from continuing operations, and net income/loss for each year.
- ConocoPhillips reported significantly higher revenues and net income for both the fourth quarter and full year 2004 compared to the same periods in 2003, driven by higher oil and gas prices and increased production volumes.
- Revenues for the fourth quarter of 2004 were $40.1 billion, up 54% from $26 billion in the fourth quarter of 2003. Net income for the fourth quarter was $2.4 billion, up 138% from $1 billion.
- For the full year 2004, revenues were $136.9 billion compared to $105.1 billion in 2003. Net income was $8.1 billion compared to $4.7 billion in 2003.
HSBC InvestDirect (India) Limited reported unaudited financial results for the quarter ended June 30, 2010. On a standalone basis, net loss was Rs. 266.81 lakhs compared to a net loss of Rs. 241.63 lakhs in the prior year quarter. On a consolidated basis, net loss was Rs. 1,758.81 lakhs compared to a net loss of Rs. 1,989.90 lakhs in the prior year quarter. Exceptional items for the quarter included a provision for diminution in investments of Rs. 109.70 lakhs. Earnings per share for the quarter was a loss of Rs. 0.38 on both a standalone and consolidated basis
The document summarizes Tribune Company's financial results for the first quarter of 2003 compared to 2002. Some key points:
- Operating revenues increased 5% to $1.29 billion driven by a 13% increase in television revenues. Operating profit before restructuring charges rose 10% to $276 million.
- Net income was $141 million compared to a net loss of $102 million in 2002. Earnings per share increased significantly.
- Publishing operating profit rose 21% to $198 million due to cost reductions. Broadcasting profit increased 25% to $90 million from higher television revenues and profits.
- Corporate losses narrowed to $11 million from restructuring charges in the prior year. The company had
The Tribune Company saw declines in operating revenues and income from continuing operations in the second quarter of 2007 compared to the same period in 2006. Operating revenues fell 6.8% and income from continuing operations dropped 78.2%. Expenses rose due to restructuring charges and plant closure costs. Non-operating losses also increased significantly due to losses on derivatives and investments. Net income declined 58.7% due to lower operating results and higher non-operating losses.
capital one Printer Friendly Version of the Financial Supplementfinance13
This document provides quarterly and annual financial and statistical data for Capital One Financial Corporation for 2008 and Q4 2007. Some key highlights include:
- For Q4 2008, Capital One reported a net loss of $1.42 billion compared to net income of $226.6 million in Q4 2007. Revenue declined 38% annually and the company reported an ROA of -3.45%.
- On a managed basis, which includes securitized assets, Q4 2008 net loss was $1.42 billion, revenue declined 25% annually, and ROA was -2.70%.
- Asset quality deteriorated with the net charge-off rate rising to 4.98% in Q4 2008
Fluor Corporation reported financial results for 2003 with revenues of $8.8 billion, earnings from continuing operations of $179 million, and net earnings of $157 million. Key highlights included a 6% increase in earnings from continuing operations compared to 2002. New awards in 2003 totaled nearly $10 billion and backlog remained strong at over $10 billion. The document also discussed Fluor's shift away from power projects as that market declined, with the dissolution of its Duke/Fluor Daniel joint venture in power announced in July 2003.
This document provides non-GAAP reconciliations of Alltel Corporation's results of operations for various periods under GAAP and from current businesses. It excludes items like amortization of intangible assets from acquisitions, gains or losses from asset sales or disposals, integration expenses, adjustments to tax liabilities, and discontinued operations. Notes further explain the adjustments and excluded items, such as amortization, integration costs, gains or losses on sales of assets or securities, compensation from accelerated vesting of restricted stock, and the spin-off of Alltel's wireline business.
This annual report summarizes Fluor Corporation's financial highlights and business strategy for 2003. Some key points:
- Revenues declined 12% to $8.8 billion due to completion of power projects, but earnings grew 6% to $179 million due to diversification.
- New awards grew 16% to $10 billion and backlog grew 9% to $10.6 billion, signaling future growth.
- The company aims to increase stable government and operations businesses to 40% of revenue to reduce cyclicality. These grew to 32% of revenue in 2003.
- While 2004 may see lower earnings due to transition between power and oil/gas projects, new awards and backlog trends are positive indicators for
Twitter guadagna sempre più terreno anche nel nostro Paese imponendosi quale valido strumento per la diffusione di campagne marketing B2B/B2C e, di fatto, istituendo un nuovo ed efficace touchpoint per le imprese.
Le peculiarità di questo social network richiedono però alcuni accorgimenti che, ove trascurati, riducono drasticamente la possibilità di ottenere risultati concreti. La stesura dei tweet, l’utilizzo degli hashtag e la modalità di diffusione sono, tra gli altri, punti nodali sui quali è bene concentrarsi prima di intraprendere un’iniziativa operativa.
Axe and the sender discuss a video that Axe enjoyed. Axe's favorite parts were the hospital scene with the pizza slice mask and the graveyard flip scene. Axe also liked the blonde wig. The sender is happy that Axe enjoyed the video and grateful that they were able to use Axe's song for it. The sender notes that four years ago they did not think they would achieve making a video or talking with Axe over instant message.
Comfort engineered systems, inc make it right housesLinear Solar INC
This document summarizes air conditioning and heating systems installed by Comfort Engineered Systems in homes designed by leading international architects and built in New Orleans. It lists several architectural firms from the US and abroad that designed energy efficient homes achieving LEED certification. For each project, it outlines the mechanical system installed, including geothermal, heat pump, and variable speed technologies, prioritizing comfort and energy efficiency. A local architect, John C. Williams Architects, provided construction drawings and on-site verification.
Analisi statistica dei social network con Microsoft ExcelRoberto Marmo
Usare Microsoft Excel 2010 e successivi per leggere dati da Facebook, Twitter, Linkedin e farne analisi statistica, dal workshop tenuto a fiera SMAU Milano il 22 ottobre 2014 da Roberto Marmo.
Ryder System, Inc. and Subsidiaries reported financial results for the three months and year ended December 31, 2006. For the quarter, revenue increased slightly to $1.594 billion while net earnings rose 11% to $65.8 million. For the full year, revenue grew 10% to $6.307 billion and net earnings increased 10% to $249 million. The company saw growth in its Fleet Management and Supply Chain Solutions segments, while Dedicated Contract Carriage remained relatively flat. Key metrics like return on equity and return on assets remained steady.
- Ryder System, Inc. reported consolidated revenue of $1.59 billion for Q4 2006, up 3% from Q4 2005. For full year 2006, revenue was $6.31 billion, an increase of 10% over 2005.
- Earnings from continuing operations for Q4 2006 were $65.8 million, an 11% increase from $59.5 million in Q4 2005. For 2006, earnings from continuing operations were $249 million, up 9% from 2005.
- The Fleet Management Solutions segment saw a 1% decline in revenue for Q4 2006 compared to Q4 2005, while the Supply Chain Solutions segment had a 13% revenue increase and the Dedicated Contract Carriage
Ryder System, Inc. reported financial results for the third quarter and first nine months of 2006. Total revenue increased 9% to $1.62 billion for the quarter and 12% to $4.71 billion for the nine month period. Net earnings increased slightly to $65.3 million for the quarter but grew 9% to $183.1 million for the nine months. The company saw growth across all business segments, with the Supply Chain Solutions segment experiencing the strongest gains at 19% and 29% respectively for revenue for the quarter and nine month period.
Ryder System, Inc. reported financial results for the third quarter and first nine months of 2006. Total revenue increased 9% to $1.62 billion for the quarter and 12% to $4.71 billion for the nine month period. Net earnings increased slightly to $65.3 million for the quarter and $183.1 million for the nine months. Fleet Management Solutions remained the largest business segment and saw revenue increases of 5% and 6% for the respective periods. Supply Chain Solutions saw significant revenue growth of 19% and 29% for the quarter and nine month period.
The document provides reconciliations of GAAP financial measures to non-GAAP financial measures for Delta Airlines for the March 2006 quarter. It excludes certain special items like pension charges, accounting adjustments, and aircraft charges to show measures like net loss, operating revenues, unit costs, and breakeven passenger load factor excluding these special items. It also provides capital expenditures for the quarter and notes that reconciliations are not provided for future guidance periods given the inability to project special items and fuel costs.
Ryder System, Inc. and Subsidiaries reported financial results for the fourth quarter and full year 2005. Revenue for the quarter increased 13.3% to $1.54 billion compared to the same period in 2004. For the full year, revenue rose 11.5% to $5.74 billion. Net earnings for the quarter were $58.8 million, a decrease of 6.1% from 2004. However, full year net earnings increased 5.3% to $226.9 million compared to 2004. The company saw growth across its business segments, with the largest increases in its Supply Chain Solutions and Fuel revenue.
This document provides a reconciliation of GAAP financial measures to non-GAAP financial measures for Delta Airlines for various periods in 2006. It excludes special items like pension charges, accounting adjustments, and reorganization costs to show operating expenses, costs, and load factors excluding these one-time expenses. For example, total operating expenses excluding special items for the nine months ended September 30, 2006 were $12.86 billion compared to $12.98 billion in GAAP expenses. Fuel costs are also excluded from some measures to show costs excluding the volatile fuel component.
This document provides financial information for Ryder System, Inc. for the second quarter and first half of 2007 compared to the same periods in 2006. Some key details include:
- Revenue increased 4% to $1.658 billion for the quarter and 5% to $3.252 billion for the first half.
- Net earnings decreased 7% to $65.1 million for the quarter but were relatively flat at $116.4 million for the first half.
- Operating revenue for the Fleet Management Solutions segment increased 2% for the quarter and year-to-date. Segment earnings increased 3% and 5% respectively.
- Supply Chain Solutions operating revenue increased 13% for the quarter and 16
This document provides financial information for Ryder System, Inc. for the second quarter and first half of 2007 compared to the same periods in 2006. Some key details include:
- Total revenue for the second quarter was $1.658 billion, up 4% from the prior year. First half revenue was $3.252 billion, up 5%.
- Fleet Management Solutions revenue was flat for the quarter but up 7% for the first half. Supply Chain Solutions revenue grew 16% for both periods.
- Net earnings were $65.1 million for the quarter, down 7% from 2006, and $116.4 million for the first half, down 1% from the prior year.
-
This document contains financial statements and key metrics for Ryder System, Inc. for the second quarter and first half of 2007 compared to the same periods in 2006. It shows that total revenue increased 4% to $1.658 billion in the second quarter, with operating revenue also up 4% to $1.157 billion. For the first half, total revenue rose 5% to $3.252 billion and operating revenue increased 5% to $2.276 billion. The Fleet Management Solutions segment saw revenue remain flat at $1.037 billion in the second quarter, while Supply Chain Solutions revenue increased 16% and Dedicated Contract Carriage declined slightly.
This document provides financial information for Ryder System, Inc. for the second quarter and first half of 2007 compared to the same periods in 2006. Some key details include:
- Total revenue for the second quarter was $1.658 billion, up 4% from the prior year. First half revenue was $3.252 billion, up 5%.
- Fleet Management Solutions revenue was flat for the quarter but up 7% for the first half. Supply Chain Solutions revenue increased 16% for both periods.
- Net earnings were $65.1 million for the quarter, down 7% from 2006, and $116.4 million for the first half, down 1% from the prior year.
-
This document summarizes AES Corporation's financial performance for the second and third quarters of 2005. It reports that revenues for the first nine months of 2005 were $8.1 billion, a 17% increase over the same period in 2004, driven by higher electricity prices and currency effects. Net income was $1.047 billion for the nine months, up 71% compared to the same period in 2004. Adjusted earnings per share, which excludes certain one-time items, were $0.64 per share for the nine months, a 31% increase over the prior year. The document also provides guidance for full-year 2005 revenues to increase 16-17% over 2004 and adjusted earnings per share of $0.83-$0
The document provides financial information for DTE Energy Company for Q3 2005, including:
- Operating net income was $5 million compared to $97 million in Q3 2004. Electric utility income was $97 million and gas utility lost $18 million.
- Factors impacting results included unrealized mark-to-market losses at Energy Trading of $140 million, gain on land sale of $10 million, and impairment charges of $15 million.
- Consolidated statements of financial position and cash flows are provided for the company and its subsidiaries.
The Tribune Company reported financial results for the third quarter of 2007. Operating revenues decreased 4.1% compared to the third quarter of 2006. Net income was $152.8 million compared to $164.3 million in the prior year. Earnings per share increased due to gains from discontinued operations. Non-operating expenses included losses from derivatives and strategic transaction costs, but were partially offset by tax benefits.
The document provides reconciliations of certain Delta Airlines financial measures for various periods. It explains that Delta excludes certain expenses like maintenance costs for third parties and special items from its measures to provide a more meaningful evaluation of recurring operational performance. It summarizes Delta's reconciliations of measures like cost per available seat mile, operating margin, and pre-tax margin for different periods both including and excluding special items and non-recurring expenses. The document also provides projected financial measures for the December 2008 quarter.
This document summarizes Ryder System Inc.'s financial performance for the second quarter and first half of 2006 compared to the same periods in 2005. Some key highlights include:
- Total revenue increased 14.8% to $1.6 billion for the quarter and 14.3% to $3.1 billion for the first half.
- Earnings before income taxes rose 15.5% to $104.6 million for the quarter and 16.5% to $183.8 million for the first half.
- The Fleet Management Solutions segment saw revenue increase 8.2% for the quarter and 7.2% for the first half, while earnings before taxes grew 6.8% and
Ryder System, Inc. reported revenue of $1.496 billion for the first quarter of 2006, up 13.7% from $1.316 billion in the same period in 2005. Net earnings were $47.6 million compared to $41.5 million last year. Their Fleet Management Solutions segment saw revenue increase 6.1% to $981.2 million due to growth in fuel revenue and full service lease income. Supply Chain Solutions revenue jumped 35.4% to $469.5 million on strong demand for their services.
This document contains financial statements and key metrics for Ryder System, Inc. for the third quarter and first nine months of 2005 compared to the same periods in 2004. It shows that revenue increased 14.1% to $1.49 billion for the quarter and 10.8% to $4.2 billion for the nine month period. Net earnings increased 16.7% to $63.3 million for the quarter and 9.7% to $168.1 million for the nine months. The debt to equity ratio increased to 137% as of September 30, 2005 from 118% as of December 31, 2004.
Similar to delta air line Reconciliations2001 (20)
capital oneCapital One Financial Corp. Shareholders Meeting Presentationfinance13
The annual stockholder meeting document discusses Capital One's performance in 2007 and the challenges facing the banking industry. It notes that 2007 was the first year Capital One saw a decline in earnings per share. It also discusses the housing market correction and its prolonged negative impact. Additionally, it provides context on Capital One's deposit size, making it the 13th largest deposit-taking bank in the US.
capital oneLehman Brothers Eleventh Annual Lehman Financial Services Conferen...finance13
- Capital One is a top 10 bank and 14th largest depository institution in the US with $87.6B in deposits as of Q4 2007. It is also the 5th largest credit card issuer.
- Capital One is a diversified bank that is now primarily funded by deposits, with deposits comprising 47% of its managed liabilities as of Q4 2007, compared to other major banks that are more reliant on unsecured debt and securitizations.
- The presentation discusses Capital One's business overview, competitive positioning, and funding sources. Forward-looking statements are provided but subject to various risk factors that could cause actual results to differ materially.
capital oneSanford C. Bernstein & Co. Strategic Decisions Conference Presenta...finance13
This document discusses Capital One's approach to risk management and positioning for economic cycles. It notes that Capital One has transformed into a diversified bank with significant deposit funding. Capital One assumes recessions and degradation in underwriting and saves repricing for safety and soundness rather than assuming good times will continue. The document also discusses how different lending segments such as credit cards have performed relative to others such as auto loans during past economic downturns.
capital one Keefe, Bruyette & Woods, Inc. Diversified Financial Services Conf...finance13
Capital One is a top 10 bank and 5th largest credit card issuer. It has seen weakening credit metrics that reflect the deteriorating US economy. The company increased its loan loss allowance by $310M in Q108 to prepare for expected losses. While credit costs rose, increased revenue margins largely offset the impact. Capital One continues efficiency initiatives and managing its balance sheet to sustain profitability despite credit headwinds.
capital one Q2 2008 Capital One Financial Earnings Conference Call Presentationfinance13
Capital One reported second quarter 2008 results. Diluted EPS from continuing operations was $1.24, down from the prior quarter and year due to higher provision expense and lower revenue. Credit performance was largely in line with expectations, with managed charge-offs at 4.15% and delinquencies at 3.56%. Tighter underwriting led to portfolio contraction. The balance sheet remains strong with increased deposits and liquidity.
capital one Lehman Conference Presentationfinance13
Capital One provides a presentation on its financial performance and positioning. It discusses (1) executing on its vision of national lending and local banking, (2) delivering an operating profit of $463M despite significant credit headwinds, and (3) decisions that position it to navigate cyclical challenges and deliver value over the cycle through resilient businesses, conservative risk management, and lower lending lines.
capital one Q3 2008 Capital One Financial Earnings Conference Call Presentationfinance13
Capital One reported third quarter 2008 results with the following highlights:
1) Diluted EPS from continuing operations was $1.03, down from $1.21 in the third quarter of 2007 driven by higher provision expense.
2) Credit performance was largely in line with expectations, with managed charge-off and delinquency rates up from the previous quarter.
3) The balance sheet and diversified funding remained strong, with available liquidity of $32 billion and deposit growth of $6 billion from the previous quarter.
capital one Capital One Acquisition of Chevy Chase Bankfinance13
Capital One announced the acquisition of Chevy Chase Bank for $520 million. Chevy Chase has $11.6 billion in deposits and is the #1 bank in the Washington D.C. market. The acquisition enhances Capital One's local banking business and deposit funding. It is expected to be financially attractive with an estimated 13% internal rate of return and accretion to earnings per share in 2009 and 2010. Capital One took a $1.75 billion net credit mark on Chevy Chase's loans to mitigate credit risks.
capital one Printer Friendly Version of the Press Releasefinance13
Capital One reported a net loss for 2008 due to a large goodwill impairment in its Auto Finance business. It added $1 billion to loan loss reserves due to expectations of increasing losses. Credit performance deteriorated in the fourth quarter as the recession deepened. Deposits grew over 30% from the previous year and 10% in the last quarter.
capital onePrinter Friendly Version of the Conference Call Presentationfinance13
- Fourth quarter 2008 results showed a loss due to higher provision expense and a goodwill write-down. The losses were driven by deterioration in credit performance as economic conditions worsened.
- Credit losses and delinquency rates increased across all lending segments as unemployment rose. The allowance for loan losses was increased substantially.
- Deposits grew significantly while margins declined due to credit costs and mix shift to lower-yielding assets. Expenses declined due to cost management efforts.
- An impairment charge was taken for goodwill in the Auto Finance segment. The balance sheet and liquidity remain strong despite the difficult environment.
This document is Capital One's 1996 Annual Report. It summarizes that in 1996, Capital One achieved record financial results including net income increasing 23% to $155.3 million and managed loans increasing 23% to $12.8 billion. Capital One's success is driven by its proprietary information-based strategy which allows it to customize products, manage risk conservatively, and continuously innovate. The company added nearly 2,000 employees in 1996 and remains focused on testing new products.
Capital One had a remarkable year in 1997, setting records for financial and operating performance. They added 3.2 million new customers, ending the year with 11.7 million accounts. Capital One's success demonstrates the power of their information-based strategy and innovation. Going forward, they see opportunity for continued growth in the US and internationally by applying their strategy of mass customization.
Capital One Financial Corporation's 1998 Annual Report summarizes the company's strong financial performance in 1998. Capital One saw record growth across key metrics such as earnings per share, revenue, managed loans, and number of customer accounts. The company achieved net income of $275 million, a 45% increase over 1997. Capital One's success is powered by its Information-Based Strategy of using technology, data analysis, and scientific testing to customize financial products for each customer. This strategy has allowed the company to rapidly innovate and gain market share in the credit card industry.
Capital One Financial Corporation's 1999 Annual Report highlights the company's explosive growth over the past 5 years since its IPO, including doubling its customer base to 24 million and increasing revenues 512% between 1994 and 1999. The report discusses Capital One's continued focus on its information-based strategy of testing new ideas, customizing products for customers, and driving innovation to build one of the world's truly great companies with sustained financial performance and customer satisfaction. Key metrics show earnings per share and return on equity growth above 20% for the fifth consecutive year.
This annual report summarizes Capital One's growth and success in 2000. Some key points:
- Capital One has grown rapidly since its IPO in 1994, becoming one of the fastest growing and most profitable companies in the US.
- Through its proprietary information-based strategy (IBS), Capital One has created innovative credit card and loan products tailored to individual customers, reducing risk while delivering value.
- In 2000, Capital One added a record 10 million new customers, conducted over 45,000 tests of new ideas, and invested over $900 million in marketing.
- Capital One aims to continue its strong growth by expanding its product lines and customer base internationally, and by building its brand through advertising and
Falcon stands out as a top-tier P2P Invoice Discounting platform in India, bridging esteemed blue-chip companies and eager investors. Our goal is to transform the investment landscape in India by establishing a comprehensive destination for borrowers and investors with diverse profiles and needs, all while minimizing risk. What sets Falcon apart is the elimination of intermediaries such as commercial banks and depository institutions, allowing investors to enjoy higher yields.
Economic Risk Factor Update: June 2024 [SlideShare]Commonwealth
May’s reports showed signs of continued economic growth, said Sam Millette, director, fixed income, in his latest Economic Risk Factor Update.
For more market updates, subscribe to The Independent Market Observer at https://blog.commonwealth.com/independent-market-observer.
South Dakota State University degree offer diploma Transcriptynfqplhm
办理美国SDSU毕业证书制作南达科他州立大学假文凭定制Q微168899991做SDSU留信网教留服认证海牙认证改SDSU成绩单GPA做SDSU假学位证假文凭高仿毕业证GRE代考如何申请南达科他州立大学South Dakota State University degree offer diploma Transcript
^%$Zone1:+971)581248768’][* Legit & Safe #Abortion #Pills #For #Sale In #Duba...mayaclinic18
Whatsapp (+971581248768) Buy Abortion Pills In Dubai/ Qatar/Kuwait/Doha/Abu Dhabi/Alain/RAK City/Satwa/Al Ain/Abortion Pills For Sale In Qatar, Doha. Abu az Zuluf. Abu Thaylah. Ad Dawhah al Jadidah. Al Arish, Al Bida ash Sharqiyah, Al Ghanim, Al Ghuwariyah, Qatari, Abu Dhabi, Dubai.. WHATSAPP +971)581248768 Abortion Pills / Cytotec Tablets Available in Dubai, Sharjah, Abudhabi, Ajman, Alain, Fujeira, Ras Al Khaima, Umm Al Quwain., UAE, buy cytotec in Dubai– Where I can buy abortion pills in Dubai,+971582071918where I can buy abortion pills in Abudhabi +971)581248768 , where I can buy abortion pills in Sharjah,+97158207191 8where I can buy abortion pills in Ajman, +971)581248768 where I can buy abortion pills in Umm al Quwain +971)581248768 , where I can buy abortion pills in Fujairah +971)581248768 , where I can buy abortion pills in Ras al Khaimah +971)581248768 , where I can buy abortion pills in Alain+971)581248768 , where I can buy abortion pills in UAE +971)581248768 we are providing cytotec 200mg abortion pill in dubai, uae.Medication abortion offers an alternative to Surgical Abortion for women in the early weeks of pregnancy. Zone1:+971)581248768’][* Legit & Safe #Abortion #Pills #For #Sale In #Dubai Abu Dhabi Sharjah Deira Ajman Fujairah Ras Al Khaimah%^^%$Zone1:+971)581248768’][* Legit & Safe #Abortion #Pills #For #Sale In #Dubai Abu Dhabi Sharjah Deira Ajman Fujairah Ras Al Khaimah%^^%$Zone1:+971)581248768’][* Legit & Safe #Abortion #Pills #For #Sale In #Dubai Abu Dhabi Sharjah Deira Ajman Fujairah Ras Al Khaimah%^^%$Zone1:+971)581248768’][* Legit & Safe #Abortion #Pills #For #Sale In #Dubai Abu Dhabi Sharjah Deira Ajman Fujairah Ras Al Khaimah%^^%$Zone1:+971)581248768’][* Legit & Safe #Abortion #Pills #For #Sale In #Dubai Abu Dhabi Sharjah Deira Ajman Fujairah Ras Al Khaimah%^^%$Zone1:+971)581248768’][* Legit & Safe #Abortion #Pills #For #Sale In #Dubai Abu Dhabi Sharjah Deira Ajman Fujairah Ras Al Khaimah%^^%$Zone1:+971)581248768’][* Legit & Safe #Abortion #Pills #For #Sale In #Dubai Abu Dhabi Sharjah Deira Ajman Fujairah Ras Al Khaimah%^^%$Zone1:+971)581248768’][* Legit & Safe #Abortion #Pills #For #Sale In #Dubai Abu Dhabi Sharjah Deira Ajman Fujairah Ras Al Khaimah%^^%$Zone1:+971)581248768’][* Legit & Safe #Abortion #Pills #For #Sale In #Dubai Abu Dhabi Sharjah Deira Ajman Fujairah Ras Al Khaimah%^^%$Zone1:+971)581248768’][* Legit & Safe #Abortion #Pills #For #Sale In #Dubai Abu Dhabi Sharjah Deira Ajman Fujairah Ras Al Khaimah%^^%$Zone1:+971)581248768’][* Legit & Safe #Abortion #Pills #For #Sale In #Dubai Abu Dhabi Sharjah Deira Ajman Fujairah Ras Al Khaimah%^^%$Zone1:+971)581248768’][* Legit & Safe #Abortion #Pills #For #Sale In #Dubai Abu Dhabi Sharjah Deira Ajman Fujairah Ras Al Khaimah%^^%$Zone1:+971)581248768’][* Legit & Safe #Abortion #Pills #For #Sale In #Dubai Abu Dhabi Sharjah Deira Ajman Fujairah Ras Al Khaimah%^^%$Zone1:+971)581248768’][* Legit & Safe #Abortion #Pills #For #Sale In #Dubai Abu Dhabi Sharjah Deira Ajman
OJP data from firms like Vicinity Jobs have emerged as a complement to traditional sources of labour demand data, such as the Job Vacancy and Wages Survey (JVWS). Ibrahim Abuallail, PhD Candidate, University of Ottawa, presented research relating to bias in OJPs and a proposed approach to effectively adjust OJP data to complement existing official data (such as from the JVWS) and improve the measurement of labour demand.
Fabular Frames and the Four Ratio ProblemMajid Iqbal
Digital, interactive art showing the struggle of a society in providing for its present population while also saving planetary resources for future generations. Spread across several frames, the art is actually the rendering of real and speculative data. The stereographic projections change shape in response to prompts and provocations. Visitors interact with the model through speculative statements about how to increase savings across communities, regions, ecosystems and environments. Their fabulations combined with random noise, i.e. factors beyond control, have a dramatic effect on the societal transition. Things get better. Things get worse. The aim is to give visitors a new grasp and feel of the ongoing struggles in democracies around the world.
Stunning art in the small multiples format brings out the spatiotemporal nature of societal transitions, against backdrop issues such as energy, housing, waste, farmland and forest. In each frame we see hopeful and frightful interplays between spending and saving. Problems emerge when one of the two parts of the existential anaglyph rapidly shrinks like Arctic ice, as factors cross thresholds. Ecological wealth and intergenerational equity areFour at stake. Not enough spending could mean economic stress, social unrest and political conflict. Not enough saving and there will be climate breakdown and ‘bankruptcy’. So where does speculative design start and the gambling and betting end? Behind each fabular frame is a four ratio problem. Each ratio reflects the level of sacrifice and self-restraint a society is willing to accept, against promises of prosperity and freedom. Some values seem to stabilise a frame while others cause collapse. Get the ratios right and we can have it all. Get them wrong and things get more desperate.
Independent Study - College of Wooster Research (2023-2024) FDI, Culture, Glo...AntoniaOwensDetwiler
"Does Foreign Direct Investment Negatively Affect Preservation of Culture in the Global South? Case Studies in Thailand and Cambodia."
Do elements of globalization, such as Foreign Direct Investment (FDI), negatively affect the ability of countries in the Global South to preserve their culture? This research aims to answer this question by employing a cross-sectional comparative case study analysis utilizing methods of difference. Thailand and Cambodia are compared as they are in the same region and have a similar culture. The metric of difference between Thailand and Cambodia is their ability to preserve their culture. This ability is operationalized by their respective attitudes towards FDI; Thailand imposes stringent regulations and limitations on FDI while Cambodia does not hesitate to accept most FDI and imposes fewer limitations. The evidence from this study suggests that FDI from globally influential countries with high gross domestic products (GDPs) (e.g. China, U.S.) challenges the ability of countries with lower GDPs (e.g. Cambodia) to protect their culture. Furthermore, the ability, or lack thereof, of the receiving countries to protect their culture is amplified by the existence and implementation of restrictive FDI policies imposed by their governments.
My study abroad in Bali, Indonesia, inspired this research topic as I noticed how globalization is changing the culture of its people. I learned their language and way of life which helped me understand the beauty and importance of cultural preservation. I believe we could all benefit from learning new perspectives as they could help us ideate solutions to contemporary issues and empathize with others.
University of North Carolina at Charlotte degree offer diploma Transcripttscdzuip
办理美国UNCC毕业证书制作北卡大学夏洛特分校假文凭定制Q微168899991做UNCC留信网教留服认证海牙认证改UNCC成绩单GPA做UNCC假学位证假文凭高仿毕业证GRE代考如何申请北卡罗莱纳大学夏洛特分校University of North Carolina at Charlotte degree offer diploma Transcript
Governor Olli Rehn: Inflation down and recovery supported by interest rate cu...
delta air line Reconciliations2001
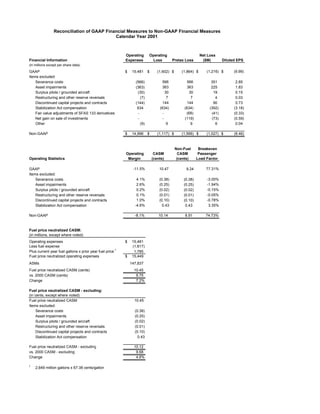
1. Reconciliation of GAAP Financial Measures to Non-GAAP Financial Measures
Calendar Year 2001
Operating Operating Net Loss
Financial Information Expenses Loss Pretax Loss ($M) Diluted EPS
(in millions except per share data)
(1,864) $ (1,216) $ (9.99)
GAAP $ 15,481 $ (1,602) $
Items excluded:
566 566
Severance costs (566) 351 2.85
363 363
Asset impairments (363) 225 1.83
30 30
Surplus pilots / grounded aircraft (30) 19 0.15
7 7
Restructuring and other reserve reversals (7) 4 0.03
144 144
Discontinued capital projects and contracts (144) 90 0.73
(634) (634)
Stabilization Act compensation 634 (392) (3.18)
(68)
Fair value adjustments of SFAS 133 derivatives - - (41) (0.33)
Net gain on sale of investments - - (119) (73) (0.59)
Other (9) 9 9 6 0.04
Non-GAAP $ 14,996 $ (1,117) $ (1,566) $ (1,027) $ (8.46)
Non-Fuel Breakeven
Operating CASM CASM Passenger
Operating Statistics Margin (cents) (cents) Load Factor
-11.5% 10.47 77.31%
GAAP 9.24
Items excluded:
4.1% (0.38) -3.00%
Severance costs (0.38)
2.6% (0.25) -1.94%
Asset impairments (0.25)
0.2% (0.02) -0.15%
Surplus pilots / grounded aircraft (0.02)
0.1% (0.01) -0.05%
Restructuring and other reserve reversals (0.01)
1.0% (0.10) -0.78%
Discontinued capital projects and contracts (0.10)
-4.6% 0.43 3.35%
Stabilization Act compensation 0.43
Non-GAAP -8.1% 10.14 8.91 74.73%
Fuel price neutralized CASM:
(in millions, except where noted)
Operating expenses $ 15,481
Less fuel expense (1,817)
Plus current year fuel gallons x prior year fuel price 1 1,785
Fuel price neutralized operating expenses $ 15,449
ASMs 147,837
Fuel price neutralized CASM (cents) 10.45
vs. 2000 CASM (cents) 9.75
Change 7.2%
Fuel price neutralized CASM - excluding:
(in cents, except where noted)
10.45
Fuel price neutralized CASM
Items excluded:
(0.38)
Severance costs
(0.25)
Asset impairments
(0.02)
Surplus pilots / grounded aircraft
(0.01)
Restructuring and other reserve reversals
(0.10)
Discontinued capital projects and contracts
0.43
Stabilization Act compensation
Fuel price neutralized CASM - excluding 10.12
vs. 2000 CASM - excluding 9.68
Change 4.6%
1
2,649 million gallons x 67.38 cents/gallon
2. Reconciliation of GAAP Financial Measures to Non-GAAP Financial Measures
December 2001 Quarter
Operating Operating Net Loss
Financial Information Expenses Loss Pretax Loss ($M) Diluted EPS
(in millions except per share data)
(1,135) $ (734) $ (5.98)
GAAP $ 3,985 $ (1,122) $
Items excluded:
498 498
Severance costs (498) 309 2.51
303 303
Asset impairments (303) 188 1.53
30 30
Surplus pilots / grounded aircraft (30) 19 0.15
7 7
Restructuring and other reserve reversals (7) 4 0.03
144 144
Discontinued capital projects and contracts (144) 90 0.73
(463) (463)
Stabilization Act compensation 463 (288) (2.34)
(24)
Fair value adjustments of SFAS 133 derivatives - - (15) (0.12)
Net gain on sale of investments - - (108) (66) (0.53)
Other (9) 9 9 7 0.05
Non-GAAP $ 3,457 $ (594) $ (739) $ (486) $ (3.97)
Non-Fuel Breakeven
Operating CASM CASM Passenger
Operating Statistics Margin (cents) (cents) Load Factor
-39.2% 11.67 90.69%
GAAP 10.59
Items excluded:
17.4% (1.46) -12.01%
Severance costs (1.46)
10.6% (0.89) -7.31%
Asset impairments (0.89)
1.0% (0.09) -0.73%
Surplus pilots / grounded aircraft (0.09)
0.2% (0.02) -0.16%
Restructuring and other reserve reversals (0.02)
5.0% (0.42) -3.48%
Discontinued capital projects and contracts (0.42)
-16.2% 1.36 11.17%
Stabilization Act compensation 1.36
0.3% (0.03) -0.22%
Other (0.02)
Non-GAAP -20.7% 10.12 9.05 77.96%
Fuel price neutralized CASM:
(in millions, except where noted)
Operating expenses 3,985
Less fuel expense (368)
(1)
Plus current year fuel gallons x prior year fuel price 445
Fuel price neutralized operating expenses 4,062
ASMs 34,141
Fuel price neutralized CASM (cents) 11.90
vs. December 2000 quarter CASM (cents) 9.96
Change 19.4%
Fuel price neutralized CASM - excluding:
(in cents, except where noted)
11.90
Fuel price neutralized CASM
Items excluded:
(1.46)
Severance costs
(0.89)
Asset impairments
(0.09)
Surplus pilots / grounded aircraft
(0.02)
Restructuring and other reserve reversals
(0.42)
Discontinued capital projects and contracts
1.36
Stabilization Act compensation
(0.03)
Other
Fuel price neutralized CASM - excluding 10.35
vs. 2000 CASM - excluding 9.96
Change 3.9%
(1)
592.9 million gallons x 75.05 cents/gallon
Net Debt-to-Capital Ratio
(in millions)
LT debt (including current maturities)
and short-term obligations $ 9,304
Capital leases (including current) 99
(2)
Net implied debt 6,701
Net total debt 16,104
ESOP preferred stock 255
Shareowners' equity 3,769
Total capital $ 20,128
Net debt-to-capital ratio 80%
(2)
Net implied debt represents the present value of our obligations under operating leases, net of cash, cash equivalents
and short term investments.
3. Reconciliation of GAAP Financial Measures to Non-GAAP Financial Measures
September 2001 Quarter
Operating Operating Net Loss
Financial Information Expenses Loss Pretax Loss ($M) Diluted EPS
(in millions except per share data)
(408) $ (259) $ (2.13)
GAAP $ 3,649 $ (251) $
Items excluded:
68 68
Severance costs (68) 42 0.34
(171) (171)
Stabilization Act compensation 171 (104) (0.85)
54
Fair value adjustments of SFAS 133 derivatives - - 33 0.27
(11)
Net gain on sale of investments - - (7) (0.06)
Non-GAAP $ 3,752 $ (354) $ (468) $ (295) $ (2.43)
Non-Fuel Breakeven
Operating CASM CASM Passenger
Operating Statistics Margin (cents) (cents) Load Factor
-7.4% 9.67 76.86%
GAAP 8.42
Items excluded:
2.0% (0.18) -1.51%
Severance costs (0.18)
-5.0% 0.45 3.82%
Stabilization Act compensation 0.45
Non-GAAP -10.4% 9.94 8.69 79.16%
Net Debt-to-Capital Ratio
(in millions)
LT debt (including current maturities)
and short-term obligations $ 8,953
Capital leases (including current) 116
(1)
Net implied debt 6,440
Net total debt 15,509
ESOP preferred stock 256
Shareowners' equity 4,635
Total capital $ 20,400
Net debt-to-capital ratio 76%
(1)
Net implied debt represents the present value of our obligations under operating leases, net of cash, cash equivalents
and short term investments.
4. Reconciliation of GAAP Financial Measures to Non-GAAP Financial Measures
June 2001 Quarter
Operating Operating Net Loss
Financial Information Expenses Loss Pretax Loss ($M) Diluted EPS
(in millions except per share data)
(99) $ (90) $ (0.76)
GAAP $ 3,890 $ (114) $
Items excluded:
60 60
Asset impairments (60) 36 0.30
(112)
Fair value adjustments of SFAS 133 derivatives - - (69) (0.57)
Non-GAAP $ 3,830 $ (54) $ (151) $ (123) $ (1.03)
Non-Fuel Breakeven
Operating CASM CASM Passenger
Operating Statistics Margin (cents) (cents) Load Factor
-3.0% 10.17 75.12%
GAAP 8.96
Items excluded:
1.7% (0.15) -1.24%
Asset impairments (0.15)
Non-GAAP -1.3% 10.02 8.81 73.88%
Net Debt-to-Capital Ratio
(in millions)
LT debt (including current maturities)
and short-term obligations $ 6,711
Capital leases (including current) 130
Net implied debt (1) 7,721
Net total debt 14,562
ESOP preferred stock 231
Shareowners' equity 5,030
Total capital $ 19,823
Net debt-to-capital ratio 73%
(1)
Net implied debt represents the present value of our obligations under operating leases, net of cash, cash equivalents
and short term investments.
5. Reconciliation of GAAP Financial Measures to Non-GAAP Financial Measures
March 2001 Quarter
Operating Operating Net Loss
Financial Information Expenses Loss Pretax Loss ($M) Diluted EPS
(in millions except per share data)
(222) $ (133) $ (1.11)
GAAP $ 3,957 $ (115) $
Items excluded:
17
Fair value adjustments of SFAS 133 derivatives - - 11 0.09
Non-GAAP $ 3,957 $ (115) $ (205) $ (122) $ (1.02)
Net Debt-to-Capital Ratio
(in millions)
LT debt (including current maturities)
and short-term obligations $ 5,959
Capital leases (including current) 134
(1)
Net implied debt 8,054
Net total debt 14,147
ESOP preferred stock 233
Shareowners' equity 5,128
Total capital $ 19,508
Net debt-to-capital ratio 73%
(1)
Net implied debt represents the present value of our obligations under operating leases, net of cash, cash equivalents
and short term investments.