SlideShare a Scribd company logo
RYDER SYSTEM, INC. AND SUBSIDIARIES

                                    CONSOLIDATED CONDENSED STATEMENTS OF EARNINGS - UNAUDITED
                                               Periods ended September 30, 2005 and 2004
                                                  (In millions, except per share amounts)


                                                                                        Three Months                  Nine Months
                                                                                     2005         2004              2005       2004


Revenue                                                                          $   1,490.6      1,305.9       $   4,196.1     3,787.1


Operating expense                                                                       657.2          589.9        1,902.6     1,690.1
Salaries and employee-related costs                                                     314.6          300.3         928.6          917.5
Subcontracted transportation                                                            183.5          108.0         425.1          300.5
Depreciation expense                                                                    188.1          178.1         556.3          528.8
Gains on vehicle sales, net                                                             (12.3)          (8.4)         (38.1)        (25.8)
Equipment rental                                                                         25.2           27.5          77.3           80.1
Interest expense                                                                         31.3           24.8          89.1           75.4
Miscellaneous income, net                                                                (2.1)          (0.4)          (7.4)         (4.3)
Restructuring and other recoveries, net                                                  (0.4)          (1.3)          (0.6)        (20.5)
                                                                                     1,385.1      1,218.5           3,932.9     3,541.8


Earnings before income taxes                                                            105.5           87.4         263.2          245.3
Provision for income taxes                                                               42.2           33.1          95.1           92.3
Net earnings                                                                     $       63.3           54.3    $    168.1          153.0


Earnings per common share - Diluted:
  Net earnings                                                                   $       0.98           0.83    $     2.60           2.33


Weighted-average shares outstanding - Diluted                                            64.5           65.5          64.8           65.7


  Memo: EPS Impact of restructuring and other recoveries, net                    $        -             0.01    $     0.01           0.20
RYDER SYSTEM, INC. AND SUBSIDIARIES

                                    CONSOLIDATED CONDENSED BALANCE SHEETS
                                                (Dollars in millions)


                                                                                      (unaudited)
                                                                                     September 30,      December 31,
                                                                                         2005              2004

Assets:

  Cash and cash equivalents                                                          $       140.5               101.0
  Other current assets                                                                     1,201.6             1,126.7
  Revenue earning equipment, net                                                           3,633.3             3,331.7
  Operating property and equipment, net                                                      485.5               479.6
  Other assets                                                                               583.1               598.9
                                                                                     $     6,044.0             5,637.9

Liabilities and shareholders' equity:

  Current liabilities (including current portion of long-term debt)                  $     1,278.3             1,454.8
  Long-term debt                                                                           1,888.6             1,393.7
  Other non-current liabilities (including deferred income taxes)                          1,260.2             1,279.2
  Shareholders' equity                                                                     1,616.9             1,510.2
                                                                                     $     6,044.0             5,637.9


                                                SELECTED KEY RATIOS

                                                                                     September 30,      December 31,
                                                                                         2005              2004

Debt to equity                                                                           137%              118%
Total obligations to equity (a) *                                                        146%              129%

                                                                                     Twelve months ended September 30,
                                                                                        2005               2004

Return on average shareholders' equity                                                   15.1%             14.1%
Return on average assets                                                                 4.0%              3.6%
Average asset turnover                                                                   96.6%             92.9%
Return on capital*                                                                       7.8%              7.5%


(a) Total obligations represent debt plus off-balance sheet equipment obligations.

* Non-GAAP financial measure; see reconciliation to closest GAAP financial measure included within this
release.
RYDER SYSTEM, INC. AND SUBSIDIARIES

                                                 BUSINESS SEGMENT REVENUE AND EARNINGS - UNAUDITED
                                                         Periods ended September 30, 2005 and 2004
                                                                     (Dollars in millions)

                                                                                               Three Months                              Nine Months
                                                                                    2005           2004         B(W)          2005            2004       B(W)
Revenue:
   Fleet Management Solutions:
      Full service lease                                                        $     447.4     $      444.0       0.8%   $   1,334.6     $   1,319.1       1.2%
      Contract maintenance                                                             34.0             34.5     (1.5%)         101.9           102.6     (0.7%)
      Contract-related maintenance                                                     48.3             43.1      12.2%         146.2           131.5      11.2%
      Commercial rental                                                               183.4            176.7       3.8%         511.0           475.0       7.6%
      Other                                                                            15.5             15.3       0.9%          47.6            53.1    (10.3%)
      Fuel                                                                            282.2            205.1      37.6%         763.7           571.0      33.8%
        Total Fleet Management Solutions                                            1,010.8            918.7      10.0%       2,905.0         2,652.3       9.5%
   Supply Chain Solutions                                                             433.4            338.5      28.0%       1,155.1           986.6      17.1%
   Dedicated Contract Carriage                                                        139.0            125.9      10.4%         400.8           377.7       6.1%
   Eliminations                                                                       (92.6)           (77.2)   (20.0%)        (264.8)         (229.5)   (15.4%)
        Total revenue                                                           $   1,490.6          1,305.9      14.1%   $   4,196.1         3,787.1      10.8%

Business segment earnings:
 Earnings before income taxes:
    Fleet Management Solutions                                                  $     102.6             85.8     19.6%    $    262.4           223.2      17.6%
    Supply Chain Solutions                                                             10.6              9.8       8.7%         25.4            25.7      (0.9%)
    Dedicated Contract Carriage                                                         9.2              7.5     22.4%          24.8            22.6        9.5%
    Eliminations                                                                       (8.2)            (8.0)    (3.8%)        (23.3)          (23.4)       0.5%
                                                                                      114.2             95.1     20.1%         289.3           248.1       16.6%
  Unallocated Central Support Services                                                 (9.1)            (9.0)    (1.6%)        (26.7)          (23.3)    (14.7%)
  Earnings before restructuring and other recoveries, net
    and income taxes                                                                  105.1             86.1      22.0%        262.6           224.8       16.8%
  Restructuring and other recoveries, net                                               0.4              1.3    (65.7%)          0.6            20.5     (96.9%)
  Earnings before income taxes                                                        105.5             87.4      20.7%        263.2           245.3        7.3%
  Provision for income taxes                                                           42.2             33.1    (27.3%)         95.1            92.3      (3.0%)
  Net earnings                                                                  $      63.3             54.3      16.7%   $    168.1           153.0        9.9%


Note: Certain prior period amounts have been reclassified to conform to current year presentation.
Amounts may not recalculate due to rounding.
RYDER SYSTEM, INC. AND SUBSIDIARIES

                                                BUSINESS SEGMENT INFORMATION - UNAUDITED
                                                   Periods ended September 30, 2005 and 2004
                                                               (Dollars in millions)

                                                                                  Three Months                                Nine Months
                                                                       2005            2004          B(W)          2005            2004       B(W)

Fleet Management Solutions

Total revenue                                                      $   1,010.8          918.7         10.0%    $   2,905.0         2,652.3      9.5%
Fuel revenue                                                            (282.2)        (205.1)        37.6%         (763.7)         (571.0)    33.8%
Operating revenue *                                                $     728.6          713.6          2.1%    $   2,141.3         2,081.3      2.9%

Segment net before tax earnings                                    $     102.6           85.8         19.6%    $    262.4           223.2      17.6%

Earnings before income taxes as % of total revenue                       10.1%           9.3%                        9.0%            8.4%

Earnings before income taxes as % of operating revenue *                 14.1%          12.0%                       12.3%           10.7%


Supply Chain Solutions

Total revenue                                                      $     433.4          338.5         28.0%    $   1,155.1           986.6     17.1%
Subcontracted transportation                                            (179.1)        (104.9)        70.7%         (413.5)         (293.8)    40.7%
Operating revenue *                                                $     254.3          233.6          8.9%    $     741.6           692.8      7.0%

Segment net before tax earnings                                    $      10.6            9.8          8.7%    $      25.4            25.7     (0.9%)

Earnings before income taxes as % of total revenue                        2.4%           2.9%                        2.2%            2.6%

Earnings before income taxes as % of operating revenue *                  4.2%           4.2%                        3.4%            3.7%

Memo: Fuel costs                                                   $      23.8           15.9        (49.7%)   $      66.5            46.5    (43.0%)

Dedicated Contract Carriage

Total revenue                                                      $     139.0          125.9         10.4%    $    400.8           377.7       6.1%
Subcontracted transportation                                              (4.4)          (3.2)        39.8%         (11.6)           (6.7)     74.1%
Operating revenue *                                                $     134.6          122.7          9.7%    $    389.2           371.0       4.9%

Segment net before tax earnings                                    $       9.2            7.5         22.4%    $      24.8            22.6      9.5%

Earnings before income taxes as % of total revenue                        6.6%           6.0%                        6.2%            6.0%

Earnings before income taxes as % of operating revenue *                  6.8%           6.1%                        6.4%            6.1%

Memo: Fuel costs                                                   $      24.9           18.2        (36.8%)   $      67.7            52.3    (29.4%)

* Non-GAAP financial measure
Note: Certain prior period amounts have been reclassified to conform to current year presentation.
Amounts may not recalculate due to rounding.
RYDER SYSTEM, INC. AND SUBSIDIARIES

                                        NON-GAAP FINANCIAL MEASURE RECONCILIATIONS - UNAUDITED
                                                  Periods ended September 30, 2005 and 2004
                                                     (In millions, except per share amounts)


FREE CASH FLOW RECONCILIATION                                                         Nine Months
                                                                              2005                  2004

Net cash provided by operating activities                             $             469.1                   656.5
Net cash used in investing activities                                              (817.5)                 (494.7)
Free cash flow *                                                      $            (348.4)                  161.8

DEBT TO EQUITY RECONCILIATION                                             September 30,                                  December 31,
                                                                              2005               % to Equity                                  % to Equity
                                                                                                                            2004

On-balance sheet debt                                                 $           2,218.3           137%             $          1,783.2          118%
       PV of minimum lease payments and guaranteed residual
       values under operating leases for vehicles (a)                               145.4                                         161.1
Total obligations *                                                   $           2,363.7           146%             $          1,944.3          129%

EPS RECONCILIATION                                                                   Three Months                                  Nine Months
                                                                              2005                  2004                    2005                 2004
Earnings per share                                                    $               0.98                  0.83     $             2.60                 2.33
Less: Tax change                                                                       -                     -                     0.12                  -
      Gain on sale of headquarters, after tax                                          -                    0.01                    -                   0.23
Earnings per share excluding tax change and headquarters
complex sale*                                                         $               0.98   $              0.82     $             2.48   $             2.09

RETURN ON CAPITAL RECONCILIATION
                                                                          Twelve months ended September 30,
                                                                               2005              2004

      Net earnings — as reported [1]                                  $              230.8                 192.4
      Restructuring charges (recoveries), net                                          2.2                 (17.0)
      Income taxes                                                                   118.3                 114.7
      Earnings before net restructuring charges (recoveries) and
      income taxes                                                                  351.3                   290.1
      Interest expense                                                              113.8                   101.1
      Implied interest expense from off-balance sheet debt                            7.0                     9.2
        Adjusted earnings before income taxes                                       472.1                   400.4
      Adjusted income taxes                                                        (182.7)                 (149.2)
      Adjusted net earnings* [2]                                      $             289.4    $              251.2

      Average total debt                                              $           2,035.3              1,822.6
      Average shareholders' equity                                                1,530.6              1,365.3
      Total capital — as reported [3]                                             3,565.9              3,187.9
      Average off-balance sheet debt                                                160.4                149.3
      Adjusted total capital * [4]                                    $           3,726.3    $         3,337.2

      Return on capital — as reported [1] / [3]                                       6.5%                  6.0%
      Return on capital * [2] / [4]                                                   7.8%                  7.5%

   (a) Discounted at the incremental borrowing rate at lease inception.

    * Non-GAAP financial measure

      Note: Earnings per share amounts are calculated independently for each component and may not be additive due to rounding.

More Related Content

Viewers also liked

Instructivo electoral jsre jse
Instructivo electoral jsre jseInstructivo electoral jsre jse
Instructivo electoral jsre jsepsfaecuador
 
CT designs
CT designsCT designs
CT designs
Hedvig_Alice
 
Soloway final presentation
Soloway final presentationSoloway final presentation
Soloway final presentationjaccapp
 
PXD MOBICHIP
PXD MOBICHIPPXD MOBICHIP
PXD MOBICHIP
Tatjana Stankovic
 
Wai worry project powerpoint
Wai worry project powerpointWai worry project powerpoint
Wai worry project powerpointLynley Edmonds
 
Effects of extreme temperature
Effects of extreme temperatureEffects of extreme temperature
Effects of extreme temperature
Matt Spaul
 
office space in bangalore
office space in bangaloreoffice space in bangalore
office space in bangalore
Medha Konidela
 
Les Ateliers de L'Observatoire 2014
Les Ateliers de L'Observatoire 2014Les Ateliers de L'Observatoire 2014
Les Ateliers de L'Observatoire 2014
BPCE
 
Lintech round rail_bearings_specsheet
Lintech round rail_bearings_specsheetLintech round rail_bearings_specsheet
Lintech round rail_bearings_specsheet
Electromate
 
Livret recettes bridelight faciles (2)
Livret recettes bridelight faciles (2)Livret recettes bridelight faciles (2)
Livret recettes bridelight faciles (2)sarah Benmerzouk
 
Face Vila Mariana
Face Vila MarianaFace Vila Mariana
Face Vila Mariana
Sergio Pripas
 
Dräger PID Sensors For Portable Gas Detectors - Operating Instructions
Dräger PID Sensors For Portable Gas Detectors - Operating InstructionsDräger PID Sensors For Portable Gas Detectors - Operating Instructions
Dräger PID Sensors For Portable Gas Detectors - Operating Instructions
Thorne & Derrick UK
 
Creating Customer Insistence Poster
Creating Customer Insistence PosterCreating Customer Insistence Poster
Creating Customer Insistence Poster
theinnovator
 
Propuesta programatica
Propuesta programaticaPropuesta programatica
Propuesta programatica
Nicolás Gutiérrez
 
EUpdates Sep14—Indian & Global Economic Indicators
EUpdates Sep14—Indian & Global Economic IndicatorsEUpdates Sep14—Indian & Global Economic Indicators
EUpdates Sep14—Indian & Global Economic Indicators
Ecofin Surge
 

Viewers also liked (20)

Instructivo electoral jsre jse
Instructivo electoral jsre jseInstructivo electoral jsre jse
Instructivo electoral jsre jse
 
CT designs
CT designsCT designs
CT designs
 
Soloway final presentation
Soloway final presentationSoloway final presentation
Soloway final presentation
 
PXD MOBICHIP
PXD MOBICHIPPXD MOBICHIP
PXD MOBICHIP
 
Wai worry project powerpoint
Wai worry project powerpointWai worry project powerpoint
Wai worry project powerpoint
 
Pilgrim
PilgrimPilgrim
Pilgrim
 
Effects of extreme temperature
Effects of extreme temperatureEffects of extreme temperature
Effects of extreme temperature
 
office space in bangalore
office space in bangaloreoffice space in bangalore
office space in bangalore
 
Les Ateliers de L'Observatoire 2014
Les Ateliers de L'Observatoire 2014Les Ateliers de L'Observatoire 2014
Les Ateliers de L'Observatoire 2014
 
Lintech round rail_bearings_specsheet
Lintech round rail_bearings_specsheetLintech round rail_bearings_specsheet
Lintech round rail_bearings_specsheet
 
São carlos do pinhal, av
São carlos do pinhal, avSão carlos do pinhal, av
São carlos do pinhal, av
 
Section views
Section viewsSection views
Section views
 
Auxilary views
Auxilary viewsAuxilary views
Auxilary views
 
Livret recettes bridelight faciles (2)
Livret recettes bridelight faciles (2)Livret recettes bridelight faciles (2)
Livret recettes bridelight faciles (2)
 
Face Vila Mariana
Face Vila MarianaFace Vila Mariana
Face Vila Mariana
 
Dräger PID Sensors For Portable Gas Detectors - Operating Instructions
Dräger PID Sensors For Portable Gas Detectors - Operating InstructionsDräger PID Sensors For Portable Gas Detectors - Operating Instructions
Dräger PID Sensors For Portable Gas Detectors - Operating Instructions
 
Creating Customer Insistence Poster
Creating Customer Insistence PosterCreating Customer Insistence Poster
Creating Customer Insistence Poster
 
Propuesta programatica
Propuesta programaticaPropuesta programatica
Propuesta programatica
 
RIDVAN UYSAL
RIDVAN UYSALRIDVAN UYSAL
RIDVAN UYSAL
 
EUpdates Sep14—Indian & Global Economic Indicators
EUpdates Sep14—Indian & Global Economic IndicatorsEUpdates Sep14—Indian & Global Economic Indicators
EUpdates Sep14—Indian & Global Economic Indicators
 

Similar to RyderPresReleasTablesQ32005

RYDERFINAL 2Q05TablesFinal
RYDERFINAL 2Q05TablesFinalRYDERFINAL 2Q05TablesFinal
RYDERFINAL 2Q05TablesFinalfinance44
 
RYDERFINAL3QTables
 RYDERFINAL3QTables RYDERFINAL3QTables
RYDERFINAL3QTablesfinance44
 
RYDERFINAL2Q06_PRTables
RYDERFINAL2Q06_PRTablesRYDERFINAL2Q06_PRTables
RYDERFINAL2Q06_PRTablesfinance44
 
RYDERFINAL Q405tables
RYDERFINAL Q405tablesRYDERFINAL Q405tables
RYDERFINAL Q405tablesfinance44
 
RYDERFINAL Q406tables
RYDERFINAL Q406tablesRYDERFINAL Q406tables
RYDERFINAL Q406tablesfinance44
 
RYDERFINAL Q406tables
RYDERFINAL Q406tablesRYDERFINAL Q406tables
RYDERFINAL Q406tablesfinance44
 
RYDERFINAL 1Q06FinancialInfo
RYDERFINAL 1Q06FinancialInfoRYDERFINAL 1Q06FinancialInfo
RYDERFINAL 1Q06FinancialInfofinance44
 
RYDERFINAL 1Q06FinancialInfo
RYDERFINAL  1Q06FinancialInfoRYDERFINAL  1Q06FinancialInfo
RYDERFINAL 1Q06FinancialInfofinance44
 
RYDERFINAL Q105financialinfo
RYDERFINAL Q105financialinfoRYDERFINAL Q105financialinfo
RYDERFINAL Q105financialinfofinance44
 
RYDERFINAL_PR_TABLES_Q308
RYDERFINAL_PR_TABLES_Q308RYDERFINAL_PR_TABLES_Q308
RYDERFINAL_PR_TABLES_Q308finance44
 
RYDERFINAL_PR_TABLES_Q308
RYDERFINAL_PR_TABLES_Q308RYDERFINAL_PR_TABLES_Q308
RYDERFINAL_PR_TABLES_Q308finance44
 
updated3Q07PRTABLES%20v2
updated3Q07PRTABLES%20v2updated3Q07PRTABLES%20v2
updated3Q07PRTABLES%20v2finance44
 
updated3Q07PRTABLES%20v2
updated3Q07PRTABLES%20v2updated3Q07PRTABLES%20v2
updated3Q07PRTABLES%20v2finance44
 
updated3Q07PRTABLES%20v2
updated3Q07PRTABLES%20v2updated3Q07PRTABLES%20v2
updated3Q07PRTABLES%20v2finance44
 
updated3Q07PRTABLES%20v2
updated3Q07PRTABLES%20v2updated3Q07PRTABLES%20v2
updated3Q07PRTABLES%20v2finance44
 
updated3Q07PRTABLES%20v2
updated3Q07PRTABLES%20v2updated3Q07PRTABLES%20v2
updated3Q07PRTABLES%20v2finance44
 
updated3Q07PRTABLES%20v2
updated3Q07PRTABLES%20v2updated3Q07PRTABLES%20v2
updated3Q07PRTABLES%20v2finance44
 
RYDERFINAL Q207tables
RYDERFINAL Q207tablesRYDERFINAL Q207tables
RYDERFINAL Q207tablesfinance44
 

Similar to RyderPresReleasTablesQ32005 (20)

RYDERFINAL 2Q05TablesFinal
RYDERFINAL 2Q05TablesFinalRYDERFINAL 2Q05TablesFinal
RYDERFINAL 2Q05TablesFinal
 
RYDERFINAL3QTables
 RYDERFINAL3QTables RYDERFINAL3QTables
RYDERFINAL3QTables
 
RYDERFINAL2Q06_PRTables
RYDERFINAL2Q06_PRTablesRYDERFINAL2Q06_PRTables
RYDERFINAL2Q06_PRTables
 
RYDERFINAL Q405tables
RYDERFINAL Q405tablesRYDERFINAL Q405tables
RYDERFINAL Q405tables
 
RYDERFINAL Q406tables
RYDERFINAL Q406tablesRYDERFINAL Q406tables
RYDERFINAL Q406tables
 
RYDERFINAL Q406tables
RYDERFINAL Q406tablesRYDERFINAL Q406tables
RYDERFINAL Q406tables
 
RYDERFINAL 1Q06FinancialInfo
RYDERFINAL 1Q06FinancialInfoRYDERFINAL 1Q06FinancialInfo
RYDERFINAL 1Q06FinancialInfo
 
RYDERFINAL 1Q06FinancialInfo
RYDERFINAL  1Q06FinancialInfoRYDERFINAL  1Q06FinancialInfo
RYDERFINAL 1Q06FinancialInfo
 
RYDERFINAL Q105financialinfo
RYDERFINAL Q105financialinfoRYDERFINAL Q105financialinfo
RYDERFINAL Q105financialinfo
 
RYDERFINAL_PR_TABLES_Q308
RYDERFINAL_PR_TABLES_Q308RYDERFINAL_PR_TABLES_Q308
RYDERFINAL_PR_TABLES_Q308
 
RYDERFINAL_PR_TABLES_Q308
RYDERFINAL_PR_TABLES_Q308RYDERFINAL_PR_TABLES_Q308
RYDERFINAL_PR_TABLES_Q308
 
updated3Q07PRTABLES%20v2
updated3Q07PRTABLES%20v2updated3Q07PRTABLES%20v2
updated3Q07PRTABLES%20v2
 
updated3Q07PRTABLES%20v2
updated3Q07PRTABLES%20v2updated3Q07PRTABLES%20v2
updated3Q07PRTABLES%20v2
 
updated3Q07PRTABLES%20v2
updated3Q07PRTABLES%20v2updated3Q07PRTABLES%20v2
updated3Q07PRTABLES%20v2
 
updated3Q07PRTABLES%20v2
updated3Q07PRTABLES%20v2updated3Q07PRTABLES%20v2
updated3Q07PRTABLES%20v2
 
updated3Q07PRTABLES%20v2
updated3Q07PRTABLES%20v2updated3Q07PRTABLES%20v2
updated3Q07PRTABLES%20v2
 
updated3Q07PRTABLES%20v2
updated3Q07PRTABLES%20v2updated3Q07PRTABLES%20v2
updated3Q07PRTABLES%20v2
 
Q207tables
Q207tablesQ207tables
Q207tables
 
Q207tables
Q207tablesQ207tables
Q207tables
 
RYDERFINAL Q207tables
RYDERFINAL Q207tablesRYDERFINAL Q207tables
RYDERFINAL Q207tables
 

More from finance44

oshkosh Q106_Presentation
oshkosh   Q106_Presentationoshkosh   Q106_Presentation
oshkosh Q106_Presentationfinance44
 
oshkosh Q206_Earnings_Presentation
oshkosh   Q206_Earnings_Presentationoshkosh   Q206_Earnings_Presentation
oshkosh Q206_Earnings_Presentationfinance44
 
oshkosh Q306_Presentation
oshkosh   Q306_Presentationoshkosh   Q306_Presentation
oshkosh Q306_Presentationfinance44
 
oshkosh Q107_Slides
oshkosh   Q107_Slidesoshkosh   Q107_Slides
oshkosh Q107_Slidesfinance44
 
oshkosh Q207_Slides
oshkosh   Q207_Slidesoshkosh   Q207_Slides
oshkosh Q207_Slidesfinance44
 
oshkosh Q32007slides
oshkosh   Q32007slidesoshkosh   Q32007slides
oshkosh Q32007slidesfinance44
 
oshkosh Q407_Earnings
oshkosh   Q407_Earningsoshkosh   Q407_Earnings
oshkosh Q407_Earningsfinance44
 
oshkosh Q108_earnings_slides
oshkosh   Q108_earnings_slidesoshkosh   Q108_earnings_slides
oshkosh Q108_earnings_slidesfinance44
 
oshkosh Q208_Slides
oshkosh   Q208_Slidesoshkosh   Q208_Slides
oshkosh Q208_Slidesfinance44
 
oshkosh Q308_Slides
oshkosh   Q308_Slidesoshkosh   Q308_Slides
oshkosh Q308_Slidesfinance44
 
OSK_Q4_2008_Earnings_Release_Slides
OSK_Q4_2008_Earnings_Release_SlidesOSK_Q4_2008_Earnings_Release_Slides
OSK_Q4_2008_Earnings_Release_Slidesfinance44
 
oshkosh Goldman_110508
oshkosh   Goldman_110508oshkosh   Goldman_110508
oshkosh Goldman_110508finance44
 
oshkosh Baird_111208
oshkosh   Baird_111208oshkosh   Baird_111208
oshkosh Baird_111208finance44
 
oshkosh B9FAB733-F810-4AE7-A95B-4388C6B08318_Cowen_020509
oshkosh   B9FAB733-F810-4AE7-A95B-4388C6B08318_Cowen_020509oshkosh   B9FAB733-F810-4AE7-A95B-4388C6B08318_Cowen_020509
oshkosh B9FAB733-F810-4AE7-A95B-4388C6B08318_Cowen_020509finance44
 
oshkosh Q108_earnings_slides
oshkosh   Q108_earnings_slidesoshkosh   Q108_earnings_slides
oshkosh Q108_earnings_slidesfinance44
 
oshkosh Q208_Slides
oshkosh   Q208_Slidesoshkosh   Q208_Slides
oshkosh Q208_Slidesfinance44
 
oshkosh Q308_Slides
oshkosh   Q308_Slidesoshkosh   Q308_Slides
oshkosh Q308_Slidesfinance44
 
oshkosh OSK_Q4_2008_Earnings_Release_Slides
oshkosh   OSK_Q4_2008_Earnings_Release_Slidesoshkosh   OSK_Q4_2008_Earnings_Release_Slides
oshkosh OSK_Q4_2008_Earnings_Release_Slidesfinance44
 

More from finance44 (20)

oshkosh Q106_Presentation
oshkosh   Q106_Presentationoshkosh   Q106_Presentation
oshkosh Q106_Presentation
 
oshkosh Q206_Earnings_Presentation
oshkosh   Q206_Earnings_Presentationoshkosh   Q206_Earnings_Presentation
oshkosh Q206_Earnings_Presentation
 
oshkosh Q306_Presentation
oshkosh   Q306_Presentationoshkosh   Q306_Presentation
oshkosh Q306_Presentation
 
OSK_101606
OSK_101606OSK_101606
OSK_101606
 
Oshkosh
OshkoshOshkosh
Oshkosh
 
oshkosh Q107_Slides
oshkosh   Q107_Slidesoshkosh   Q107_Slides
oshkosh Q107_Slides
 
oshkosh Q207_Slides
oshkosh   Q207_Slidesoshkosh   Q207_Slides
oshkosh Q207_Slides
 
oshkosh Q32007slides
oshkosh   Q32007slidesoshkosh   Q32007slides
oshkosh Q32007slides
 
oshkosh Q407_Earnings
oshkosh   Q407_Earningsoshkosh   Q407_Earnings
oshkosh Q407_Earnings
 
oshkosh Q108_earnings_slides
oshkosh   Q108_earnings_slidesoshkosh   Q108_earnings_slides
oshkosh Q108_earnings_slides
 
oshkosh Q208_Slides
oshkosh   Q208_Slidesoshkosh   Q208_Slides
oshkosh Q208_Slides
 
oshkosh Q308_Slides
oshkosh   Q308_Slidesoshkosh   Q308_Slides
oshkosh Q308_Slides
 
OSK_Q4_2008_Earnings_Release_Slides
OSK_Q4_2008_Earnings_Release_SlidesOSK_Q4_2008_Earnings_Release_Slides
OSK_Q4_2008_Earnings_Release_Slides
 
oshkosh Goldman_110508
oshkosh   Goldman_110508oshkosh   Goldman_110508
oshkosh Goldman_110508
 
oshkosh Baird_111208
oshkosh   Baird_111208oshkosh   Baird_111208
oshkosh Baird_111208
 
oshkosh B9FAB733-F810-4AE7-A95B-4388C6B08318_Cowen_020509
oshkosh   B9FAB733-F810-4AE7-A95B-4388C6B08318_Cowen_020509oshkosh   B9FAB733-F810-4AE7-A95B-4388C6B08318_Cowen_020509
oshkosh B9FAB733-F810-4AE7-A95B-4388C6B08318_Cowen_020509
 
oshkosh Q108_earnings_slides
oshkosh   Q108_earnings_slidesoshkosh   Q108_earnings_slides
oshkosh Q108_earnings_slides
 
oshkosh Q208_Slides
oshkosh   Q208_Slidesoshkosh   Q208_Slides
oshkosh Q208_Slides
 
oshkosh Q308_Slides
oshkosh   Q308_Slidesoshkosh   Q308_Slides
oshkosh Q308_Slides
 
oshkosh OSK_Q4_2008_Earnings_Release_Slides
oshkosh   OSK_Q4_2008_Earnings_Release_Slidesoshkosh   OSK_Q4_2008_Earnings_Release_Slides
oshkosh OSK_Q4_2008_Earnings_Release_Slides
 

Recently uploaded

how can I sell my pi coins for cash in a pi APP
how can I sell my pi coins for cash in a pi APPhow can I sell my pi coins for cash in a pi APP
how can I sell my pi coins for cash in a pi APP
DOT TECH
 
The European Unemployment Puzzle: implications from population aging
The European Unemployment Puzzle: implications from population agingThe European Unemployment Puzzle: implications from population aging
The European Unemployment Puzzle: implications from population aging
GRAPE
 
Economics and Economic reasoning Chap. 1
Economics and Economic reasoning Chap. 1Economics and Economic reasoning Chap. 1
Economics and Economic reasoning Chap. 1
Fitri Safira
 
how to sell pi coins effectively (from 50 - 100k pi)
how to sell pi coins effectively (from 50 - 100k  pi)how to sell pi coins effectively (from 50 - 100k  pi)
how to sell pi coins effectively (from 50 - 100k pi)
DOT TECH
 
when will pi network coin be available on crypto exchange.
when will pi network coin be available on crypto exchange.when will pi network coin be available on crypto exchange.
when will pi network coin be available on crypto exchange.
DOT TECH
 
What website can I sell pi coins securely.
What website can I sell pi coins securely.What website can I sell pi coins securely.
What website can I sell pi coins securely.
DOT TECH
 
一比一原版Birmingham毕业证伯明翰大学|学院毕业证成绩单如何办理
一比一原版Birmingham毕业证伯明翰大学|学院毕业证成绩单如何办理一比一原版Birmingham毕业证伯明翰大学|学院毕业证成绩单如何办理
一比一原版Birmingham毕业证伯明翰大学|学院毕业证成绩单如何办理
betoozp
 
Latino Buying Power - May 2024 Presentation for Latino Caucus
Latino Buying Power - May 2024 Presentation for Latino CaucusLatino Buying Power - May 2024 Presentation for Latino Caucus
Latino Buying Power - May 2024 Presentation for Latino Caucus
Danay Escanaverino
 
Falcon Invoice Discounting: Optimizing Returns with Minimal Risk
Falcon Invoice Discounting: Optimizing Returns with Minimal RiskFalcon Invoice Discounting: Optimizing Returns with Minimal Risk
Falcon Invoice Discounting: Optimizing Returns with Minimal Risk
Falcon Invoice Discounting
 
how to sell pi coins on Binance exchange
how to sell pi coins on Binance exchangehow to sell pi coins on Binance exchange
how to sell pi coins on Binance exchange
DOT TECH
 
一比一原版BCU毕业证伯明翰城市大学毕业证成绩单如何办理
一比一原版BCU毕业证伯明翰城市大学毕业证成绩单如何办理一比一原版BCU毕业证伯明翰城市大学毕业证成绩单如何办理
一比一原版BCU毕业证伯明翰城市大学毕业证成绩单如何办理
ydubwyt
 
PF-Wagner's Theory of Public Expenditure.pptx
PF-Wagner's Theory of Public Expenditure.pptxPF-Wagner's Theory of Public Expenditure.pptx
PF-Wagner's Theory of Public Expenditure.pptx
GunjanSharma28848
 
what is a pi whale and how to access one.
what is a pi whale and how to access one.what is a pi whale and how to access one.
what is a pi whale and how to access one.
DOT TECH
 
Scope Of Macroeconomics introduction and basic theories
Scope Of Macroeconomics introduction and basic theoriesScope Of Macroeconomics introduction and basic theories
Scope Of Macroeconomics introduction and basic theories
nomankalyar153
 
how to sell pi coins in all Africa Countries.
how to sell pi coins in all Africa Countries.how to sell pi coins in all Africa Countries.
how to sell pi coins in all Africa Countries.
DOT TECH
 
NO1 Uk Black Magic Specialist Expert In Sahiwal, Okara, Hafizabad, Mandi Bah...
NO1 Uk Black Magic Specialist Expert In Sahiwal, Okara, Hafizabad,  Mandi Bah...NO1 Uk Black Magic Specialist Expert In Sahiwal, Okara, Hafizabad,  Mandi Bah...
NO1 Uk Black Magic Specialist Expert In Sahiwal, Okara, Hafizabad, Mandi Bah...
Amil Baba Dawood bangali
 
655264371-checkpoint-science-past-papers-april-2023.pdf
655264371-checkpoint-science-past-papers-april-2023.pdf655264371-checkpoint-science-past-papers-april-2023.pdf
655264371-checkpoint-science-past-papers-april-2023.pdf
morearsh02
 
Summary of financial results for 1Q2024
Summary of financial  results for 1Q2024Summary of financial  results for 1Q2024
Summary of financial results for 1Q2024
InterCars
 
Monthly Economic Monitoring of Ukraine No. 232, May 2024
Monthly Economic Monitoring of Ukraine No. 232, May 2024Monthly Economic Monitoring of Ukraine No. 232, May 2024
NO1 Uk Divorce problem uk all amil baba in karachi,lahore,pakistan talaq ka m...
NO1 Uk Divorce problem uk all amil baba in karachi,lahore,pakistan talaq ka m...NO1 Uk Divorce problem uk all amil baba in karachi,lahore,pakistan talaq ka m...
NO1 Uk Divorce problem uk all amil baba in karachi,lahore,pakistan talaq ka m...
Amil Baba Dawood bangali
 

Recently uploaded (20)

how can I sell my pi coins for cash in a pi APP
how can I sell my pi coins for cash in a pi APPhow can I sell my pi coins for cash in a pi APP
how can I sell my pi coins for cash in a pi APP
 
The European Unemployment Puzzle: implications from population aging
The European Unemployment Puzzle: implications from population agingThe European Unemployment Puzzle: implications from population aging
The European Unemployment Puzzle: implications from population aging
 
Economics and Economic reasoning Chap. 1
Economics and Economic reasoning Chap. 1Economics and Economic reasoning Chap. 1
Economics and Economic reasoning Chap. 1
 
how to sell pi coins effectively (from 50 - 100k pi)
how to sell pi coins effectively (from 50 - 100k  pi)how to sell pi coins effectively (from 50 - 100k  pi)
how to sell pi coins effectively (from 50 - 100k pi)
 
when will pi network coin be available on crypto exchange.
when will pi network coin be available on crypto exchange.when will pi network coin be available on crypto exchange.
when will pi network coin be available on crypto exchange.
 
What website can I sell pi coins securely.
What website can I sell pi coins securely.What website can I sell pi coins securely.
What website can I sell pi coins securely.
 
一比一原版Birmingham毕业证伯明翰大学|学院毕业证成绩单如何办理
一比一原版Birmingham毕业证伯明翰大学|学院毕业证成绩单如何办理一比一原版Birmingham毕业证伯明翰大学|学院毕业证成绩单如何办理
一比一原版Birmingham毕业证伯明翰大学|学院毕业证成绩单如何办理
 
Latino Buying Power - May 2024 Presentation for Latino Caucus
Latino Buying Power - May 2024 Presentation for Latino CaucusLatino Buying Power - May 2024 Presentation for Latino Caucus
Latino Buying Power - May 2024 Presentation for Latino Caucus
 
Falcon Invoice Discounting: Optimizing Returns with Minimal Risk
Falcon Invoice Discounting: Optimizing Returns with Minimal RiskFalcon Invoice Discounting: Optimizing Returns with Minimal Risk
Falcon Invoice Discounting: Optimizing Returns with Minimal Risk
 
how to sell pi coins on Binance exchange
how to sell pi coins on Binance exchangehow to sell pi coins on Binance exchange
how to sell pi coins on Binance exchange
 
一比一原版BCU毕业证伯明翰城市大学毕业证成绩单如何办理
一比一原版BCU毕业证伯明翰城市大学毕业证成绩单如何办理一比一原版BCU毕业证伯明翰城市大学毕业证成绩单如何办理
一比一原版BCU毕业证伯明翰城市大学毕业证成绩单如何办理
 
PF-Wagner's Theory of Public Expenditure.pptx
PF-Wagner's Theory of Public Expenditure.pptxPF-Wagner's Theory of Public Expenditure.pptx
PF-Wagner's Theory of Public Expenditure.pptx
 
what is a pi whale and how to access one.
what is a pi whale and how to access one.what is a pi whale and how to access one.
what is a pi whale and how to access one.
 
Scope Of Macroeconomics introduction and basic theories
Scope Of Macroeconomics introduction and basic theoriesScope Of Macroeconomics introduction and basic theories
Scope Of Macroeconomics introduction and basic theories
 
how to sell pi coins in all Africa Countries.
how to sell pi coins in all Africa Countries.how to sell pi coins in all Africa Countries.
how to sell pi coins in all Africa Countries.
 
NO1 Uk Black Magic Specialist Expert In Sahiwal, Okara, Hafizabad, Mandi Bah...
NO1 Uk Black Magic Specialist Expert In Sahiwal, Okara, Hafizabad,  Mandi Bah...NO1 Uk Black Magic Specialist Expert In Sahiwal, Okara, Hafizabad,  Mandi Bah...
NO1 Uk Black Magic Specialist Expert In Sahiwal, Okara, Hafizabad, Mandi Bah...
 
655264371-checkpoint-science-past-papers-april-2023.pdf
655264371-checkpoint-science-past-papers-april-2023.pdf655264371-checkpoint-science-past-papers-april-2023.pdf
655264371-checkpoint-science-past-papers-april-2023.pdf
 
Summary of financial results for 1Q2024
Summary of financial  results for 1Q2024Summary of financial  results for 1Q2024
Summary of financial results for 1Q2024
 
Monthly Economic Monitoring of Ukraine No. 232, May 2024
Monthly Economic Monitoring of Ukraine No. 232, May 2024Monthly Economic Monitoring of Ukraine No. 232, May 2024
Monthly Economic Monitoring of Ukraine No. 232, May 2024
 
NO1 Uk Divorce problem uk all amil baba in karachi,lahore,pakistan talaq ka m...
NO1 Uk Divorce problem uk all amil baba in karachi,lahore,pakistan talaq ka m...NO1 Uk Divorce problem uk all amil baba in karachi,lahore,pakistan talaq ka m...
NO1 Uk Divorce problem uk all amil baba in karachi,lahore,pakistan talaq ka m...
 

RyderPresReleasTablesQ32005

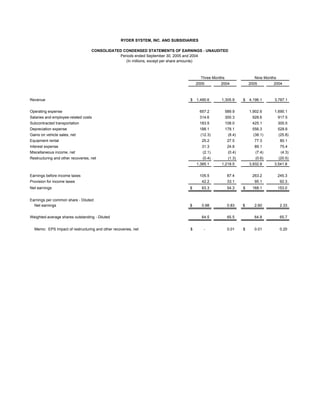
  • 1. RYDER SYSTEM, INC. AND SUBSIDIARIES CONSOLIDATED CONDENSED STATEMENTS OF EARNINGS - UNAUDITED Periods ended September 30, 2005 and 2004 (In millions, except per share amounts) Three Months Nine Months 2005 2004 2005 2004 Revenue $ 1,490.6 1,305.9 $ 4,196.1 3,787.1 Operating expense 657.2 589.9 1,902.6 1,690.1 Salaries and employee-related costs 314.6 300.3 928.6 917.5 Subcontracted transportation 183.5 108.0 425.1 300.5 Depreciation expense 188.1 178.1 556.3 528.8 Gains on vehicle sales, net (12.3) (8.4) (38.1) (25.8) Equipment rental 25.2 27.5 77.3 80.1 Interest expense 31.3 24.8 89.1 75.4 Miscellaneous income, net (2.1) (0.4) (7.4) (4.3) Restructuring and other recoveries, net (0.4) (1.3) (0.6) (20.5) 1,385.1 1,218.5 3,932.9 3,541.8 Earnings before income taxes 105.5 87.4 263.2 245.3 Provision for income taxes 42.2 33.1 95.1 92.3 Net earnings $ 63.3 54.3 $ 168.1 153.0 Earnings per common share - Diluted: Net earnings $ 0.98 0.83 $ 2.60 2.33 Weighted-average shares outstanding - Diluted 64.5 65.5 64.8 65.7 Memo: EPS Impact of restructuring and other recoveries, net $ - 0.01 $ 0.01 0.20
  • 2. RYDER SYSTEM, INC. AND SUBSIDIARIES CONSOLIDATED CONDENSED BALANCE SHEETS (Dollars in millions) (unaudited) September 30, December 31, 2005 2004 Assets: Cash and cash equivalents $ 140.5 101.0 Other current assets 1,201.6 1,126.7 Revenue earning equipment, net 3,633.3 3,331.7 Operating property and equipment, net 485.5 479.6 Other assets 583.1 598.9 $ 6,044.0 5,637.9 Liabilities and shareholders' equity: Current liabilities (including current portion of long-term debt) $ 1,278.3 1,454.8 Long-term debt 1,888.6 1,393.7 Other non-current liabilities (including deferred income taxes) 1,260.2 1,279.2 Shareholders' equity 1,616.9 1,510.2 $ 6,044.0 5,637.9 SELECTED KEY RATIOS September 30, December 31, 2005 2004 Debt to equity 137% 118% Total obligations to equity (a) * 146% 129% Twelve months ended September 30, 2005 2004 Return on average shareholders' equity 15.1% 14.1% Return on average assets 4.0% 3.6% Average asset turnover 96.6% 92.9% Return on capital* 7.8% 7.5% (a) Total obligations represent debt plus off-balance sheet equipment obligations. * Non-GAAP financial measure; see reconciliation to closest GAAP financial measure included within this release.
  • 3. RYDER SYSTEM, INC. AND SUBSIDIARIES BUSINESS SEGMENT REVENUE AND EARNINGS - UNAUDITED Periods ended September 30, 2005 and 2004 (Dollars in millions) Three Months Nine Months 2005 2004 B(W) 2005 2004 B(W) Revenue: Fleet Management Solutions: Full service lease $ 447.4 $ 444.0 0.8% $ 1,334.6 $ 1,319.1 1.2% Contract maintenance 34.0 34.5 (1.5%) 101.9 102.6 (0.7%) Contract-related maintenance 48.3 43.1 12.2% 146.2 131.5 11.2% Commercial rental 183.4 176.7 3.8% 511.0 475.0 7.6% Other 15.5 15.3 0.9% 47.6 53.1 (10.3%) Fuel 282.2 205.1 37.6% 763.7 571.0 33.8% Total Fleet Management Solutions 1,010.8 918.7 10.0% 2,905.0 2,652.3 9.5% Supply Chain Solutions 433.4 338.5 28.0% 1,155.1 986.6 17.1% Dedicated Contract Carriage 139.0 125.9 10.4% 400.8 377.7 6.1% Eliminations (92.6) (77.2) (20.0%) (264.8) (229.5) (15.4%) Total revenue $ 1,490.6 1,305.9 14.1% $ 4,196.1 3,787.1 10.8% Business segment earnings: Earnings before income taxes: Fleet Management Solutions $ 102.6 85.8 19.6% $ 262.4 223.2 17.6% Supply Chain Solutions 10.6 9.8 8.7% 25.4 25.7 (0.9%) Dedicated Contract Carriage 9.2 7.5 22.4% 24.8 22.6 9.5% Eliminations (8.2) (8.0) (3.8%) (23.3) (23.4) 0.5% 114.2 95.1 20.1% 289.3 248.1 16.6% Unallocated Central Support Services (9.1) (9.0) (1.6%) (26.7) (23.3) (14.7%) Earnings before restructuring and other recoveries, net and income taxes 105.1 86.1 22.0% 262.6 224.8 16.8% Restructuring and other recoveries, net 0.4 1.3 (65.7%) 0.6 20.5 (96.9%) Earnings before income taxes 105.5 87.4 20.7% 263.2 245.3 7.3% Provision for income taxes 42.2 33.1 (27.3%) 95.1 92.3 (3.0%) Net earnings $ 63.3 54.3 16.7% $ 168.1 153.0 9.9% Note: Certain prior period amounts have been reclassified to conform to current year presentation. Amounts may not recalculate due to rounding.
  • 4. RYDER SYSTEM, INC. AND SUBSIDIARIES BUSINESS SEGMENT INFORMATION - UNAUDITED Periods ended September 30, 2005 and 2004 (Dollars in millions) Three Months Nine Months 2005 2004 B(W) 2005 2004 B(W) Fleet Management Solutions Total revenue $ 1,010.8 918.7 10.0% $ 2,905.0 2,652.3 9.5% Fuel revenue (282.2) (205.1) 37.6% (763.7) (571.0) 33.8% Operating revenue * $ 728.6 713.6 2.1% $ 2,141.3 2,081.3 2.9% Segment net before tax earnings $ 102.6 85.8 19.6% $ 262.4 223.2 17.6% Earnings before income taxes as % of total revenue 10.1% 9.3% 9.0% 8.4% Earnings before income taxes as % of operating revenue * 14.1% 12.0% 12.3% 10.7% Supply Chain Solutions Total revenue $ 433.4 338.5 28.0% $ 1,155.1 986.6 17.1% Subcontracted transportation (179.1) (104.9) 70.7% (413.5) (293.8) 40.7% Operating revenue * $ 254.3 233.6 8.9% $ 741.6 692.8 7.0% Segment net before tax earnings $ 10.6 9.8 8.7% $ 25.4 25.7 (0.9%) Earnings before income taxes as % of total revenue 2.4% 2.9% 2.2% 2.6% Earnings before income taxes as % of operating revenue * 4.2% 4.2% 3.4% 3.7% Memo: Fuel costs $ 23.8 15.9 (49.7%) $ 66.5 46.5 (43.0%) Dedicated Contract Carriage Total revenue $ 139.0 125.9 10.4% $ 400.8 377.7 6.1% Subcontracted transportation (4.4) (3.2) 39.8% (11.6) (6.7) 74.1% Operating revenue * $ 134.6 122.7 9.7% $ 389.2 371.0 4.9% Segment net before tax earnings $ 9.2 7.5 22.4% $ 24.8 22.6 9.5% Earnings before income taxes as % of total revenue 6.6% 6.0% 6.2% 6.0% Earnings before income taxes as % of operating revenue * 6.8% 6.1% 6.4% 6.1% Memo: Fuel costs $ 24.9 18.2 (36.8%) $ 67.7 52.3 (29.4%) * Non-GAAP financial measure Note: Certain prior period amounts have been reclassified to conform to current year presentation. Amounts may not recalculate due to rounding.
  • 5. RYDER SYSTEM, INC. AND SUBSIDIARIES NON-GAAP FINANCIAL MEASURE RECONCILIATIONS - UNAUDITED Periods ended September 30, 2005 and 2004 (In millions, except per share amounts) FREE CASH FLOW RECONCILIATION Nine Months 2005 2004 Net cash provided by operating activities $ 469.1 656.5 Net cash used in investing activities (817.5) (494.7) Free cash flow * $ (348.4) 161.8 DEBT TO EQUITY RECONCILIATION September 30, December 31, 2005 % to Equity % to Equity 2004 On-balance sheet debt $ 2,218.3 137% $ 1,783.2 118% PV of minimum lease payments and guaranteed residual values under operating leases for vehicles (a) 145.4 161.1 Total obligations * $ 2,363.7 146% $ 1,944.3 129% EPS RECONCILIATION Three Months Nine Months 2005 2004 2005 2004 Earnings per share $ 0.98 0.83 $ 2.60 2.33 Less: Tax change - - 0.12 - Gain on sale of headquarters, after tax - 0.01 - 0.23 Earnings per share excluding tax change and headquarters complex sale* $ 0.98 $ 0.82 $ 2.48 $ 2.09 RETURN ON CAPITAL RECONCILIATION Twelve months ended September 30, 2005 2004 Net earnings — as reported [1] $ 230.8 192.4 Restructuring charges (recoveries), net 2.2 (17.0) Income taxes 118.3 114.7 Earnings before net restructuring charges (recoveries) and income taxes 351.3 290.1 Interest expense 113.8 101.1 Implied interest expense from off-balance sheet debt 7.0 9.2 Adjusted earnings before income taxes 472.1 400.4 Adjusted income taxes (182.7) (149.2) Adjusted net earnings* [2] $ 289.4 $ 251.2 Average total debt $ 2,035.3 1,822.6 Average shareholders' equity 1,530.6 1,365.3 Total capital — as reported [3] 3,565.9 3,187.9 Average off-balance sheet debt 160.4 149.3 Adjusted total capital * [4] $ 3,726.3 $ 3,337.2 Return on capital — as reported [1] / [3] 6.5% 6.0% Return on capital * [2] / [4] 7.8% 7.5% (a) Discounted at the incremental borrowing rate at lease inception. * Non-GAAP financial measure Note: Earnings per share amounts are calculated independently for each component and may not be additive due to rounding.