Download to read offline
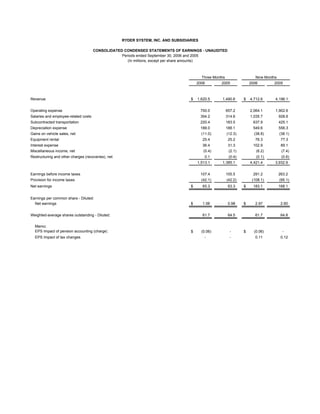

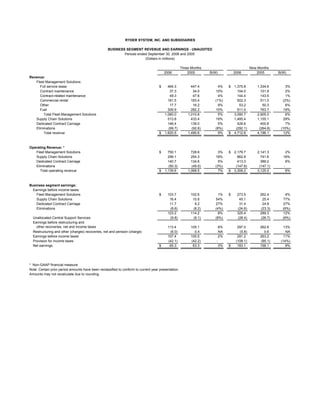
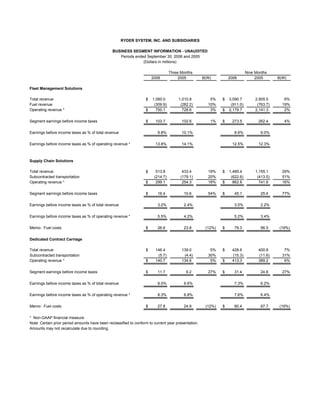
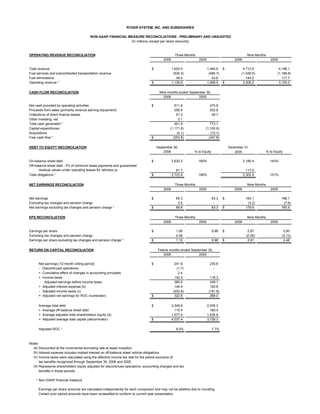
Ryder System, Inc. reported financial results for the third quarter and first nine months of 2006. Total revenue increased 9% to $1.62 billion for the quarter and 12% to $4.71 billion for the nine month period. Net earnings increased slightly to $65.3 million for the quarter and $183.1 million for the nine months. Fleet Management Solutions remained the largest business segment and saw revenue increases of 5% and 6% for the respective periods. Supply Chain Solutions saw significant revenue growth of 19% and 29% for the quarter and nine month period.


