SlideShare a Scribd company logo
1 of 5
Download to read offline
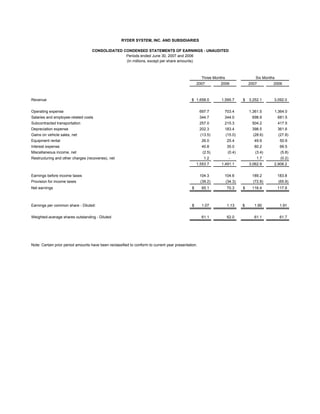
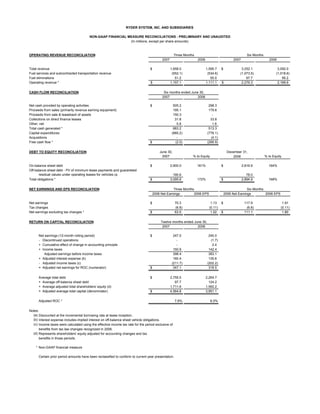
RYDER SYSTEM, INC. AND SUBSIDIARIES

                                   CONSOLIDATED CONDENSED STATEMENTS OF EARNINGS - UNAUDITED
                                                 Periods ended June 30, 2007 and 2006
                                                 (In millions, except per share amounts)


                                                                                                     Three Months                   Six Months
                                                                                                  2007        2006               2007        2006


Revenue                                                                                       $ 1,658.0        1,595.7       $   3,252.1     3,092.0


Operating expense                                                                                    697.7      703.4            1,361.5     1,364.0
Salaries and employee-related costs                                                                  344.7      344.0             698.9          681.5
Subcontracted transportation                                                                         257.0      215.3             504.2          417.5
Depreciation expense                                                                                 202.3      183.4             398.5          361.6
Gains on vehicle sales, net                                                                          (13.5)         (15.0)         (28.6)        (27.8)
Equipment rental                                                                                      26.0          25.4           49.9           50.9
Interest expense                                                                                      40.8          35.0           80.2           66.5
Miscellaneous income, net                                                                             (2.5)          (0.4)          (3.4)         (5.8)
Restructuring and other charges (recoveries), net                                                      1.2           -               1.7          (0.2)
                                                                                                  1,553.7      1,491.1           3,062.9     2,908.2


Earnings before income taxes                                                                         104.3      104.6             189.2          183.8
Provision for income taxes                                                                           (39.2)         (34.3)         (72.8)        (65.9)
Net earnings                                                                                  $       65.1          70.3     $    116.4          117.9


Earnings per common share - Diluted:                                                          $       1.07          1.13     $     1.90           1.91


Weighted-average shares outstanding - Diluted                                                         61.1          62.0           61.1           61.7


Note: Certain prior period amounts have been reclassified to conform to current year presentation.
RYDER SYSTEM, INC. AND SUBSIDIARIES

                                     CONSOLIDATED CONDENSED BALANCE SHEETS
                                    PRELIMINARY AND SUBJECT TO RECLASSIFICATION
                                                  (Dollars in millions)


                                                                                         (unaudited)
                                                                                          June 30,        December 31,
                                                                                            2007             2006

Assets:

  Cash and cash equivalents                                                          $          110.0               128.6
  Other current assets                                                                        1,140.0             1,133.2
  Revenue earning equipment, net                                                              4,601.9             4,509.3
  Operating property and equipment, net                                                         515.1               499.0
  Other assets                                                                                  563.0               558.8
                                                                                     $        6,930.0             6,828.9

Liabilities and shareholders' equity:

  Short-term debt / current portion of long-term debt                                $          151.6               332.7
  Other current liabilities                                                                     854.2               934.9
  Long-term debt                                                                              2,748.4             2,484.2
  Other non-current liabilities (including deferred income taxes)                             1,376.7             1,356.3
  Shareholders' equity                                                                        1,799.1             1,720.8
                                                                                     $        6,930.0             6,828.9


                                                SELECTED KEY RATIOS

                                                                                          June 30,        December 31,
                                                                                           2007              2006

Debt to equity                                                                             161%               164%
Total obligations to equity (a) *                                                          172%               168%

                                                                                          Twelve months ended June 30,
                                                                                           2007               2006

Return on average shareholders' equity (b)                                                 14.4%              15.3%
Return on average assets (b)                                                               3.6%               3.9%
Return on capital*                                                                         7.6%               8.0%


(a) Total obligations represent debt plus off-balance sheet equipment obligations.
(b) Includes the effect of accounting changes.

* Non-GAAP financial measure; see reconciliation to closest GAAP financial measure included within this
release.
RYDER SYSTEM, INC. AND SUBSIDIARIES

                                              BUSINESS SEGMENT REVENUE AND EARNINGS - UNAUDITED
                                                        Periods ended June 30, 2007 and 2006
                                                                  (Dollars in millions)


                                                                                    Three Months                            Six Months
                                                                         2007            2006       B(W)         2007           2006       B(W)
Revenue:
   Fleet Management Solutions:
      Full service lease                                             $     489.2           460.1        6%   $     965.2          911.5        6%
      Contract maintenance                                                  40.0            34.0       18%          77.2           66.8       16%
        Contractual revenue                                                529.2           494.1        7%       1,042.4          978.3        7%
      Contract-related maintenance                                          50.1            47.8        5%         102.2           95.1        7%
      Commercial rental                                                    145.3           170.8     (15%)         276.3          320.8     (14%)
      Other                                                                 17.6            17.4        1%          35.2           35.4      (1%)
      Fuel                                                                 295.1           319.4      (8%)         569.3          601.0      (5%)
        Total Fleet Management Solutions                                 1,037.3         1,049.5      (1%)       2,025.4        2,030.6        0%
   Supply Chain Solutions                                                  584.0           502.1       16%       1,150.4          971.6       18%
   Dedicated Contract Carriage                                             141.1           143.5      (2%)         279.6          282.2      (1%)
   Eliminations                                                           (104.4)          (99.4)     (5%)        (203.3)        (192.4)     (6%)
        Total revenue                                                $   1,658.0         1,595.7        4%   $   3,252.1        3,092.0        5%


Operating Revenue: *
   Fleet Management Solutions                                        $     742.2           730.1        2%   $   1,456.1        1,429.6        2%
   Supply Chain Solutions                                                  330.0           291.3      13%          652.1          563.6      16%
   Dedicated Contract Carriage                                             138.1           139.1      (1%)         273.7          272.6        0%
   Eliminations                                                            (53.2)          (49.4)     (8%)        (105.6)         (97.2)     (9%)
      Total operating revenue                                        $   1,157.1         1,111.1        4%   $   2,276.3        2,168.6        5%


Business segment earnings:
 Earnings before income taxes:
    Fleet Management Solutions                                       $     97.5            94.9         3%   $    178.3          169.8         5%
    Supply Chain Solutions                                                 15.5            18.1      (14%)         26.9           28.7       (6%)
    Dedicated Contract Carriage                                            12.5            11.2        12%         22.9           19.6        16%
    Eliminations                                                           (8.0)           (8.3)        4%        (16.9)         (16.0)      (5%)
                                                                          117.5           115.9         1%        211.2          202.1         5%
  Unallocated Central Support Services                                    (12.0)          (11.3)      (6%)        (20.3)         (18.5)     (10%)
  Earnings before restructuring and
    other (charges) recoveries, net and income taxes                      105.5           104.6         1%        190.9          183.6         4%
  Restructuring and other (charges) recoveries, net                        (1.2)            -          NA          (1.7)           0.2        NA
  Earnings before income taxes                                            104.3           104.6         0%        189.2          183.8         3%
  Provision for income taxes                                              (39.2)          (34.3)     (14%)        (72.8)         (65.9)     (10%)
  Net earnings                                                       $     65.1            70.3       (7%)   $    116.4          117.9       (1%)


* Non-GAAP financial measure
Note: Amounts may not recalculate due to rounding.
RYDER SYSTEM, INC. AND SUBSIDIARIES

                                              BUSINESS SEGMENT INFORMATION - UNAUDITED
                                                    Periods ended June 30, 2007 and 2006
                                                             (Dollars in Millions)


                                                                               Three Months                           Six Months
                                                                    2007           2006       B(W)         2007           2006       B(W)

Fleet Management Solutions

Total revenue                                                   $   1,037.3        1,049.5      (1%)   $   2,025.4        2,030.6       0%
Fuel revenue                                                         (295.1)        (319.4)     (8%)        (569.3)        (601.0)    (5%)
Operating revenue *                                             $     742.2          730.1        2%   $   1,456.1        1,429.6       2%

Segment earnings before income taxes                            $      97.5           94.9       3%    $    178.3           169.8       5%

Earnings before income taxes as % of total revenue                     9.4%           9.0%                   8.8%            8.4%

Earnings before income taxes as % of operating revenue *             13.1%           13.0%                  12.2%           11.9%


Supply Chain Solutions

Total revenue                                                   $     584.0          502.1      16%    $   1,150.4          971.6      18%
Subcontracted transportation                                         (254.0)        (210.8)     20%         (498.3)        (408.0)     22%
Operating revenue *                                             $     330.0          291.3      13%    $     652.1          563.6      16%

Segment earnings before income taxes                            $     15.5            18.1     (14%)   $      26.9           28.7     (6%)

Earnings before income taxes as % of total revenue                    2.6%            3.6%                   2.3%            3.0%

Earnings before income taxes as % of operating revenue *              4.7%            6.2%                   4.1%            5.1%

Memo: Fuel costs                                                $      31.3           27.8     (13%)   $      59.2           52.7    (12%)

Dedicated Contract Carriage

Total revenue                                                   $    141.1           143.5      (2%)   $    279.6           282.2     (1%)
Subcontracted transportation                                          (3.0)           (4.4)    (33%)         (5.9)           (9.6)   (38%)
Operating revenue *                                             $    138.1           139.1      (1%)   $    273.7           272.6       0%

Segment earnings before income taxes                            $     12.5            11.2      12%    $      22.9           19.6      16%

Earnings before income taxes as % of total revenue                    8.9%            7.8%                   8.2%            7.0%

Earnings before income taxes as % of operating revenue *              9.1%            8.0%                   8.4%            7.2%

Memo: Fuel costs                                                $      26.5           27.5       4%    $      51.2           52.5       3%

* Non-GAAP financial measure

Note: Amounts may not recalculate due to rounding.
RYDER SYSTEM, INC. AND SUBSIDIARIES

                                         NON-GAAP FINANCIAL MEASURE RECONCILIATIONS - PRELIMINARY AND UNAUDITED
                                                             (In millions, except per share amounts)


OPERATING REVENUE RECONCILIATION                                                                     Three Months                                        Six Months
                                                                                           2007                     2006                       2007                      2006

Total revenue                                                                     $               1,658.0                  1,595.7    $              3,252.1                  3,092.0
Fuel services and subcontracted transportation revenue                                             (552.1)                  (534.6)                 (1,073.5)                (1,018.6)
Fuel eliminations                                                                                    51.2                     50.0                      97.7                     95.2
Operating revenue *                                                               $               1,157.1                  1,111.1    $              2,276.3                  2,168.6

CASH FLOW RECONCILIATION                                                                    Six months ended June 30,
                                                                                           2007                  2006

Net cash provided by operating activities                                         $                 505.2                    298.3
Proceeds from sales (primarily revenue earning equipment)                                           195.1                    179.6
Proceeds from sale & leaseback of assets                                                            150.3                      -
Collections on direct finance leases                                                                 31.8                     33.8
Other, net                                                                                            0.8                      1.6
Total cash generated *                                                                              883.2                    513.3
Capital expenditures                                                                               (885.2)                  (776.1)
Acquisitions                                                                                          -                       (4.1)
Free cash flow *                                                                  $                  (2.0)                  (266.9)

DEBT TO EQUITY RECONCILIATION                                                             June 30,                                         December 31,
                                                                                           2007                 % to Equity                                           % to Equity
                                                                                                                                              2006

On-balance sheet debt                                                             $               2,900.0           161%              $               2,816.9           164%
Off-balance sheet debt - PV of minimum lease payments and guaranteed
       residual values under operating leases for vehicles (a)                                      195.6                                                78.0
Total obligations *                                                               $               3,095.6           172%              $               2,894.9           168%

NET EARNINGS AND EPS RECONCILIATION                                                                Three Months                                          Six Months
                                                                                      2006 Net Earnings        2006 EPS                   2006 Net Earnings         2006 EPS

Net earnings                                                                      $                  70.3                     1.13    $                117.9                     1.91
Tax changes                                                                                          (6.8)                   (0.11)                     (6.8)                   (0.11)
Net earnings excluding tax changes *                                              $                  63.5                     1.02    $                111.1                     1.80

RETURN ON CAPITAL RECONCILIATION                                                          Twelve months ended June 30,
                                                                                           2007                 2006

      Net earnings (12-month rolling period)                                      $                 247.5                    240.0
      - Discontinued operations                                                                       -                       (1.7)
      + Cumulative effect of change in accounting principle                                           -                        2.4
      + Income taxes                                                                                150.9                    142.4
         Adjusted earnings before income taxes                                                      398.4                    383.1
      + Adjusted interest expense (b)                                                               160.4                    135.6
      - Adjusted income taxes (c)                                                                  (211.7)                  (202.2)
      = Adjusted net earnings for ROC (numerator)                                 $                 347.1                    316.5

      Average total debt                                                          $               2,755.5                  2,264.7
      + Average off-balance sheet debt                                                               97.7                    124.2
      + Average adjusted total shareholders' equity (d)                                           1,711.6                  1,562.2
      = Adjusted average total capital (denominator)                              $               4,564.8                  3,951.1

      Adjusted ROC *                                                                                 7.6%                     8.0%

Notes:
  (a) Discounted at the incremental borrowing rate at lease inception.
  (b) Interest expense includes implied interest on off-balance sheet vehicle obligations.
  (c) Income taxes were calculated using the effective income tax rate for the period exclusive of
      benefits from tax law changes recognized in 2006.
  (d) Represents shareholders' equity adjusted for accounting changes and tax
      benefits in those periods.

    * Non-GAAP financial measure

      Certain prior period amounts have been reclassified to conform to current year presentation.

More Related Content

Similar to RYDERFINAL Q207tables

RYDERFINAL2Q06_PRTables
RYDERFINAL2Q06_PRTablesRYDERFINAL2Q06_PRTables
RYDERFINAL2Q06_PRTables
finance44
 
updated3Q07PRTABLES%20v2
updated3Q07PRTABLES%20v2updated3Q07PRTABLES%20v2
updated3Q07PRTABLES%20v2
finance44
 
updated3Q07PRTABLES%20v2
updated3Q07PRTABLES%20v2updated3Q07PRTABLES%20v2
updated3Q07PRTABLES%20v2
finance44
 
updated3Q07PRTABLES%20v2
updated3Q07PRTABLES%20v2updated3Q07PRTABLES%20v2
updated3Q07PRTABLES%20v2
finance44
 
updated3Q07PRTABLES%20v2
updated3Q07PRTABLES%20v2updated3Q07PRTABLES%20v2
updated3Q07PRTABLES%20v2
finance44
 
updated3Q07PRTABLES%20v2
updated3Q07PRTABLES%20v2updated3Q07PRTABLES%20v2
updated3Q07PRTABLES%20v2
finance44
 
updated3Q07PRTABLES%20v2
updated3Q07PRTABLES%20v2updated3Q07PRTABLES%20v2
updated3Q07PRTABLES%20v2
finance44
 
RYDERFINAL3QTables
 RYDERFINAL3QTables RYDERFINAL3QTables
RYDERFINAL3QTables
finance44
 
RYDERFINAL Q406tables
RYDERFINAL Q406tablesRYDERFINAL Q406tables
RYDERFINAL Q406tables
finance44
 
RYDERFINAL 2Q05TablesFinal
RYDERFINAL 2Q05TablesFinalRYDERFINAL 2Q05TablesFinal
RYDERFINAL 2Q05TablesFinal
finance44
 
Ryder2QFinInfo
Ryder2QFinInfoRyder2QFinInfo
Ryder2QFinInfo
finance44
 
Ryder2QFinInfo
Ryder2QFinInfoRyder2QFinInfo
Ryder2QFinInfo
finance44
 
RYDERFINAL_PR_TABLES_Q308
RYDERFINAL_PR_TABLES_Q308RYDERFINAL_PR_TABLES_Q308
RYDERFINAL_PR_TABLES_Q308
finance44
 
RYDERFINAL_PR_TABLES_Q308
RYDERFINAL_PR_TABLES_Q308RYDERFINAL_PR_TABLES_Q308
RYDERFINAL_PR_TABLES_Q308
finance44
 
RYDERFINAL_PR_TABLES_Q308
RYDERFINAL_PR_TABLES_Q308RYDERFINAL_PR_TABLES_Q308
RYDERFINAL_PR_TABLES_Q308
finance44
 
RYDERFINAL Q107_tables
RYDERFINAL Q107_tablesRYDERFINAL Q107_tables
RYDERFINAL Q107_tables
finance44
 
Q407ryderfinancialinformation
Q407ryderfinancialinformationQ407ryderfinancialinformation
Q407ryderfinancialinformation
finance44
 
RYDERFINAL Q407ryderfinancialinformation
RYDERFINAL Q407ryderfinancialinformationRYDERFINAL Q407ryderfinancialinformation
RYDERFINAL Q407ryderfinancialinformation
finance44
 
RYDERFINAL Q407ryderfinancialinformation
RYDERFINAL Q407ryderfinancialinformationRYDERFINAL Q407ryderfinancialinformation
RYDERFINAL Q407ryderfinancialinformation
finance44
 
RYDERFINAL Q405tables
RYDERFINAL Q405tablesRYDERFINAL Q405tables
RYDERFINAL Q405tables
finance44
 

Similar to RYDERFINAL Q207tables (20)

RYDERFINAL2Q06_PRTables
RYDERFINAL2Q06_PRTablesRYDERFINAL2Q06_PRTables
RYDERFINAL2Q06_PRTables
 
updated3Q07PRTABLES%20v2
updated3Q07PRTABLES%20v2updated3Q07PRTABLES%20v2
updated3Q07PRTABLES%20v2
 
updated3Q07PRTABLES%20v2
updated3Q07PRTABLES%20v2updated3Q07PRTABLES%20v2
updated3Q07PRTABLES%20v2
 
updated3Q07PRTABLES%20v2
updated3Q07PRTABLES%20v2updated3Q07PRTABLES%20v2
updated3Q07PRTABLES%20v2
 
updated3Q07PRTABLES%20v2
updated3Q07PRTABLES%20v2updated3Q07PRTABLES%20v2
updated3Q07PRTABLES%20v2
 
updated3Q07PRTABLES%20v2
updated3Q07PRTABLES%20v2updated3Q07PRTABLES%20v2
updated3Q07PRTABLES%20v2
 
updated3Q07PRTABLES%20v2
updated3Q07PRTABLES%20v2updated3Q07PRTABLES%20v2
updated3Q07PRTABLES%20v2
 
RYDERFINAL3QTables
 RYDERFINAL3QTables RYDERFINAL3QTables
RYDERFINAL3QTables
 
RYDERFINAL Q406tables
RYDERFINAL Q406tablesRYDERFINAL Q406tables
RYDERFINAL Q406tables
 
RYDERFINAL 2Q05TablesFinal
RYDERFINAL 2Q05TablesFinalRYDERFINAL 2Q05TablesFinal
RYDERFINAL 2Q05TablesFinal
 
Ryder2QFinInfo
Ryder2QFinInfoRyder2QFinInfo
Ryder2QFinInfo
 
Ryder2QFinInfo
Ryder2QFinInfoRyder2QFinInfo
Ryder2QFinInfo
 
RYDERFINAL_PR_TABLES_Q308
RYDERFINAL_PR_TABLES_Q308RYDERFINAL_PR_TABLES_Q308
RYDERFINAL_PR_TABLES_Q308
 
RYDERFINAL_PR_TABLES_Q308
RYDERFINAL_PR_TABLES_Q308RYDERFINAL_PR_TABLES_Q308
RYDERFINAL_PR_TABLES_Q308
 
RYDERFINAL_PR_TABLES_Q308
RYDERFINAL_PR_TABLES_Q308RYDERFINAL_PR_TABLES_Q308
RYDERFINAL_PR_TABLES_Q308
 
RYDERFINAL Q107_tables
RYDERFINAL Q107_tablesRYDERFINAL Q107_tables
RYDERFINAL Q107_tables
 
Q407ryderfinancialinformation
Q407ryderfinancialinformationQ407ryderfinancialinformation
Q407ryderfinancialinformation
 
RYDERFINAL Q407ryderfinancialinformation
RYDERFINAL Q407ryderfinancialinformationRYDERFINAL Q407ryderfinancialinformation
RYDERFINAL Q407ryderfinancialinformation
 
RYDERFINAL Q407ryderfinancialinformation
RYDERFINAL Q407ryderfinancialinformationRYDERFINAL Q407ryderfinancialinformation
RYDERFINAL Q407ryderfinancialinformation
 
RYDERFINAL Q405tables
RYDERFINAL Q405tablesRYDERFINAL Q405tables
RYDERFINAL Q405tables
 

More from finance44

oshkosh Q106_Presentation
oshkosh   Q106_Presentationoshkosh   Q106_Presentation
oshkosh Q106_Presentation
finance44
 
oshkosh Q206_Earnings_Presentation
oshkosh   Q206_Earnings_Presentationoshkosh   Q206_Earnings_Presentation
oshkosh Q206_Earnings_Presentation
finance44
 
oshkosh Q306_Presentation
oshkosh   Q306_Presentationoshkosh   Q306_Presentation
oshkosh Q306_Presentation
finance44
 
oshkosh Q107_Slides
oshkosh   Q107_Slidesoshkosh   Q107_Slides
oshkosh Q107_Slides
finance44
 
oshkosh Q207_Slides
oshkosh   Q207_Slidesoshkosh   Q207_Slides
oshkosh Q207_Slides
finance44
 
oshkosh Q32007slides
oshkosh   Q32007slidesoshkosh   Q32007slides
oshkosh Q32007slides
finance44
 
oshkosh Q407_Earnings
oshkosh   Q407_Earningsoshkosh   Q407_Earnings
oshkosh Q407_Earnings
finance44
 
oshkosh Q108_earnings_slides
oshkosh   Q108_earnings_slidesoshkosh   Q108_earnings_slides
oshkosh Q108_earnings_slides
finance44
 
oshkosh Q208_Slides
oshkosh   Q208_Slidesoshkosh   Q208_Slides
oshkosh Q208_Slides
finance44
 
oshkosh Q308_Slides
oshkosh   Q308_Slidesoshkosh   Q308_Slides
oshkosh Q308_Slides
finance44
 
OSK_Q4_2008_Earnings_Release_Slides
OSK_Q4_2008_Earnings_Release_SlidesOSK_Q4_2008_Earnings_Release_Slides
OSK_Q4_2008_Earnings_Release_Slides
finance44
 
oshkosh Goldman_110508
oshkosh   Goldman_110508oshkosh   Goldman_110508
oshkosh Goldman_110508
finance44
 
oshkosh Baird_111208
oshkosh   Baird_111208oshkosh   Baird_111208
oshkosh Baird_111208
finance44
 
oshkosh B9FAB733-F810-4AE7-A95B-4388C6B08318_Cowen_020509
oshkosh   B9FAB733-F810-4AE7-A95B-4388C6B08318_Cowen_020509oshkosh   B9FAB733-F810-4AE7-A95B-4388C6B08318_Cowen_020509
oshkosh B9FAB733-F810-4AE7-A95B-4388C6B08318_Cowen_020509
finance44
 
oshkosh Q108_earnings_slides
oshkosh   Q108_earnings_slidesoshkosh   Q108_earnings_slides
oshkosh Q108_earnings_slides
finance44
 
oshkosh Q208_Slides
oshkosh   Q208_Slidesoshkosh   Q208_Slides
oshkosh Q208_Slides
finance44
 
oshkosh Q308_Slides
oshkosh   Q308_Slidesoshkosh   Q308_Slides
oshkosh Q308_Slides
finance44
 
oshkosh OSK_Q4_2008_Earnings_Release_Slides
oshkosh   OSK_Q4_2008_Earnings_Release_Slidesoshkosh   OSK_Q4_2008_Earnings_Release_Slides
oshkosh OSK_Q4_2008_Earnings_Release_Slides
finance44
 

More from finance44 (20)

oshkosh Q106_Presentation
oshkosh   Q106_Presentationoshkosh   Q106_Presentation
oshkosh Q106_Presentation
 
oshkosh Q206_Earnings_Presentation
oshkosh   Q206_Earnings_Presentationoshkosh   Q206_Earnings_Presentation
oshkosh Q206_Earnings_Presentation
 
oshkosh Q306_Presentation
oshkosh   Q306_Presentationoshkosh   Q306_Presentation
oshkosh Q306_Presentation
 
OSK_101606
OSK_101606OSK_101606
OSK_101606
 
Oshkosh
OshkoshOshkosh
Oshkosh
 
oshkosh Q107_Slides
oshkosh   Q107_Slidesoshkosh   Q107_Slides
oshkosh Q107_Slides
 
oshkosh Q207_Slides
oshkosh   Q207_Slidesoshkosh   Q207_Slides
oshkosh Q207_Slides
 
oshkosh Q32007slides
oshkosh   Q32007slidesoshkosh   Q32007slides
oshkosh Q32007slides
 
oshkosh Q407_Earnings
oshkosh   Q407_Earningsoshkosh   Q407_Earnings
oshkosh Q407_Earnings
 
oshkosh Q108_earnings_slides
oshkosh   Q108_earnings_slidesoshkosh   Q108_earnings_slides
oshkosh Q108_earnings_slides
 
oshkosh Q208_Slides
oshkosh   Q208_Slidesoshkosh   Q208_Slides
oshkosh Q208_Slides
 
oshkosh Q308_Slides
oshkosh   Q308_Slidesoshkosh   Q308_Slides
oshkosh Q308_Slides
 
OSK_Q4_2008_Earnings_Release_Slides
OSK_Q4_2008_Earnings_Release_SlidesOSK_Q4_2008_Earnings_Release_Slides
OSK_Q4_2008_Earnings_Release_Slides
 
oshkosh Goldman_110508
oshkosh   Goldman_110508oshkosh   Goldman_110508
oshkosh Goldman_110508
 
oshkosh Baird_111208
oshkosh   Baird_111208oshkosh   Baird_111208
oshkosh Baird_111208
 
oshkosh B9FAB733-F810-4AE7-A95B-4388C6B08318_Cowen_020509
oshkosh   B9FAB733-F810-4AE7-A95B-4388C6B08318_Cowen_020509oshkosh   B9FAB733-F810-4AE7-A95B-4388C6B08318_Cowen_020509
oshkosh B9FAB733-F810-4AE7-A95B-4388C6B08318_Cowen_020509
 
oshkosh Q108_earnings_slides
oshkosh   Q108_earnings_slidesoshkosh   Q108_earnings_slides
oshkosh Q108_earnings_slides
 
oshkosh Q208_Slides
oshkosh   Q208_Slidesoshkosh   Q208_Slides
oshkosh Q208_Slides
 
oshkosh Q308_Slides
oshkosh   Q308_Slidesoshkosh   Q308_Slides
oshkosh Q308_Slides
 
oshkosh OSK_Q4_2008_Earnings_Release_Slides
oshkosh   OSK_Q4_2008_Earnings_Release_Slidesoshkosh   OSK_Q4_2008_Earnings_Release_Slides
oshkosh OSK_Q4_2008_Earnings_Release_Slides
 

Recently uploaded

Obat Penggugur Kandungan Aman Bagi Ibu Menyusui 087776558899
Obat Penggugur Kandungan Aman Bagi Ibu Menyusui  087776558899Obat Penggugur Kandungan Aman Bagi Ibu Menyusui  087776558899
Obat Penggugur Kandungan Aman Bagi Ibu Menyusui 087776558899
Cara Menggugurkan Kandungan 087776558899
 
Sonagachi % High Profile Call Girls in Kolkata Real photos of Female Escorts ...
Sonagachi % High Profile Call Girls in Kolkata Real photos of Female Escorts ...Sonagachi % High Profile Call Girls in Kolkata Real photos of Female Escorts ...
Sonagachi % High Profile Call Girls in Kolkata Real photos of Female Escorts ...
soniyagrag336
 

Recently uploaded (20)

Call Girl In Siliguri 💯Niamh 📲🔝6378878445🔝Call Girls No💰Advance Cash On Deliv...
Call Girl In Siliguri 💯Niamh 📲🔝6378878445🔝Call Girls No💰Advance Cash On Deliv...Call Girl In Siliguri 💯Niamh 📲🔝6378878445🔝Call Girls No💰Advance Cash On Deliv...
Call Girl In Siliguri 💯Niamh 📲🔝6378878445🔝Call Girls No💰Advance Cash On Deliv...
 
Shrambal_Distributors_Newsletter_May-2024.pdf
Shrambal_Distributors_Newsletter_May-2024.pdfShrambal_Distributors_Newsletter_May-2024.pdf
Shrambal_Distributors_Newsletter_May-2024.pdf
 
Production and Cost of the firm with curves
Production and Cost of the firm with curvesProduction and Cost of the firm with curves
Production and Cost of the firm with curves
 
Black magic specialist in Canada (Kala ilam specialist in UK) Bangali Amil ba...
Black magic specialist in Canada (Kala ilam specialist in UK) Bangali Amil ba...Black magic specialist in Canada (Kala ilam specialist in UK) Bangali Amil ba...
Black magic specialist in Canada (Kala ilam specialist in UK) Bangali Amil ba...
 
No 1 Top Love marriage specialist baba ji amil baba kala ilam powerful vashik...
No 1 Top Love marriage specialist baba ji amil baba kala ilam powerful vashik...No 1 Top Love marriage specialist baba ji amil baba kala ilam powerful vashik...
No 1 Top Love marriage specialist baba ji amil baba kala ilam powerful vashik...
 
amil baba in australia amil baba in canada amil baba in london amil baba in g...
amil baba in australia amil baba in canada amil baba in london amil baba in g...amil baba in australia amil baba in canada amil baba in london amil baba in g...
amil baba in australia amil baba in canada amil baba in london amil baba in g...
 
Black magic specialist in Saudi Arabia (Kala jadu expert in UK) Bangali Amil ...
Black magic specialist in Saudi Arabia (Kala jadu expert in UK) Bangali Amil ...Black magic specialist in Saudi Arabia (Kala jadu expert in UK) Bangali Amil ...
Black magic specialist in Saudi Arabia (Kala jadu expert in UK) Bangali Amil ...
 
Obat Penggugur Kandungan Aman Bagi Ibu Menyusui 087776558899
Obat Penggugur Kandungan Aman Bagi Ibu Menyusui  087776558899Obat Penggugur Kandungan Aman Bagi Ibu Menyusui  087776558899
Obat Penggugur Kandungan Aman Bagi Ibu Menyusui 087776558899
 
Bank of Tomorrow White Paper For Reading
Bank of Tomorrow White Paper For ReadingBank of Tomorrow White Paper For Reading
Bank of Tomorrow White Paper For Reading
 
najoomi asli amil baba kala jadu expert rawalpindi bangladesh uk usa
najoomi asli amil baba kala jadu expert rawalpindi bangladesh uk usanajoomi asli amil baba kala jadu expert rawalpindi bangladesh uk usa
najoomi asli amil baba kala jadu expert rawalpindi bangladesh uk usa
 
cost-volume-profit analysis.ppt(managerial accounting).pptx
cost-volume-profit analysis.ppt(managerial accounting).pptxcost-volume-profit analysis.ppt(managerial accounting).pptx
cost-volume-profit analysis.ppt(managerial accounting).pptx
 
fundamentals of corporate finance 11th canadian edition test bank.docx
fundamentals of corporate finance 11th canadian edition test bank.docxfundamentals of corporate finance 11th canadian edition test bank.docx
fundamentals of corporate finance 11th canadian edition test bank.docx
 
Kala jadu specialist in USA (Kala ilam expert in france) Black magic expert i...
Kala jadu specialist in USA (Kala ilam expert in france) Black magic expert i...Kala jadu specialist in USA (Kala ilam expert in france) Black magic expert i...
Kala jadu specialist in USA (Kala ilam expert in france) Black magic expert i...
 
Sonagachi % High Profile Call Girls in Kolkata Real photos of Female Escorts ...
Sonagachi % High Profile Call Girls in Kolkata Real photos of Female Escorts ...Sonagachi % High Profile Call Girls in Kolkata Real photos of Female Escorts ...
Sonagachi % High Profile Call Girls in Kolkata Real photos of Female Escorts ...
 
Test bank for advanced assessment interpreting findings and formulating diffe...
Test bank for advanced assessment interpreting findings and formulating diffe...Test bank for advanced assessment interpreting findings and formulating diffe...
Test bank for advanced assessment interpreting findings and formulating diffe...
 
Famous Kala Jadu, Kala ilam specialist in USA and Bangali Amil baba in Saudi ...
Famous Kala Jadu, Kala ilam specialist in USA and Bangali Amil baba in Saudi ...Famous Kala Jadu, Kala ilam specialist in USA and Bangali Amil baba in Saudi ...
Famous Kala Jadu, Kala ilam specialist in USA and Bangali Amil baba in Saudi ...
 
asli amil baba bengali black magic kala jadu expert in uk usa canada france c...
asli amil baba bengali black magic kala jadu expert in uk usa canada france c...asli amil baba bengali black magic kala jadu expert in uk usa canada france c...
asli amil baba bengali black magic kala jadu expert in uk usa canada france c...
 
Lion One Corporate Presentation May 2024
Lion One Corporate Presentation May 2024Lion One Corporate Presentation May 2024
Lion One Corporate Presentation May 2024
 
najoomi asli amil baba kala jadu expert rawalpindi bangladesh uk usa
najoomi asli amil baba kala jadu expert rawalpindi bangladesh uk usanajoomi asli amil baba kala jadu expert rawalpindi bangladesh uk usa
najoomi asli amil baba kala jadu expert rawalpindi bangladesh uk usa
 
Certified Kala Jadu, Black magic specialist in Rawalpindi and Bangali Amil ba...
Certified Kala Jadu, Black magic specialist in Rawalpindi and Bangali Amil ba...Certified Kala Jadu, Black magic specialist in Rawalpindi and Bangali Amil ba...
Certified Kala Jadu, Black magic specialist in Rawalpindi and Bangali Amil ba...
 

RYDERFINAL Q207tables

  • 1. RYDER SYSTEM, INC. AND SUBSIDIARIES CONSOLIDATED CONDENSED STATEMENTS OF EARNINGS - UNAUDITED Periods ended June 30, 2007 and 2006 (In millions, except per share amounts) Three Months Six Months 2007 2006 2007 2006 Revenue $ 1,658.0 1,595.7 $ 3,252.1 3,092.0 Operating expense 697.7 703.4 1,361.5 1,364.0 Salaries and employee-related costs 344.7 344.0 698.9 681.5 Subcontracted transportation 257.0 215.3 504.2 417.5 Depreciation expense 202.3 183.4 398.5 361.6 Gains on vehicle sales, net (13.5) (15.0) (28.6) (27.8) Equipment rental 26.0 25.4 49.9 50.9 Interest expense 40.8 35.0 80.2 66.5 Miscellaneous income, net (2.5) (0.4) (3.4) (5.8) Restructuring and other charges (recoveries), net 1.2 - 1.7 (0.2) 1,553.7 1,491.1 3,062.9 2,908.2 Earnings before income taxes 104.3 104.6 189.2 183.8 Provision for income taxes (39.2) (34.3) (72.8) (65.9) Net earnings $ 65.1 70.3 $ 116.4 117.9 Earnings per common share - Diluted: $ 1.07 1.13 $ 1.90 1.91 Weighted-average shares outstanding - Diluted 61.1 62.0 61.1 61.7 Note: Certain prior period amounts have been reclassified to conform to current year presentation.
  • 2. RYDER SYSTEM, INC. AND SUBSIDIARIES CONSOLIDATED CONDENSED BALANCE SHEETS PRELIMINARY AND SUBJECT TO RECLASSIFICATION (Dollars in millions) (unaudited) June 30, December 31, 2007 2006 Assets: Cash and cash equivalents $ 110.0 128.6 Other current assets 1,140.0 1,133.2 Revenue earning equipment, net 4,601.9 4,509.3 Operating property and equipment, net 515.1 499.0 Other assets 563.0 558.8 $ 6,930.0 6,828.9 Liabilities and shareholders' equity: Short-term debt / current portion of long-term debt $ 151.6 332.7 Other current liabilities 854.2 934.9 Long-term debt 2,748.4 2,484.2 Other non-current liabilities (including deferred income taxes) 1,376.7 1,356.3 Shareholders' equity 1,799.1 1,720.8 $ 6,930.0 6,828.9 SELECTED KEY RATIOS June 30, December 31, 2007 2006 Debt to equity 161% 164% Total obligations to equity (a) * 172% 168% Twelve months ended June 30, 2007 2006 Return on average shareholders' equity (b) 14.4% 15.3% Return on average assets (b) 3.6% 3.9% Return on capital* 7.6% 8.0% (a) Total obligations represent debt plus off-balance sheet equipment obligations. (b) Includes the effect of accounting changes. * Non-GAAP financial measure; see reconciliation to closest GAAP financial measure included within this release.
  • 3. RYDER SYSTEM, INC. AND SUBSIDIARIES BUSINESS SEGMENT REVENUE AND EARNINGS - UNAUDITED Periods ended June 30, 2007 and 2006 (Dollars in millions) Three Months Six Months 2007 2006 B(W) 2007 2006 B(W) Revenue: Fleet Management Solutions: Full service lease $ 489.2 460.1 6% $ 965.2 911.5 6% Contract maintenance 40.0 34.0 18% 77.2 66.8 16% Contractual revenue 529.2 494.1 7% 1,042.4 978.3 7% Contract-related maintenance 50.1 47.8 5% 102.2 95.1 7% Commercial rental 145.3 170.8 (15%) 276.3 320.8 (14%) Other 17.6 17.4 1% 35.2 35.4 (1%) Fuel 295.1 319.4 (8%) 569.3 601.0 (5%) Total Fleet Management Solutions 1,037.3 1,049.5 (1%) 2,025.4 2,030.6 0% Supply Chain Solutions 584.0 502.1 16% 1,150.4 971.6 18% Dedicated Contract Carriage 141.1 143.5 (2%) 279.6 282.2 (1%) Eliminations (104.4) (99.4) (5%) (203.3) (192.4) (6%) Total revenue $ 1,658.0 1,595.7 4% $ 3,252.1 3,092.0 5% Operating Revenue: * Fleet Management Solutions $ 742.2 730.1 2% $ 1,456.1 1,429.6 2% Supply Chain Solutions 330.0 291.3 13% 652.1 563.6 16% Dedicated Contract Carriage 138.1 139.1 (1%) 273.7 272.6 0% Eliminations (53.2) (49.4) (8%) (105.6) (97.2) (9%) Total operating revenue $ 1,157.1 1,111.1 4% $ 2,276.3 2,168.6 5% Business segment earnings: Earnings before income taxes: Fleet Management Solutions $ 97.5 94.9 3% $ 178.3 169.8 5% Supply Chain Solutions 15.5 18.1 (14%) 26.9 28.7 (6%) Dedicated Contract Carriage 12.5 11.2 12% 22.9 19.6 16% Eliminations (8.0) (8.3) 4% (16.9) (16.0) (5%) 117.5 115.9 1% 211.2 202.1 5% Unallocated Central Support Services (12.0) (11.3) (6%) (20.3) (18.5) (10%) Earnings before restructuring and other (charges) recoveries, net and income taxes 105.5 104.6 1% 190.9 183.6 4% Restructuring and other (charges) recoveries, net (1.2) - NA (1.7) 0.2 NA Earnings before income taxes 104.3 104.6 0% 189.2 183.8 3% Provision for income taxes (39.2) (34.3) (14%) (72.8) (65.9) (10%) Net earnings $ 65.1 70.3 (7%) $ 116.4 117.9 (1%) * Non-GAAP financial measure Note: Amounts may not recalculate due to rounding.
  • 4. RYDER SYSTEM, INC. AND SUBSIDIARIES BUSINESS SEGMENT INFORMATION - UNAUDITED Periods ended June 30, 2007 and 2006 (Dollars in Millions) Three Months Six Months 2007 2006 B(W) 2007 2006 B(W) Fleet Management Solutions Total revenue $ 1,037.3 1,049.5 (1%) $ 2,025.4 2,030.6 0% Fuel revenue (295.1) (319.4) (8%) (569.3) (601.0) (5%) Operating revenue * $ 742.2 730.1 2% $ 1,456.1 1,429.6 2% Segment earnings before income taxes $ 97.5 94.9 3% $ 178.3 169.8 5% Earnings before income taxes as % of total revenue 9.4% 9.0% 8.8% 8.4% Earnings before income taxes as % of operating revenue * 13.1% 13.0% 12.2% 11.9% Supply Chain Solutions Total revenue $ 584.0 502.1 16% $ 1,150.4 971.6 18% Subcontracted transportation (254.0) (210.8) 20% (498.3) (408.0) 22% Operating revenue * $ 330.0 291.3 13% $ 652.1 563.6 16% Segment earnings before income taxes $ 15.5 18.1 (14%) $ 26.9 28.7 (6%) Earnings before income taxes as % of total revenue 2.6% 3.6% 2.3% 3.0% Earnings before income taxes as % of operating revenue * 4.7% 6.2% 4.1% 5.1% Memo: Fuel costs $ 31.3 27.8 (13%) $ 59.2 52.7 (12%) Dedicated Contract Carriage Total revenue $ 141.1 143.5 (2%) $ 279.6 282.2 (1%) Subcontracted transportation (3.0) (4.4) (33%) (5.9) (9.6) (38%) Operating revenue * $ 138.1 139.1 (1%) $ 273.7 272.6 0% Segment earnings before income taxes $ 12.5 11.2 12% $ 22.9 19.6 16% Earnings before income taxes as % of total revenue 8.9% 7.8% 8.2% 7.0% Earnings before income taxes as % of operating revenue * 9.1% 8.0% 8.4% 7.2% Memo: Fuel costs $ 26.5 27.5 4% $ 51.2 52.5 3% * Non-GAAP financial measure Note: Amounts may not recalculate due to rounding.
  • 5. RYDER SYSTEM, INC. AND SUBSIDIARIES NON-GAAP FINANCIAL MEASURE RECONCILIATIONS - PRELIMINARY AND UNAUDITED (In millions, except per share amounts) OPERATING REVENUE RECONCILIATION Three Months Six Months 2007 2006 2007 2006 Total revenue $ 1,658.0 1,595.7 $ 3,252.1 3,092.0 Fuel services and subcontracted transportation revenue (552.1) (534.6) (1,073.5) (1,018.6) Fuel eliminations 51.2 50.0 97.7 95.2 Operating revenue * $ 1,157.1 1,111.1 $ 2,276.3 2,168.6 CASH FLOW RECONCILIATION Six months ended June 30, 2007 2006 Net cash provided by operating activities $ 505.2 298.3 Proceeds from sales (primarily revenue earning equipment) 195.1 179.6 Proceeds from sale & leaseback of assets 150.3 - Collections on direct finance leases 31.8 33.8 Other, net 0.8 1.6 Total cash generated * 883.2 513.3 Capital expenditures (885.2) (776.1) Acquisitions - (4.1) Free cash flow * $ (2.0) (266.9) DEBT TO EQUITY RECONCILIATION June 30, December 31, 2007 % to Equity % to Equity 2006 On-balance sheet debt $ 2,900.0 161% $ 2,816.9 164% Off-balance sheet debt - PV of minimum lease payments and guaranteed residual values under operating leases for vehicles (a) 195.6 78.0 Total obligations * $ 3,095.6 172% $ 2,894.9 168% NET EARNINGS AND EPS RECONCILIATION Three Months Six Months 2006 Net Earnings 2006 EPS 2006 Net Earnings 2006 EPS Net earnings $ 70.3 1.13 $ 117.9 1.91 Tax changes (6.8) (0.11) (6.8) (0.11) Net earnings excluding tax changes * $ 63.5 1.02 $ 111.1 1.80 RETURN ON CAPITAL RECONCILIATION Twelve months ended June 30, 2007 2006 Net earnings (12-month rolling period) $ 247.5 240.0 - Discontinued operations - (1.7) + Cumulative effect of change in accounting principle - 2.4 + Income taxes 150.9 142.4 Adjusted earnings before income taxes 398.4 383.1 + Adjusted interest expense (b) 160.4 135.6 - Adjusted income taxes (c) (211.7) (202.2) = Adjusted net earnings for ROC (numerator) $ 347.1 316.5 Average total debt $ 2,755.5 2,264.7 + Average off-balance sheet debt 97.7 124.2 + Average adjusted total shareholders' equity (d) 1,711.6 1,562.2 = Adjusted average total capital (denominator) $ 4,564.8 3,951.1 Adjusted ROC * 7.6% 8.0% Notes: (a) Discounted at the incremental borrowing rate at lease inception. (b) Interest expense includes implied interest on off-balance sheet vehicle obligations. (c) Income taxes were calculated using the effective income tax rate for the period exclusive of benefits from tax law changes recognized in 2006. (d) Represents shareholders' equity adjusted for accounting changes and tax benefits in those periods. * Non-GAAP financial measure Certain prior period amounts have been reclassified to conform to current year presentation.