
Recommended
More Related Content
Viewers also liked
Viewers also liked (20)
Similar to Ryder System Q4 2006 Earnings Report
Similar to Ryder System Q4 2006 Earnings Report (20)
More from finance44
More from finance44 (20)
Recently uploaded
Recently uploaded (20)
Ryder System Q4 2006 Earnings Report
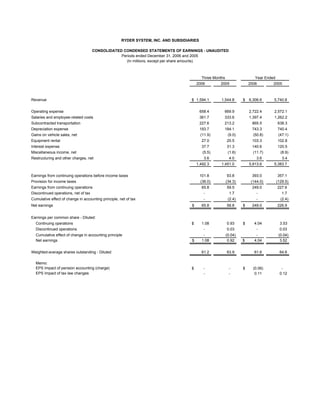
- 1. RYDER SYSTEM, INC. AND SUBSIDIARIES CONSOLIDATED CONDENSED STATEMENTS OF EARNINGS - UNAUDITED Periods ended December 31, 2006 and 2005 (In millions, except per share amounts) Three Months Year Ended 2006 2005 2006 2005 Revenue $ 1,594.1 1,544.8 $ 6,306.6 5,740.8 Operating expense 658.4 669.9 2,722.4 2,572.1 Salaries and employee-related costs 361.7 333.6 1,397.4 1,262.2 Subcontracted transportation 227.6 213.2 865.5 638.3 Depreciation expense 193.7 184.1 743.3 740.4 Gains on vehicle sales, net (11.9) (9.0) (50.8) (47.1) Equipment rental 27.0 25.5 103.3 102.8 Interest expense 37.7 31.3 140.6 120.5 Miscellaneous income, net (5.5) (1.6) (11.7) (8.9) Restructuring and other charges, net 3.6 4.0 3.6 3.4 1,492.3 1,451.0 5,913.6 5,383.7 Earnings from continuing operations before income taxes 101.8 93.8 393.0 357.1 Provision for income taxes (36.0) (34.3) (144.0) (129.5) Earnings from continuing operations 65.8 59.5 249.0 227.6 Discontinued operations, net of tax - 1.7 - 1.7 Cumulative effect of change in accounting principle, net of tax - (2.4) - (2.4) Net earnings $ 65.8 58.8 $ 249.0 226.9 Earnings per common share - Diluted: Continuing operations $ 1.08 0.93 $ 4.04 3.53 Discontinued operations - 0.03 - 0.03 Cumulative effect of change in accounting principle - (0.04) - (0.04) Net earnings $ 1.08 0.92 $ 4.04 3.52 Weighted-average shares outstanding - Diluted 61.2 63.9 61.6 64.6 Memo: EPS Impact of pension accounting (charge) $ - - $ (0.06) - EPS Impact of tax law changes - - 0.11 0.12
- 2. RYDER SYSTEM, INC. AND SUBSIDIARIES CONSOLIDATED CONDENSED BALANCE SHEETS PRELIMINARY AND SUBJECT TO RECLASSIFICATION (Dollars in millions) (unaudited) December 31, December 31, 2006 2005 Assets: Cash and cash equivalents $ 128.6 128.7 Other current assets 1,133.2 1,035.1 Revenue earning equipment, net 4,509.3 3,794.4 Operating property and equipment, net 499.0 486.8 Other assets 558.8 588.3 $ 6,828.9 6,033.3 Liabilities and shareholders' equity: Short-term debt / current portion of long-term debt $ 332.7 269.4 Other current liabilities 934.9 984.0 Long-term debt 2,484.2 1,916.0 Other non-current liabilities (including deferred income taxes) 1,356.3 1,336.4 Shareholders' equity 1,720.8 1,527.5 $ 6,828.9 6,033.3 SELECTED KEY RATIOS December 31, December 31, 2006 2005 Debt to equity 164% 143% Total obligations to equity (a) * 168% 151% Year Ended December 31, 2006 2005 Return on average shareholders' equity (b) 15.5% 14.6% Return on average assets (b) 3.9% 3.9% Return on capital* 7.9% 7.8% (a) Total obligations represent debt plus off-balance sheet equipment obligations. (b) Includes discontinued operations and the effect of accounting changes. * Non-GAAP financial measure; see reconciliation to closest GAAP financial measure included within this release.
- 3. RYDER SYSTEM, INC. AND SUBSIDIARIES BUSINESS SEGMENT REVENUE AND EARNINGS - UNAUDITED Periods ended December 31, 2006 and 2005 (Dollars in millions) Three Months Year Ended 2006 2005 B(W) 2006 2005 B(W) Revenue: Fleet Management Solutions: Full service lease $ 472.4 451.1 5% $ 1,848.3 1,785.6 4% Contract maintenance 37.9 32.6 16% 141.9 134.5 6% Contractual Revenue 510.3 483.7 5% 1,990.2 1,920.1 4% Contract-related maintenance 48.7 47.6 2% 193.1 191.1 1% Commercial rental 163.4 175.3 (7%) 665.7 686.3 (3%) Other 18.9 17.0 11% 72.1 67.4 7% Fuel 264.1 292.5 (10%) 1,174.9 1,056.3 11% Total Fleet Management Solutions 1,005.4 1,016.1 (1%) 4,096.0 3,921.2 4% Supply Chain Solutions 543.1 482.7 13% 2,028.5 1,637.8 24% Dedicated Contract Carriage 140.2 142.5 (2%) 568.8 543.3 5% Eliminations (94.6) (96.5) 2% (386.7) (361.5) (7%) Total revenue $ 1,594.1 1,544.8 3% $ 6,306.6 5,740.8 10% Operating Revenue: * Fleet Management Solutions $ 741.3 723.6 2% $ 2,921.1 2,864.9 2% Supply Chain Solutions 320.1 274.2 17% 1,182.9 1,015.8 16% Dedicated Contract Carriage 135.6 137.8 (2%) 548.9 527.0 4% Eliminations (51.0) (49.7) (3%) (198.7) (196.8) (1%) Total operating revenue $ 1,146.0 1,085.9 6% $ 4,454.2 4,210.9 6% Business segment earnings: Earnings before income taxes: Fleet Management Solutions $ 94.5 92.0 3% $ 368.1 354.4 4% Supply Chain Solutions 17.0 14.0 22% 62.1 39.4 58% Dedicated Contract Carriage 11.2 10.4 8% 42.6 35.1 21% Eliminations (9.0) (9.5) 3% (33.7) (32.7) (3%) 113.7 106.9 6% 439.1 396.2 11% Unallocated Central Support Services (11.1) (9.1) (22%) (39.5) (35.7) (10%) Earnings before restructuring and other charges, net and income taxes 102.6 97.8 5% 399.6 360.5 11% Restructuring and other (charges) recoveries, net and 2006 net retirement plan (charges) (0.8) (4.0) NA (6.6) (3.4) NA Earnings from continuing operations before income taxes 101.8 93.8 9% 393.0 357.1 10% Provision for income taxes (36.0) (34.3) (5%) (144.0) (129.5) (11%) Earnings from continuing operations 65.8 59.5 11% 249.0 227.6 9% Discontinued operations, net of tax - 1.7 NA - 1.7 NA Cumulative effect of change in accounting principle, net of tax - (2.4) NA - (2.4) NA Net earnings $ 65.8 58.8 12% $ 249.0 226.9 10% * Non-GAAP financial measure Note: Certain prior period amounts have been reclassified to conform to current year presentation. Amounts may not recalculate due to rounding.
- 4. RYDER SYSTEM, INC. AND SUBSIDIARIES BUSINESS SEGMENT INFORMATION - UNAUDITED Periods ended December 31, 2006 and 2005 (Dollars in millions) Three Months Year Ended 2006 2005 B(W) 2006 2005 B(W) Fleet Management Solutions Total revenue $ 1,005.4 1,016.1 (1%) $ 4,096.0 3,921.2 4% Fuel revenue (264.1) (292.5) (10%) (1,174.9) (1,056.3) 11% Operating revenue * $ 741.3 723.6 2% $ 2,921.1 2,864.9 2% Segment earnings before income taxes $ 94.5 92.0 3% $ 368.1 354.4 4% Earnings before income taxes as % of total revenue 9.4% 9.1% 9.0% 9.0% Earnings before income taxes as % of operating revenue * 12.8% 12.7% 12.6% 12.4% Supply Chain Solutions Total revenue $ 543.1 482.7 13% $ 2,028.5 1,637.8 24% Subcontracted transportation (223.0) (208.5) 7% (845.6) (622.0) 36% Operating revenue * $ 320.1 274.2 17% $ 1,182.9 1,015.8 16% Segment earnings before income taxes $ 17.0 14.0 22% $ 62.1 39.4 58% Earnings before income taxes as % of total revenue 3.1% 2.9% 3.1% 2.4% Earnings before income taxes as % of operating revenue * 5.3% 5.1% 5.3% 3.9% Memo: Fuel costs $ 24.9 25.5 2% $ 104.2 92.0 (13%) Dedicated Contract Carriage Total revenue $ 140.2 142.5 (2%) $ 568.8 543.3 5% Subcontracted transportation (4.6) (4.7) (2%) (19.9) (16.3) 22% Operating revenue * $ 135.6 137.8 (2%) $ 548.9 527.0 4% Segment earnings before income taxes $ 11.2 10.4 8% $ 42.6 35.1 21% Earnings before income taxes as % of total revenue 8.0% 7.3% 7.5% 6.5% Earnings before income taxes as % of operating revenue * 8.3% 7.5% 7.8% 6.7% Memo: Fuel costs $ 24.3 26.4 8% $ 104.6 94.1 (11%) * Non-GAAP financial measure Note: Amounts may not recalculate due to rounding.
- 5. RYDER SYSTEM, INC. AND SUBSIDIARIES NON-GAAP FINANCIAL MEASURE RECONCILIATIONS - PRELIMINARY AND UNAUDITED (In millions, except per share amounts) OPERATING REVENUE RECONCILIATION Three Months Year Ended 2006 2005 2006 2005 Total revenue $ 1,594.1 1,544.8 $ 6,306.6 5,740.8 Fuel services and subcontracted transportation revenue (491.7) (505.7) (2,040.4) (1,694.6) Fuel eliminations 43.6 46.8 188.0 164.7 Operating revenue * $ 1,146.0 1,085.9 $ 4,454.2 4,210.9 CASH FLOW RECONCILIATION Year ended December 31, 2006 2005 Net cash provided by operating activities $ 853.6 779.1 Proceeds from sales (primarily revenue earning equipment) 332.7 333.7 Collections on direct finance leases 66.3 70.4 Other investing, net 2.1 - Total cash generated * 1,254.7 1,183.2 Capital expenditures (1,695.1) (1,399.4) Acquisitions (4.1) (15.1) Free cash flow * $ (444.5) (231.3) DEBT TO EQUITY RECONCILIATION December 31, December 31, 2006 % to Equity % to Equity 2005 On-balance sheet debt $ 2,816.9 164% $ 2,185.4 143% Off-balance sheet debt - PV of minimum lease payments and guaranteed residual values under operating leases for vehicles (a) 78.0 117.0 Total obligations * $ 2,894.9 168% $ 2,302.4 151% NET EARNINGS RECONCILIATION Three Months Year Ended 2006 2005 2006 2005 Net earnings from continuing operations $ 65.8 59.5 $ 249.0 227.6 Excluding tax law changes and pension charge - - (3.1) (7.6) Net earnings excluding tax law changes and pension charge * $ 65.8 59.5 $ 245.9 220.0 EPS RECONCILIATION Three Months Year Ended 2006 2005 2006 2005 Earnings per share from continuing operations $ 1.08 0.93 $ 4.04 3.53 Excluding tax law changes and pension charge - - (0.05) (0.12) Earnings per share excluding tax law changes and pension charge * $ 1.08 0.93 $ 3.99 3.41 RETURN ON CAPITAL RECONCILIATION Year Ended December 31, 2006 2005 Net earnings (12-month rolling period) $ 249.0 226.9 - Discontinued operations - (1.7) + Cumulative effect of change in accounting principle - 2.4 + Income taxes 144.0 129.5 Adjusted earnings before income taxes 393.0 357.1 + Adjusted interest expense (b) 146.6 127.1 - Adjusted income taxes (c) (207.2) (185.9) = Adjusted net earnings for ROC (numerator) $ 332.4 298.3 Average total debt $ 2,480.3 2,147.8 + Average off-balance sheet debt 98.8 147.9 + Average adjusted total shareholders' equity (d) 1,605.2 1,550.0 = Adjusted average total capital (denominator) $ 4,184.3 3,845.7 Adjusted ROC * 7.9% 7.8% Notes: (a) Discounted at the incremental borrowing rate at lease inception. (b) Interest expense includes implied interest on off-balance sheet vehicle obligations. (c) Income taxes were calculated using the effective income tax rate for the period exclusive of benefits from tax law changes recognized in 2006 and 2005. (d) Represents shareholders' equity adjusted for discontinued operations, accounting changes and tax benefits in those periods. * Non-GAAP financial measure Earnings per share amounts are calculated independently for each component and may not be additive due to rounding. Certain prior period amounts have been reclassified to conform to current year presentation.