SlideShare a Scribd company logo
RYDER SYSTEM, INC. AND SUBSIDIARIES

                       CONSOLIDATED CONDENSED STATEMENTS OF EARNINGS - UNAUDITED
                                     Periods ended March 31, 2006 and 2005
                                      (In millions, except per share amounts)


                                                                                                       Three Months
                                                                                                  2006           2005


Revenue                                                                                       $      1,496.3     1,315.6


Operating expense                                                                                     661.3           610.4
Salaries and employee-related costs                                                                   337.5           307.6
Subcontracted transportation                                                                          202.2           111.9
Depreciation expense                                                                                  178.2           181.4
Gains on vehicle sales, net                                                                            (12.8)         (12.8)
Equipment rental                                                                                       24.9            27.3
Interest expense                                                                                       31.4            27.0
Miscellaneous income, net                                                                               (5.4)          (4.3)
Restructuring and other recoveries, net                                                                 (0.2)          (0.1)
                                                                                                     1,417.1     1,248.4


Earnings before income taxes                                                                           79.2            67.2
Provision for income taxes                                                                             (31.6)         (25.7)
Net earnings                                                                                  $        47.6            41.5


Earnings per common share - Diluted:
  Net earnings                                                                                $        0.77            0.64


Weighted-average shares outstanding - Diluted                                                          61.4            65.1


Note: Certain prior period amounts have been reclassified to conform to current year presentation.
RYDER SYSTEM, INC. AND SUBSIDIARIES

                            CONSOLIDATED CONDENSED BALANCE SHEETS - UNAUDITED
                               PRELIMINARY AND SUBJECT TO RECLASSIFICATION
                                             (Dollars in millions)


                                                                                         March 31,        December 31,
                                                                                          2006               2005

Assets:

  Cash and cash equivalents                                                          $          75.6               128.7
  Other current assets                                                                       1,080.9             1,035.1
  Revenue earning equipment, net                                                             3,909.1             3,794.4
  Operating property and equipment, net                                                        487.1               486.8
  Other assets                                                                                 572.6               588.3
                                                                                     $       6,125.3             6,033.3

Liabilities and shareholders' equity:

  Short-term debt / Current portion of long-term debt                                $         263.0               269.4
  Other current liabilities                                                                    951.3               984.0
  Long-term debt                                                                             2,035.8             1,916.0
  Other non-current liabilities (including deferred income taxes)                            1,351.6             1,336.4
  Shareholders' equity                                                                       1,523.6             1,527.5
                                                                                     $       6,125.3             6,033.3


                                                SELECTED KEY RATIOS

                                                                                         March 31,        December 31,
                                                                                          2006               2005

Debt to equity                                                                            151%               143%
Total obligations to equity (a) *                                                         159%               151%

                                                                                         Twelve months ended March 31,
                                                                                          2006               2005

Return on average shareholders' equity (b)                                                15.0%              15.3%
Return on average assets (b)                                                              3.9%               4.0%
Return on capital*                                                                        7.9%               7.7%


(a) Total obligations represent debt plus off-balance sheet equipment obligations.
(b) Includes discontinued operations and the effect of accounting changes.

* Non-GAAP financial measure; see reconciliation to closest GAAP financial measure included within this
release.


Note: Certain prior period amounts have been reclassified to conform to current year presentation.
RYDER SYSTEM, INC. AND SUBSIDIARIES

                          BUSINESS SEGMENT REVENUE AND EARNINGS - UNAUDITED
                                    Periods ended March 31, 2006 and 2005
                                              (Dollars in millions)

                                                                                              Three Months
                                                                                   2006           2005          B(W)
Revenue:
   Fleet Management Solutions:
      Full service lease                                                       $     451.4     $       441.7       2.2%
      Contract maintenance                                                            32.7              33.4     (2.0%)
      Contract-related maintenance                                                    47.3              49.0     (3.6%)
      Commercial rental                                                              149.9             152.7     (1.8%)
      Other                                                                           18.1              16.6       9.3%
      Fuel                                                                           281.8             231.2      21.8%
        Total Fleet Management Solutions                                             981.2             924.6       6.1%
   Supply Chain Solutions                                                            469.5             346.8      35.4%
   Dedicated Contract Carriage                                                       138.7             128.0       8.4%
   Eliminations                                                                      (93.1)            (83.8)   (11.0%)
        Total revenue                                                          $   1,496.3           1,315.6      13.7%

Business segment earnings:
  Earnings before income taxes:
    Fleet Management Solutions                                                 $      74.9              70.9       5.7%
    Supply Chain Solutions                                                            10.7               6.5     63.8%
    Dedicated Contract Carriage                                                        8.5               5.9     43.7%
    Eliminations                                                                      (7.9)             (7.6)    (3.2%)
                                                                                      86.2              75.7     13.9%
  Unallocated Central Support Services                                                (7.2)             (8.6)    16.0%
  Earnings before restructuring and
    other recoveries, net and income taxes                                            79.0              67.1      17.7%
  Restructuring and other recoveries, net                                              0.2               0.1    137.3%
  Earnings before income taxes                                                        79.2              67.2      17.8%
  Provision for income taxes                                                         (31.6)            (25.7)   (22.9%)
  Net earnings                                                                 $      47.6              41.5      14.7%


Note: Certain prior period amounts have been reclassified to conform to current year presentation.
Amounts may not recalculate due to rounding.
RYDER SYSTEM, INC. AND SUBSIDIARIES

                           BUSINESS SEGMENT INFORMATION - UNAUDITED
                                Periods ended March 31, 2006 and 2005
                                          (Dollars in millions)

                                                                                 Three Months
                                                                      2006            2005           B(W)

Fleet Management Solutions

Total revenue                                                     $     981.2          924.6         6.1%
Fuel revenue                                                           (281.8)        (231.2)        21.8%
Operating revenue *                                               $     699.4          693.4         0.9%

Segment earnings before income taxes                              $      74.9           70.9         5.7%

Earnings before income taxes as % of total revenue                       7.6%           7.7%

Earnings before income taxes as % of operating revenue *                10.7%          10.2%


Supply Chain Solutions

Total revenue                                                     $     469.5          346.8         35.4%
Subcontracted transportation                                           (197.1)        (108.7)        81.3%
Operating revenue *                                               $     272.4          238.1         14.4%

Segment earnings before income taxes                              $      10.7            6.5         63.8%

Earnings before income taxes as % of total revenue                       2.3%           1.9%

Earnings before income taxes as % of operating revenue *                 3.9%           2.7%

Memo: Fuel costs                                                  $      24.9           20.2         (23.1%)

Dedicated Contract Carriage

Total revenue                                                     $     138.7          128.0         8.4%
Subcontracted transportation                                             (5.1)          (3.2)        60.4%
Operating revenue *                                               $     133.6          124.8         7.0%

Segment earnings before income taxes                              $       8.5            5.9         43.7%

Earnings before income taxes as % of total revenue                       6.1%           4.6%

Earnings before income taxes as % of operating revenue *                 6.3%           4.7%

Memo: Fuel costs                                                  $      25.0           20.6         (21.4%)

* Non-GAAP financial measure
Note: Certain prior period amounts have been reclassified to conform to current year presentation.
Amounts may not recalculate due to rounding.
RYDER SYSTEM, INC. AND SUBSIDIARIES

                                   NON-GAAP FINANCIAL MEASURE RECONCILIATIONS - PRELIMINARY AND UNAUDITED
                                                       (In millions, except per share amounts)


FREE CASH FLOW RECONCILIATION                                                          Three months ended March 31
                                                                                         2006              2005

Net cash provided by (used in) operating activities                              $            117.2                   (22.6)
Net cash used in investing activities                                                        (225.0)                 (359.2)
Free cash flow *                                                                 $           (107.8)                 (381.8)

DEBT TO EQUITY RECONCILIATION                                                          March 31,                                   December 31,
                                                                                        2006               % to Equity                              % to Equity
                                                                                                                                      2005

On-balance sheet debt                                                            $          2,298.8          151%              $          2,185.4     143%
Off-balance sheet debt - PV of minimum lease payments and guaranteed
       residual values under operating leases for vehicles (a)                                117.1                                         117.0
Total obligations *                                                              $          2,415.9          159%              $          2,302.4     151%

RETURN ON CAPITAL RECONCILIATION

Reconciliation of Return On Capital (ROC) to the GAAP measure net earnings is as follows:

                                                                                      Twelve months ended March 31
                                                                                        2006               2005

      Net earnings * (12-month rolling period)                                   $            233.0    $              222.1
      - Discontinued operations                                                                (1.7)                    -
      + Cumulative effect of changes in accounting principles                                   2.4                     -
      + Income taxes                                                                          135.3                   120.2
         Adjusted earnings before income taxes                                                369.0                   342.3
      - Restructuring - gain on sale of headquarters                                            -                     (23.4)
      + Adjusted interest expense (b)                                                         131.5                   109.2
      - Adjusted income taxes (c)                                                            (194.0)                 (162.0)
      = Adjusted net earnings for ROC (numerator)                                $            306.5    $              266.1

      Average total debt                                                         $          2,214.8    $          1,847.3
      + Average off-balance sheet debt                                                        136.8                 157.2
      + Average adjusted total shareholders' equity (d)                                     1,551.9               1,450.4
      = Adjusted average total capital (denominator)                             $          3,903.5    $          3,454.9

      Adjusted ROC                                                                             7.9%                   7.7%

                                                                                     Three months
                                                                                     ended June 30
EPS RECONCILIATION
                                                                                         2005

Earnings per share                                                               $             0.98
Less: Tax change                                                                               0.12
Earnings per share excluding tax change *                                        $             0.86


Notes:
  (a) Discounted at the incremental borrowing rate at lease inception.
  (b) Interest expense includes implied interest on off-balance sheet vehicle obligations.
  (c) Income taxes was calculated using the effective income tax rate for the period exclusive of Ohio tax benefit
       recognized June 2005.
  (d) Represents shareholders' equity adjusted for discontinued operations, accounting changes and Ohio tax
       benefit in those periods.

    * Non-GAAP financial measure

      Earnings per share amounts are calculated independently for each component and may not be additive due to rounding.
      Certain prior period amounts have been reclassified to conform to current year presentation.

More Related Content

Similar to RYDERFINAL 1Q06FinancialInfo

RYDERFINAL Q107_tables
RYDERFINAL Q107_tablesRYDERFINAL Q107_tables
RYDERFINAL Q107_tablesfinance44
 
RYDERFINAL NewnewFINALPRTABLESQ108
RYDERFINAL NewnewFINALPRTABLESQ108RYDERFINAL NewnewFINALPRTABLESQ108
RYDERFINAL NewnewFINALPRTABLESQ108finance44
 
NewnewFINALPRTABLESQ108
NewnewFINALPRTABLESQ108NewnewFINALPRTABLESQ108
NewnewFINALPRTABLESQ108finance44
 
RYDERFINAL3QTables
 RYDERFINAL3QTables RYDERFINAL3QTables
RYDERFINAL3QTablesfinance44
 
RYDERFINAL Q105financialinfo
RYDERFINAL Q105financialinfoRYDERFINAL Q105financialinfo
RYDERFINAL Q105financialinfofinance44
 
RYDERFINAL Q406tables
RYDERFINAL Q406tablesRYDERFINAL Q406tables
RYDERFINAL Q406tablesfinance44
 
RYDERFINAL Q405tables
RYDERFINAL Q405tablesRYDERFINAL Q405tables
RYDERFINAL Q405tablesfinance44
 
RyderPresReleasTablesQ32005
RyderPresReleasTablesQ32005RyderPresReleasTablesQ32005
RyderPresReleasTablesQ32005finance44
 
RyderPresReleasTablesQ32005
RyderPresReleasTablesQ32005RyderPresReleasTablesQ32005
RyderPresReleasTablesQ32005finance44
 
RYDERFINAL2Q06_PRTables
RYDERFINAL2Q06_PRTablesRYDERFINAL2Q06_PRTables
RYDERFINAL2Q06_PRTablesfinance44
 
RYDERFINAL2Q06_PRTables
RYDERFINAL2Q06_PRTablesRYDERFINAL2Q06_PRTables
RYDERFINAL2Q06_PRTablesfinance44
 
RYDERFINAL Q407ryderfinancialinformation
RYDERFINAL Q407ryderfinancialinformationRYDERFINAL Q407ryderfinancialinformation
RYDERFINAL Q407ryderfinancialinformationfinance44
 
Q407ryderfinancialinformation
Q407ryderfinancialinformationQ407ryderfinancialinformation
Q407ryderfinancialinformationfinance44
 
RYDERFINAL 2Q05TablesFinal
RYDERFINAL 2Q05TablesFinalRYDERFINAL 2Q05TablesFinal
RYDERFINAL 2Q05TablesFinalfinance44
 
RYDERFINAL 2Q05TablesFinal
RYDERFINAL 2Q05TablesFinalRYDERFINAL 2Q05TablesFinal
RYDERFINAL 2Q05TablesFinalfinance44
 
updated3Q07PRTABLES%20v2
updated3Q07PRTABLES%20v2updated3Q07PRTABLES%20v2
updated3Q07PRTABLES%20v2finance44
 
updated3Q07PRTABLES%20v2
updated3Q07PRTABLES%20v2updated3Q07PRTABLES%20v2
updated3Q07PRTABLES%20v2finance44
 
updated3Q07PRTABLES%20v2
updated3Q07PRTABLES%20v2updated3Q07PRTABLES%20v2
updated3Q07PRTABLES%20v2finance44
 
updated3Q07PRTABLES%20v2
updated3Q07PRTABLES%20v2updated3Q07PRTABLES%20v2
updated3Q07PRTABLES%20v2finance44
 
updated3Q07PRTABLES%20v2
updated3Q07PRTABLES%20v2updated3Q07PRTABLES%20v2
updated3Q07PRTABLES%20v2finance44
 

Similar to RYDERFINAL 1Q06FinancialInfo (20)

RYDERFINAL Q107_tables
RYDERFINAL Q107_tablesRYDERFINAL Q107_tables
RYDERFINAL Q107_tables
 
RYDERFINAL NewnewFINALPRTABLESQ108
RYDERFINAL NewnewFINALPRTABLESQ108RYDERFINAL NewnewFINALPRTABLESQ108
RYDERFINAL NewnewFINALPRTABLESQ108
 
NewnewFINALPRTABLESQ108
NewnewFINALPRTABLESQ108NewnewFINALPRTABLESQ108
NewnewFINALPRTABLESQ108
 
RYDERFINAL3QTables
 RYDERFINAL3QTables RYDERFINAL3QTables
RYDERFINAL3QTables
 
RYDERFINAL Q105financialinfo
RYDERFINAL Q105financialinfoRYDERFINAL Q105financialinfo
RYDERFINAL Q105financialinfo
 
RYDERFINAL Q406tables
RYDERFINAL Q406tablesRYDERFINAL Q406tables
RYDERFINAL Q406tables
 
RYDERFINAL Q405tables
RYDERFINAL Q405tablesRYDERFINAL Q405tables
RYDERFINAL Q405tables
 
RyderPresReleasTablesQ32005
RyderPresReleasTablesQ32005RyderPresReleasTablesQ32005
RyderPresReleasTablesQ32005
 
RyderPresReleasTablesQ32005
RyderPresReleasTablesQ32005RyderPresReleasTablesQ32005
RyderPresReleasTablesQ32005
 
RYDERFINAL2Q06_PRTables
RYDERFINAL2Q06_PRTablesRYDERFINAL2Q06_PRTables
RYDERFINAL2Q06_PRTables
 
RYDERFINAL2Q06_PRTables
RYDERFINAL2Q06_PRTablesRYDERFINAL2Q06_PRTables
RYDERFINAL2Q06_PRTables
 
RYDERFINAL Q407ryderfinancialinformation
RYDERFINAL Q407ryderfinancialinformationRYDERFINAL Q407ryderfinancialinformation
RYDERFINAL Q407ryderfinancialinformation
 
Q407ryderfinancialinformation
Q407ryderfinancialinformationQ407ryderfinancialinformation
Q407ryderfinancialinformation
 
RYDERFINAL 2Q05TablesFinal
RYDERFINAL 2Q05TablesFinalRYDERFINAL 2Q05TablesFinal
RYDERFINAL 2Q05TablesFinal
 
RYDERFINAL 2Q05TablesFinal
RYDERFINAL 2Q05TablesFinalRYDERFINAL 2Q05TablesFinal
RYDERFINAL 2Q05TablesFinal
 
updated3Q07PRTABLES%20v2
updated3Q07PRTABLES%20v2updated3Q07PRTABLES%20v2
updated3Q07PRTABLES%20v2
 
updated3Q07PRTABLES%20v2
updated3Q07PRTABLES%20v2updated3Q07PRTABLES%20v2
updated3Q07PRTABLES%20v2
 
updated3Q07PRTABLES%20v2
updated3Q07PRTABLES%20v2updated3Q07PRTABLES%20v2
updated3Q07PRTABLES%20v2
 
updated3Q07PRTABLES%20v2
updated3Q07PRTABLES%20v2updated3Q07PRTABLES%20v2
updated3Q07PRTABLES%20v2
 
updated3Q07PRTABLES%20v2
updated3Q07PRTABLES%20v2updated3Q07PRTABLES%20v2
updated3Q07PRTABLES%20v2
 

More from finance44

oshkosh Q106_Presentation
oshkosh   Q106_Presentationoshkosh   Q106_Presentation
oshkosh Q106_Presentationfinance44
 
oshkosh Q206_Earnings_Presentation
oshkosh   Q206_Earnings_Presentationoshkosh   Q206_Earnings_Presentation
oshkosh Q206_Earnings_Presentationfinance44
 
oshkosh Q306_Presentation
oshkosh   Q306_Presentationoshkosh   Q306_Presentation
oshkosh Q306_Presentationfinance44
 
oshkosh Q107_Slides
oshkosh   Q107_Slidesoshkosh   Q107_Slides
oshkosh Q107_Slidesfinance44
 
oshkosh Q207_Slides
oshkosh   Q207_Slidesoshkosh   Q207_Slides
oshkosh Q207_Slidesfinance44
 
oshkosh Q32007slides
oshkosh   Q32007slidesoshkosh   Q32007slides
oshkosh Q32007slidesfinance44
 
oshkosh Q407_Earnings
oshkosh   Q407_Earningsoshkosh   Q407_Earnings
oshkosh Q407_Earningsfinance44
 
oshkosh Q108_earnings_slides
oshkosh   Q108_earnings_slidesoshkosh   Q108_earnings_slides
oshkosh Q108_earnings_slidesfinance44
 
oshkosh Q208_Slides
oshkosh   Q208_Slidesoshkosh   Q208_Slides
oshkosh Q208_Slidesfinance44
 
oshkosh Q308_Slides
oshkosh   Q308_Slidesoshkosh   Q308_Slides
oshkosh Q308_Slidesfinance44
 
OSK_Q4_2008_Earnings_Release_Slides
OSK_Q4_2008_Earnings_Release_SlidesOSK_Q4_2008_Earnings_Release_Slides
OSK_Q4_2008_Earnings_Release_Slidesfinance44
 
oshkosh Goldman_110508
oshkosh   Goldman_110508oshkosh   Goldman_110508
oshkosh Goldman_110508finance44
 
oshkosh Baird_111208
oshkosh   Baird_111208oshkosh   Baird_111208
oshkosh Baird_111208finance44
 
oshkosh B9FAB733-F810-4AE7-A95B-4388C6B08318_Cowen_020509
oshkosh   B9FAB733-F810-4AE7-A95B-4388C6B08318_Cowen_020509oshkosh   B9FAB733-F810-4AE7-A95B-4388C6B08318_Cowen_020509
oshkosh B9FAB733-F810-4AE7-A95B-4388C6B08318_Cowen_020509finance44
 
oshkosh Q108_earnings_slides
oshkosh   Q108_earnings_slidesoshkosh   Q108_earnings_slides
oshkosh Q108_earnings_slidesfinance44
 
oshkosh Q208_Slides
oshkosh   Q208_Slidesoshkosh   Q208_Slides
oshkosh Q208_Slidesfinance44
 
oshkosh Q308_Slides
oshkosh   Q308_Slidesoshkosh   Q308_Slides
oshkosh Q308_Slidesfinance44
 
oshkosh OSK_Q4_2008_Earnings_Release_Slides
oshkosh   OSK_Q4_2008_Earnings_Release_Slidesoshkosh   OSK_Q4_2008_Earnings_Release_Slides
oshkosh OSK_Q4_2008_Earnings_Release_Slidesfinance44
 

More from finance44 (20)

oshkosh Q106_Presentation
oshkosh   Q106_Presentationoshkosh   Q106_Presentation
oshkosh Q106_Presentation
 
oshkosh Q206_Earnings_Presentation
oshkosh   Q206_Earnings_Presentationoshkosh   Q206_Earnings_Presentation
oshkosh Q206_Earnings_Presentation
 
oshkosh Q306_Presentation
oshkosh   Q306_Presentationoshkosh   Q306_Presentation
oshkosh Q306_Presentation
 
OSK_101606
OSK_101606OSK_101606
OSK_101606
 
Oshkosh
OshkoshOshkosh
Oshkosh
 
oshkosh Q107_Slides
oshkosh   Q107_Slidesoshkosh   Q107_Slides
oshkosh Q107_Slides
 
oshkosh Q207_Slides
oshkosh   Q207_Slidesoshkosh   Q207_Slides
oshkosh Q207_Slides
 
oshkosh Q32007slides
oshkosh   Q32007slidesoshkosh   Q32007slides
oshkosh Q32007slides
 
oshkosh Q407_Earnings
oshkosh   Q407_Earningsoshkosh   Q407_Earnings
oshkosh Q407_Earnings
 
oshkosh Q108_earnings_slides
oshkosh   Q108_earnings_slidesoshkosh   Q108_earnings_slides
oshkosh Q108_earnings_slides
 
oshkosh Q208_Slides
oshkosh   Q208_Slidesoshkosh   Q208_Slides
oshkosh Q208_Slides
 
oshkosh Q308_Slides
oshkosh   Q308_Slidesoshkosh   Q308_Slides
oshkosh Q308_Slides
 
OSK_Q4_2008_Earnings_Release_Slides
OSK_Q4_2008_Earnings_Release_SlidesOSK_Q4_2008_Earnings_Release_Slides
OSK_Q4_2008_Earnings_Release_Slides
 
oshkosh Goldman_110508
oshkosh   Goldman_110508oshkosh   Goldman_110508
oshkosh Goldman_110508
 
oshkosh Baird_111208
oshkosh   Baird_111208oshkosh   Baird_111208
oshkosh Baird_111208
 
oshkosh B9FAB733-F810-4AE7-A95B-4388C6B08318_Cowen_020509
oshkosh   B9FAB733-F810-4AE7-A95B-4388C6B08318_Cowen_020509oshkosh   B9FAB733-F810-4AE7-A95B-4388C6B08318_Cowen_020509
oshkosh B9FAB733-F810-4AE7-A95B-4388C6B08318_Cowen_020509
 
oshkosh Q108_earnings_slides
oshkosh   Q108_earnings_slidesoshkosh   Q108_earnings_slides
oshkosh Q108_earnings_slides
 
oshkosh Q208_Slides
oshkosh   Q208_Slidesoshkosh   Q208_Slides
oshkosh Q208_Slides
 
oshkosh Q308_Slides
oshkosh   Q308_Slidesoshkosh   Q308_Slides
oshkosh Q308_Slides
 
oshkosh OSK_Q4_2008_Earnings_Release_Slides
oshkosh   OSK_Q4_2008_Earnings_Release_Slidesoshkosh   OSK_Q4_2008_Earnings_Release_Slides
oshkosh OSK_Q4_2008_Earnings_Release_Slides
 

Recently uploaded

655264371-checkpoint-science-past-papers-april-2023.pdf
655264371-checkpoint-science-past-papers-april-2023.pdf655264371-checkpoint-science-past-papers-april-2023.pdf
655264371-checkpoint-science-past-papers-april-2023.pdf
morearsh02
 
The secret way to sell pi coins effortlessly.
The secret way to sell pi coins effortlessly.The secret way to sell pi coins effortlessly.
The secret way to sell pi coins effortlessly.
DOT TECH
 
This assessment plan proposal is to outline a structured approach to evaluati...
This assessment plan proposal is to outline a structured approach to evaluati...This assessment plan proposal is to outline a structured approach to evaluati...
This assessment plan proposal is to outline a structured approach to evaluati...
lamluanvan.net Viết thuê luận văn
 
how can I sell/buy bulk pi coins securely
how can I sell/buy bulk pi coins securelyhow can I sell/buy bulk pi coins securely
how can I sell/buy bulk pi coins securely
DOT TECH
 
How to get verified on Coinbase Account?_.docx
How to get verified on Coinbase Account?_.docxHow to get verified on Coinbase Account?_.docx
How to get verified on Coinbase Account?_.docx
Buy bitget
 
What website can I sell pi coins securely.
What website can I sell pi coins securely.What website can I sell pi coins securely.
What website can I sell pi coins securely.
DOT TECH
 
Commercial Bank Economic Capsule - May 2024
Commercial Bank Economic Capsule - May 2024Commercial Bank Economic Capsule - May 2024
Commercial Bank Economic Capsule - May 2024
Commercial Bank of Ceylon PLC
 
Webinar Exploring DORA for Fintechs - Simont Braun
Webinar Exploring DORA for Fintechs - Simont BraunWebinar Exploring DORA for Fintechs - Simont Braun
Webinar Exploring DORA for Fintechs - Simont Braun
FinTech Belgium
 
how to sell pi coins on Binance exchange
how to sell pi coins on Binance exchangehow to sell pi coins on Binance exchange
how to sell pi coins on Binance exchange
DOT TECH
 
The WhatsPump Pseudonym Problem and the Hilarious Downfall of Artificial Enga...
The WhatsPump Pseudonym Problem and the Hilarious Downfall of Artificial Enga...The WhatsPump Pseudonym Problem and the Hilarious Downfall of Artificial Enga...
The WhatsPump Pseudonym Problem and the Hilarious Downfall of Artificial Enga...
muslimdavidovich670
 
Introduction to Value Added Tax System.ppt
Introduction to Value Added Tax System.pptIntroduction to Value Added Tax System.ppt
Introduction to Value Added Tax System.ppt
VishnuVenugopal84
 
Chương 6. Ancol - phenol - ether (1).pdf
Chương 6. Ancol - phenol - ether (1).pdfChương 6. Ancol - phenol - ether (1).pdf
Chương 6. Ancol - phenol - ether (1).pdf
va2132004
 
USDA Loans in California: A Comprehensive Overview.pptx
USDA Loans in California: A Comprehensive Overview.pptxUSDA Loans in California: A Comprehensive Overview.pptx
USDA Loans in California: A Comprehensive Overview.pptx
marketing367770
 
what is the best method to sell pi coins in 2024
what is the best method to sell pi coins in 2024what is the best method to sell pi coins in 2024
what is the best method to sell pi coins in 2024
DOT TECH
 
Which Crypto to Buy Today for Short-Term in May-June 2024.pdf
Which Crypto to Buy Today for Short-Term in May-June 2024.pdfWhich Crypto to Buy Today for Short-Term in May-June 2024.pdf
Which Crypto to Buy Today for Short-Term in May-June 2024.pdf
Kezex (KZX)
 
一比一原版BCU毕业证伯明翰城市大学毕业证成绩单如何办理
一比一原版BCU毕业证伯明翰城市大学毕业证成绩单如何办理一比一原版BCU毕业证伯明翰城市大学毕业证成绩单如何办理
一比一原版BCU毕业证伯明翰城市大学毕业证成绩单如何办理
ydubwyt
 
PF-Wagner's Theory of Public Expenditure.pptx
PF-Wagner's Theory of Public Expenditure.pptxPF-Wagner's Theory of Public Expenditure.pptx
PF-Wagner's Theory of Public Expenditure.pptx
GunjanSharma28848
 
Introduction to Indian Financial System ()
Introduction to Indian Financial System ()Introduction to Indian Financial System ()
Introduction to Indian Financial System ()
Avanish Goel
 
Intro_Economics_ GPresentation Week 4.pptx
Intro_Economics_ GPresentation Week 4.pptxIntro_Economics_ GPresentation Week 4.pptx
Intro_Economics_ GPresentation Week 4.pptx
shetivia
 
how to sell pi coins on Bitmart crypto exchange
how to sell pi coins on Bitmart crypto exchangehow to sell pi coins on Bitmart crypto exchange
how to sell pi coins on Bitmart crypto exchange
DOT TECH
 

Recently uploaded (20)

655264371-checkpoint-science-past-papers-april-2023.pdf
655264371-checkpoint-science-past-papers-april-2023.pdf655264371-checkpoint-science-past-papers-april-2023.pdf
655264371-checkpoint-science-past-papers-april-2023.pdf
 
The secret way to sell pi coins effortlessly.
The secret way to sell pi coins effortlessly.The secret way to sell pi coins effortlessly.
The secret way to sell pi coins effortlessly.
 
This assessment plan proposal is to outline a structured approach to evaluati...
This assessment plan proposal is to outline a structured approach to evaluati...This assessment plan proposal is to outline a structured approach to evaluati...
This assessment plan proposal is to outline a structured approach to evaluati...
 
how can I sell/buy bulk pi coins securely
how can I sell/buy bulk pi coins securelyhow can I sell/buy bulk pi coins securely
how can I sell/buy bulk pi coins securely
 
How to get verified on Coinbase Account?_.docx
How to get verified on Coinbase Account?_.docxHow to get verified on Coinbase Account?_.docx
How to get verified on Coinbase Account?_.docx
 
What website can I sell pi coins securely.
What website can I sell pi coins securely.What website can I sell pi coins securely.
What website can I sell pi coins securely.
 
Commercial Bank Economic Capsule - May 2024
Commercial Bank Economic Capsule - May 2024Commercial Bank Economic Capsule - May 2024
Commercial Bank Economic Capsule - May 2024
 
Webinar Exploring DORA for Fintechs - Simont Braun
Webinar Exploring DORA for Fintechs - Simont BraunWebinar Exploring DORA for Fintechs - Simont Braun
Webinar Exploring DORA for Fintechs - Simont Braun
 
how to sell pi coins on Binance exchange
how to sell pi coins on Binance exchangehow to sell pi coins on Binance exchange
how to sell pi coins on Binance exchange
 
The WhatsPump Pseudonym Problem and the Hilarious Downfall of Artificial Enga...
The WhatsPump Pseudonym Problem and the Hilarious Downfall of Artificial Enga...The WhatsPump Pseudonym Problem and the Hilarious Downfall of Artificial Enga...
The WhatsPump Pseudonym Problem and the Hilarious Downfall of Artificial Enga...
 
Introduction to Value Added Tax System.ppt
Introduction to Value Added Tax System.pptIntroduction to Value Added Tax System.ppt
Introduction to Value Added Tax System.ppt
 
Chương 6. Ancol - phenol - ether (1).pdf
Chương 6. Ancol - phenol - ether (1).pdfChương 6. Ancol - phenol - ether (1).pdf
Chương 6. Ancol - phenol - ether (1).pdf
 
USDA Loans in California: A Comprehensive Overview.pptx
USDA Loans in California: A Comprehensive Overview.pptxUSDA Loans in California: A Comprehensive Overview.pptx
USDA Loans in California: A Comprehensive Overview.pptx
 
what is the best method to sell pi coins in 2024
what is the best method to sell pi coins in 2024what is the best method to sell pi coins in 2024
what is the best method to sell pi coins in 2024
 
Which Crypto to Buy Today for Short-Term in May-June 2024.pdf
Which Crypto to Buy Today for Short-Term in May-June 2024.pdfWhich Crypto to Buy Today for Short-Term in May-June 2024.pdf
Which Crypto to Buy Today for Short-Term in May-June 2024.pdf
 
一比一原版BCU毕业证伯明翰城市大学毕业证成绩单如何办理
一比一原版BCU毕业证伯明翰城市大学毕业证成绩单如何办理一比一原版BCU毕业证伯明翰城市大学毕业证成绩单如何办理
一比一原版BCU毕业证伯明翰城市大学毕业证成绩单如何办理
 
PF-Wagner's Theory of Public Expenditure.pptx
PF-Wagner's Theory of Public Expenditure.pptxPF-Wagner's Theory of Public Expenditure.pptx
PF-Wagner's Theory of Public Expenditure.pptx
 
Introduction to Indian Financial System ()
Introduction to Indian Financial System ()Introduction to Indian Financial System ()
Introduction to Indian Financial System ()
 
Intro_Economics_ GPresentation Week 4.pptx
Intro_Economics_ GPresentation Week 4.pptxIntro_Economics_ GPresentation Week 4.pptx
Intro_Economics_ GPresentation Week 4.pptx
 
how to sell pi coins on Bitmart crypto exchange
how to sell pi coins on Bitmart crypto exchangehow to sell pi coins on Bitmart crypto exchange
how to sell pi coins on Bitmart crypto exchange
 

RYDERFINAL 1Q06FinancialInfo

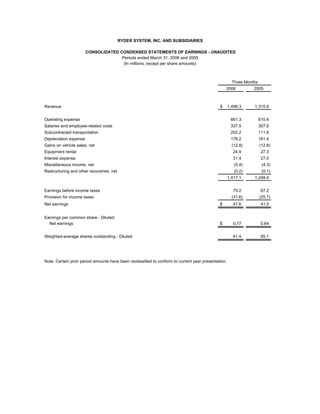
  • 1. RYDER SYSTEM, INC. AND SUBSIDIARIES CONSOLIDATED CONDENSED STATEMENTS OF EARNINGS - UNAUDITED Periods ended March 31, 2006 and 2005 (In millions, except per share amounts) Three Months 2006 2005 Revenue $ 1,496.3 1,315.6 Operating expense 661.3 610.4 Salaries and employee-related costs 337.5 307.6 Subcontracted transportation 202.2 111.9 Depreciation expense 178.2 181.4 Gains on vehicle sales, net (12.8) (12.8) Equipment rental 24.9 27.3 Interest expense 31.4 27.0 Miscellaneous income, net (5.4) (4.3) Restructuring and other recoveries, net (0.2) (0.1) 1,417.1 1,248.4 Earnings before income taxes 79.2 67.2 Provision for income taxes (31.6) (25.7) Net earnings $ 47.6 41.5 Earnings per common share - Diluted: Net earnings $ 0.77 0.64 Weighted-average shares outstanding - Diluted 61.4 65.1 Note: Certain prior period amounts have been reclassified to conform to current year presentation.
  • 2. RYDER SYSTEM, INC. AND SUBSIDIARIES CONSOLIDATED CONDENSED BALANCE SHEETS - UNAUDITED PRELIMINARY AND SUBJECT TO RECLASSIFICATION (Dollars in millions) March 31, December 31, 2006 2005 Assets: Cash and cash equivalents $ 75.6 128.7 Other current assets 1,080.9 1,035.1 Revenue earning equipment, net 3,909.1 3,794.4 Operating property and equipment, net 487.1 486.8 Other assets 572.6 588.3 $ 6,125.3 6,033.3 Liabilities and shareholders' equity: Short-term debt / Current portion of long-term debt $ 263.0 269.4 Other current liabilities 951.3 984.0 Long-term debt 2,035.8 1,916.0 Other non-current liabilities (including deferred income taxes) 1,351.6 1,336.4 Shareholders' equity 1,523.6 1,527.5 $ 6,125.3 6,033.3 SELECTED KEY RATIOS March 31, December 31, 2006 2005 Debt to equity 151% 143% Total obligations to equity (a) * 159% 151% Twelve months ended March 31, 2006 2005 Return on average shareholders' equity (b) 15.0% 15.3% Return on average assets (b) 3.9% 4.0% Return on capital* 7.9% 7.7% (a) Total obligations represent debt plus off-balance sheet equipment obligations. (b) Includes discontinued operations and the effect of accounting changes. * Non-GAAP financial measure; see reconciliation to closest GAAP financial measure included within this release. Note: Certain prior period amounts have been reclassified to conform to current year presentation.
  • 3. RYDER SYSTEM, INC. AND SUBSIDIARIES BUSINESS SEGMENT REVENUE AND EARNINGS - UNAUDITED Periods ended March 31, 2006 and 2005 (Dollars in millions) Three Months 2006 2005 B(W) Revenue: Fleet Management Solutions: Full service lease $ 451.4 $ 441.7 2.2% Contract maintenance 32.7 33.4 (2.0%) Contract-related maintenance 47.3 49.0 (3.6%) Commercial rental 149.9 152.7 (1.8%) Other 18.1 16.6 9.3% Fuel 281.8 231.2 21.8% Total Fleet Management Solutions 981.2 924.6 6.1% Supply Chain Solutions 469.5 346.8 35.4% Dedicated Contract Carriage 138.7 128.0 8.4% Eliminations (93.1) (83.8) (11.0%) Total revenue $ 1,496.3 1,315.6 13.7% Business segment earnings: Earnings before income taxes: Fleet Management Solutions $ 74.9 70.9 5.7% Supply Chain Solutions 10.7 6.5 63.8% Dedicated Contract Carriage 8.5 5.9 43.7% Eliminations (7.9) (7.6) (3.2%) 86.2 75.7 13.9% Unallocated Central Support Services (7.2) (8.6) 16.0% Earnings before restructuring and other recoveries, net and income taxes 79.0 67.1 17.7% Restructuring and other recoveries, net 0.2 0.1 137.3% Earnings before income taxes 79.2 67.2 17.8% Provision for income taxes (31.6) (25.7) (22.9%) Net earnings $ 47.6 41.5 14.7% Note: Certain prior period amounts have been reclassified to conform to current year presentation. Amounts may not recalculate due to rounding.
  • 4. RYDER SYSTEM, INC. AND SUBSIDIARIES BUSINESS SEGMENT INFORMATION - UNAUDITED Periods ended March 31, 2006 and 2005 (Dollars in millions) Three Months 2006 2005 B(W) Fleet Management Solutions Total revenue $ 981.2 924.6 6.1% Fuel revenue (281.8) (231.2) 21.8% Operating revenue * $ 699.4 693.4 0.9% Segment earnings before income taxes $ 74.9 70.9 5.7% Earnings before income taxes as % of total revenue 7.6% 7.7% Earnings before income taxes as % of operating revenue * 10.7% 10.2% Supply Chain Solutions Total revenue $ 469.5 346.8 35.4% Subcontracted transportation (197.1) (108.7) 81.3% Operating revenue * $ 272.4 238.1 14.4% Segment earnings before income taxes $ 10.7 6.5 63.8% Earnings before income taxes as % of total revenue 2.3% 1.9% Earnings before income taxes as % of operating revenue * 3.9% 2.7% Memo: Fuel costs $ 24.9 20.2 (23.1%) Dedicated Contract Carriage Total revenue $ 138.7 128.0 8.4% Subcontracted transportation (5.1) (3.2) 60.4% Operating revenue * $ 133.6 124.8 7.0% Segment earnings before income taxes $ 8.5 5.9 43.7% Earnings before income taxes as % of total revenue 6.1% 4.6% Earnings before income taxes as % of operating revenue * 6.3% 4.7% Memo: Fuel costs $ 25.0 20.6 (21.4%) * Non-GAAP financial measure Note: Certain prior period amounts have been reclassified to conform to current year presentation. Amounts may not recalculate due to rounding.
  • 5. RYDER SYSTEM, INC. AND SUBSIDIARIES NON-GAAP FINANCIAL MEASURE RECONCILIATIONS - PRELIMINARY AND UNAUDITED (In millions, except per share amounts) FREE CASH FLOW RECONCILIATION Three months ended March 31 2006 2005 Net cash provided by (used in) operating activities $ 117.2 (22.6) Net cash used in investing activities (225.0) (359.2) Free cash flow * $ (107.8) (381.8) DEBT TO EQUITY RECONCILIATION March 31, December 31, 2006 % to Equity % to Equity 2005 On-balance sheet debt $ 2,298.8 151% $ 2,185.4 143% Off-balance sheet debt - PV of minimum lease payments and guaranteed residual values under operating leases for vehicles (a) 117.1 117.0 Total obligations * $ 2,415.9 159% $ 2,302.4 151% RETURN ON CAPITAL RECONCILIATION Reconciliation of Return On Capital (ROC) to the GAAP measure net earnings is as follows: Twelve months ended March 31 2006 2005 Net earnings * (12-month rolling period) $ 233.0 $ 222.1 - Discontinued operations (1.7) - + Cumulative effect of changes in accounting principles 2.4 - + Income taxes 135.3 120.2 Adjusted earnings before income taxes 369.0 342.3 - Restructuring - gain on sale of headquarters - (23.4) + Adjusted interest expense (b) 131.5 109.2 - Adjusted income taxes (c) (194.0) (162.0) = Adjusted net earnings for ROC (numerator) $ 306.5 $ 266.1 Average total debt $ 2,214.8 $ 1,847.3 + Average off-balance sheet debt 136.8 157.2 + Average adjusted total shareholders' equity (d) 1,551.9 1,450.4 = Adjusted average total capital (denominator) $ 3,903.5 $ 3,454.9 Adjusted ROC 7.9% 7.7% Three months ended June 30 EPS RECONCILIATION 2005 Earnings per share $ 0.98 Less: Tax change 0.12 Earnings per share excluding tax change * $ 0.86 Notes: (a) Discounted at the incremental borrowing rate at lease inception. (b) Interest expense includes implied interest on off-balance sheet vehicle obligations. (c) Income taxes was calculated using the effective income tax rate for the period exclusive of Ohio tax benefit recognized June 2005. (d) Represents shareholders' equity adjusted for discontinued operations, accounting changes and Ohio tax benefit in those periods. * Non-GAAP financial measure Earnings per share amounts are calculated independently for each component and may not be additive due to rounding. Certain prior period amounts have been reclassified to conform to current year presentation.