Download to read offline
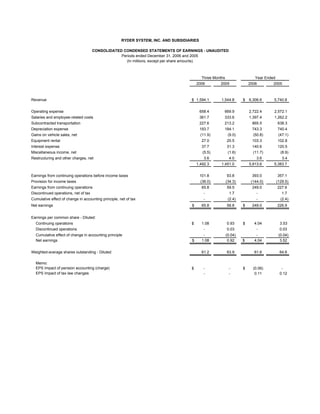


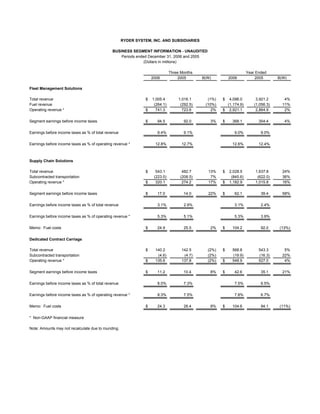
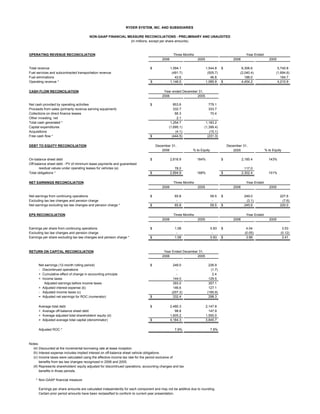
Ryder System, Inc. and Subsidiaries reported financial results for the three months and year ended December 31, 2006. For the quarter, revenue increased slightly to $1.594 billion while net earnings rose 11% to $65.8 million. For the full year, revenue grew 10% to $6.307 billion and net earnings increased 10% to $249 million. The company saw growth in its Fleet Management and Supply Chain Solutions segments, while Dedicated Contract Carriage remained relatively flat. Key metrics like return on equity and return on assets remained steady.


