Download to read offline

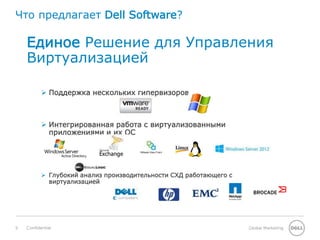
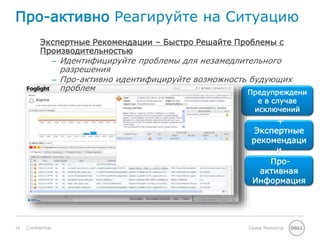
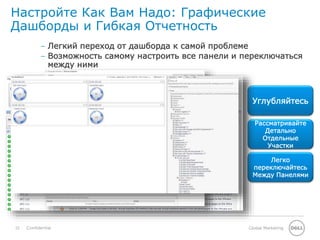
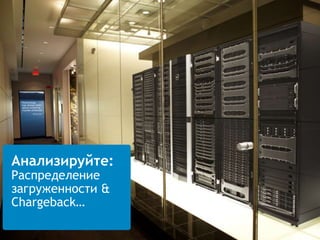
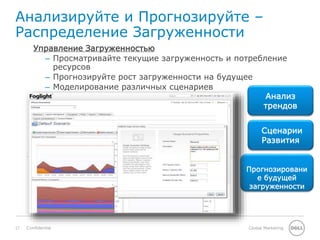
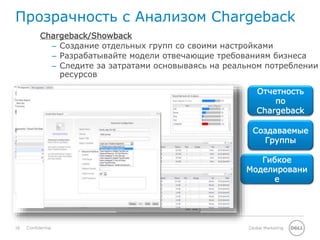

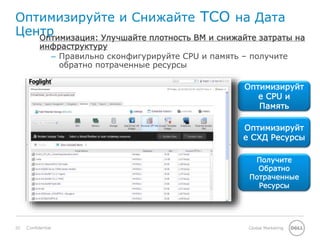
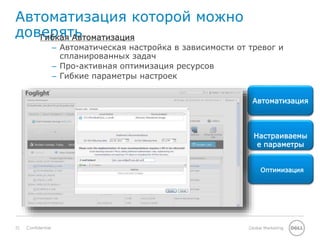
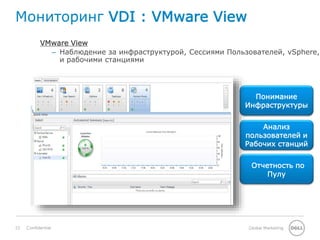
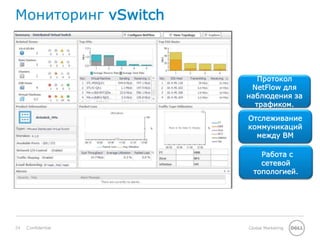
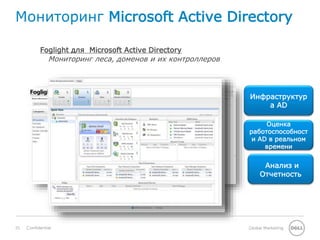
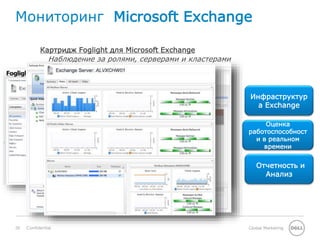
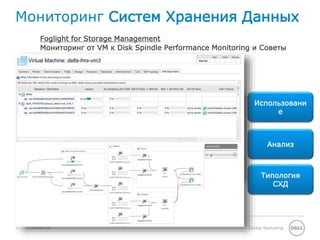
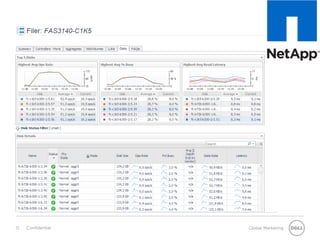
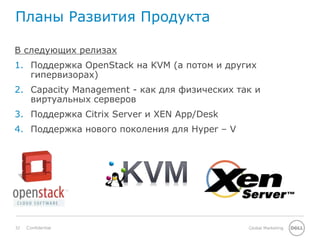
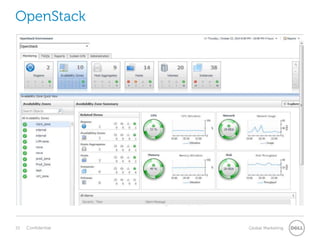


Документ описывает решения Dell для мониторинга виртуальной инфраструктуры и оптимизации ИТ-ресурсов с использованием Foglight. Он включает в себя различные аспекты мониторинга, анализа производительности и прогнозирования загруженности, а также предоставляет рекомендации для повышения эффективности управления. Также представлены планы развития продукта и функции поддержки разнообразных гипервизоров и приложений.


