Download to read offline


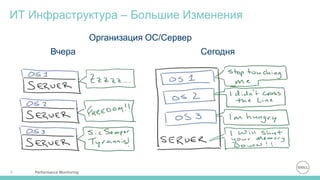


Документ описывает мониторинг производительности IT-инфраструктуры, подчеркивая важность единой консоли для управления виртуализацией и анализа систем в реальном времени. Он также освещает современные проблемы и возможности, связанные с использованием гипервизоров и систем хранения, предлагая автоматизированные решения для оптимизации ресурсов и устранения узких мест. Foglight for Virtualization упоминается как инструмент для глубокой аналитики и повышения эффективности управления производительностью.


