[ ]T
i
G 0
2
0
0
0π
−
= ,
T
Pi
i
T
F
−
= 0
0
0
0
1
∫
∑ ∆
∆
∆
∆
=
≠
=
i
N
i
j
j
ij
tie
Vi
Ti
i
T
i ACE
P
P
P
f
x
1
,
, ∑ ∆
⋅
=
≠
=
N
i
j
j
j
ij
i f
T
z
1
xi: State variables of the ith area
ui: Input of the ith area, zi: Interface variables
Tij: Synchronizing power coefficient of tie-line i-j
TPi: Generator’s time constant
TTi: Turbine’s time constant, THi: Governor’s time constant
Ri: Droop characteristic, Di: Damping coefficient
N: Number of interconnected areas
III. CONTROL DESIGN
The proposed controllers are designed for a given state
space model using an LQR (linear quadratic regulator) ap-
proach. It is known that the LQR has good gain and phase
stability margins, but an accurate model is needed and all of
its state variables are essential for its implementation. This is
not suitable for a decentralized control structure because of
the interface variables. In this paper, local state feedback
gains (Ki) are designed using LQR, but an additional feed-
forward gain (KDi) is separately designed to cancel the effects
of the interfaces [5].
A. Control Design with Available State and Interface
Variables
In this section, it is assumed that both state and interface
variables are available for feedback. Then, using the state
space model (1), a controller (ui) is designed as:
i
Di
xi
i
Di
i
i
i z
K
u
z
K
x
K
u +
=
+
−
= (2)
where
KDi: Interface cancellation gain
Ki : Stabilizing feedback gain, xi
u : Stabilizing input
then the closed loop system is expressed by:
( ) Di
i
i
i
Di
i
xi
i
i
i
i P
F
z
G
K
B
u
B
x
A
x ∆
+
+
+
+
=
& (3)
The gain (KDi) interfaces are designed later to cancel the in-
terface variables. Hence, the closed-loop system now has the
form:
Di
i
xi
i
i
i
i P
F
u
B
x
A
x ∆
+
+
=
& (4)
For a load frequency control problem, a non-zero set point,
i.e., steady state condition, is present when there is a change
in power demand (∆PDi). The set point is given by:
Di
i
o
i
i
o
i
i
o
i P
F
u
B
x
A
x ∆
+
+
=
= 0
& (5)
yielding:
o
i
i x
x = (6)
o
Ci
o
i
o
xi P
u
u ∆
=
= (7)
Define o
i
i
i x
x
x −
=
′ (8)
o
i
xi
i u
u
u −
=
′ (9)
Substitute eq. (8) and (9) into (4), a new system is obtained:
i
i
i
i
i u
B
x
A
x ′
+
′
=
′
& (10)
Subsequently, the controller parameters (Ki) in (2) are
designed using LQR with the following performance index.
( )
∫ ′
′
+
′
′
=
∞
0
dt
u
r
u
x
Q
x
J i
i
T
i
i
i
T
i
i (11)
where
Ji: Performance index of the ith subsystem
Qi : System weighting matrix
ri: Input weighting matrix
The optimal controller is:
i
i
i x
K
u ′
−
=
′ (12)
or o
i
i
o
i
i
i
xi x
K
u
x
K
u +
+
−
= (13)
In a deregulated power system, the generated power from
generating units will be allocated according to given load
following contracts shown as
∆
∆
∆
=
∆
∆
∆
dcm
dc
dc
nm
n
n
m
m
Gn
G
G
P
P
P
P
P
P
M
4
4
4
4 3
4
4
4
4 2
1
O
M
2
1
2
1
2
22
21
1
12
11
2
1
α
α
α
α
α
α
α
α
α
α
(14)
where
∆PGi: Required change in pu MW of the ith generating unit
∆Pdcj : Change in demand of the jth distribution company
αij: Contract factor that indicates ratio of required change
in pu MW of the ith generating unit to change in de-
mand (∆Pdcj) of the jth distribution company
∆
∆
∆
=
∆
∆
∆
Gn
G
G
N
DN
D
D
P
P
P
P
P
P
M
L
M
O
M
L
M
2
1
2
1
2
1
0
0
0
0
0
0
β
β
β
(15)
[ ] i
k
i ×
= 1
1
1
1 L
β (16)
∆PDi : Total change in demand for which the ith area are
responsible
ki: Number of generation units of the ith area
Consequently, designing the controller parameters (Ki)
must also satisfy contract-based constraints. At a desired set
point,
0-7803-7322-7/02/$17.00 (c) 2002 IEEE
1253
3.
o
i
i
o
Gi
o
Ci
o
i x
K
P
P
u −
=
∆
=
∆
=(17)
( ) Di
i
i
i
i
o
i P
F
K
B
A
x ∆
−
−
= −1
(18)
where
o
i
x : Set point of state variables
o
i
u : Set point of inputs
The input weighting matrix (ri) used for designing Ki will
be selected by “lsqnonlin”, a search routine embedded in the
optimization toolbox in MATLAB, to satisfy eq. (17) and
(18).
Load following
Contracts
(αij)
∆Pdi βi (List of generating
units of each area)
∆PGi, ∆PDi
Lsqnonlin
System
parameters
Ai, Bi, Fi
ri, Ki
Fig. 2. Flowchart of determination of control parameters (Ki).
Next, the interface cancellation gain (KDi) is designed to
cancel the effects of the interface on the integral of the area
control error, which is one of the state variables.
∫ =
= i
i
i
i x
C
ACE
y
~
~ (19)
The effect of the interface on the considered output ( i
y
~ ) is
( ) ( ) ( ) i
i
Di
i
i
i
i
i
zi z
G
K
B
K
B
A
C
y +
−
−
=
∞ −1
~
~ (20)
then the interface cancellation gain (KDi) is selected to make
eq. (20) equals to zero:
( ) ( ) i
i
i
i
i
Di
i
i
i
i
i G
K
B
A
C
K
B
K
B
A
C 1
1 ~
~ −
−
−
−
=
− (21)
( )
[ ] ( ) i
i
i
i
i
i
i
i
i
i
Di G
K
B
A
C
B
K
B
A
C
K 1
1
1 ~
~ −
−
−
−
−
−
= (22)
From eq. (21), interface cancellation gain (KDi), however, can
be obtained as far as the number of inputs are not less than
that of the outputs.
B. Control Design with Estimation of State and Interface
Variables
In an interconnected power system, not all the state vari-
ables are measurable, and the interface variables cannot be
obtained from local measurements. In this paper, a local
Kalman filter is used to overcome this limitation by estimat-
ing the required state and interface variables using only avail-
able measurements at the expense of some performance deg-
radation. The structure of the proposed controller using esti-
mates obtained from a Kalman filter is illustrated in Fig. 3.
Subsystem
(area #i)
Kalman
Filter
-Ki
+
KDi
ui(t) = ∆PCi
zi(t)
yi(t)
wi(t) vi(t)
zi(t)
^
^
xi(t)
xi(t)
PDi
Fig. 3. Decentralized control structure for the ith subsystem.
wi : Plant noise, vi: Measurement noise
ui: Control input, yi: Output
To design a Kalman filter that will estimate both local and
interface variables a dynamical model for these variables is
desired. This model is obtained by introducing the dynamics
of the interface variable (zi), a combination of the deviations
of frequencies from the other areas, in the following form:
fi
i w
z =
& (23)
where wfi is a fictitious white noise. The reason for this as-
sumption comes from the nature of the area frequencies
whose deviations keep oscillating around zero, and are
bounded when NERC’s performance standards are met.
However, the variance of the fictitious noise must be properly
chosen to increase the accuracy of the above model. In this
paper, the value of this variance is chosen at 0.001 by trial-
and-error.
Augmenting the model given by (1) by adding the interface
dynamics given by (23) gives the following model:
Di
i
i
i
i
i
i
i
i P
F
W
G
u
B
x
A
x ∆
+
+
+
=
& (24)
i
i
i
i v
x
C
y +
= (25)
where
=
i
i
i
z
x
x ,
=
fi
i
i
w
w
W ,
=
0
0
i
i
i
G
A
A ,
=
0
i
i
B
B ,
=
0
i
i
F
F
T
i
G
=
1
0
0
0
0
0
0
0
0
1
0
0
,
=
1
0
0
0
0
0
1
0
0
0
0
0
0
0
1
i
C , [ ]
0
i
i C
C =
i
x : Augmented state vector
A Kalman filter, based on (24) and (25), is designed to
estimate the augmented state vector. It is given by:
Di
i
i
i
i
i
i
i
i
i
i P
F
y
L
u
B
x
A
z
x
x ∆
+
+
+
=
= ˆ
ˆ
ˆ
ˆ
ˆ
&
&
&
(26)
0-7803-7322-7/02/$17.00 (c) 2002 IEEE
1254
4.
i
i
i
i C
L
A
A −
=
ˆ(27)
where Li is the Kalman gain that can be determined by a
MATLAB function called “KALMAN.”
The full dynamical model of the ith subsystem including
the dynamics of the actual system in (1) and the Kalman es-
timator in (26) is expressed in (28).
Di
i
i
i
i
i
i
i
i
i
i
i
i
i
i
i
P
F
F
z
G
u
B
B
x
x
A
C
L
A
x
x
∆
+
+
+
=
0
ˆ
ˆ
0
ˆ
&
&
(28)
In Fig. 3, the input of the subsystem using the estimates of
state variables and interface is defined as
i
Di
i
i
i z
K
x
K
u ˆ
ˆ +
−
= (29)
IV. PERFORMANCE ANALYSIS
The stability of the entire interconnected system, called
here the composite or actual system, when the proposed con-
trollers are implemented, is of a major concern rather than
that of individual subsystems. The composite system has the
following state-space model and control input:
D
P
F
Bu
Ax
x ∆
+
+
=
& (30)
Kx
u −
= (31)
where
T
T
N
T
T
T
N
T
T
x
x
x
x
x
x
x
=
&
L
&
&
&
L
&
& ˆ
ˆ
ˆ
2
1
2
1
[ ]T
N
u
u
u
u L
2
1
= , [ ]T
DN
D
D
D P
P
P
P ∆
∆
∆
=
∆ L
2
1
=
N
N
N
N
N
N
N
N
A
C
L
A
C
L
A
C
L
A
G
G
G
A
G
G
G
A
A
ˆ
0
0
0
0
0
ˆ
0
0
0
0
0
ˆ
0
0
0
0
0
0
0
0
0
2
2
2
1
1
1
2
1
2
2
21
1
12
1
L
L
M
O
M
M
O
M
L
L
L
L
O
M
M
O
M
M
L
L
T
T
N
T
N
T
T
T
T
B
B
B
B
B
B
B
=
L
L
O
M
O
M
M
M
L
L
0
0
0
0
0
0
0
0
2
2
1
1
j
ij
i
ij S
T
G
G = , [ ]
4
4 3
4
4 2
1
L
j
x
of
rows
of
number
j
S 0
0
0
1
=
=
N
NxN
K
K
K
K
L
O
M
M
L
0
0
0
0
0 2
1
, [ ]
Di
i
i K
K
K −
=
The system matrix (A) can be written as
G
A
A
~
~
+
= (32)
where
A
~
: Ideal system matrix without interface consideration, i.e.,
A
A =
~
where any 0
=
ij
G
G
~
: Interface matrix
The closed loop system is:
D
cl
D P
F
x
A
P
F
x
BK
A
x ∆
+
=
∆
+
−
= )
(
& (33)
( ) G
A
G
BK
A
A cl
cl
~
~
~
~
+
=
+
−
= (34)
The performance of the composite closed-loop system (Acl)
is analyzed based on its eigenvalues. Let µ be any eigenvalue
of the composite closed-loop system, i.e. an eigenvalue of Acl,
and λi be the ith eigenvalue of cl
A
~
. The objective of this sec-
tion is to estimate the maximum departure of µ from the ei-
genvalues of cl
A
~
. For this purpose let:
{ }
n
cl diag
D
T
A
T ~
2
1
1
,
,
,
~
λ
λ
λ L
=
=
−
(35)
then
Γ
+
=
+
= −
−
−
D
T
G
T
T
A
T
T
A
T cl
cl
~
~ 1
1
1
(36)
Gershgorin Circle Theorem [6] states:
∑ Γ
≤
−
∈
=
ℑ
=
n
j
ij
i
i d
C
d
~
1
: λ (37)
i
ℑ : Gershgorin disk’s region
C : Complex domain
ij
Γ : (i-j) entity of the matrix Γ
From Gershgorin’s theorem, a Gershgorin disk’s region
gives an estimate of the maximum departure of the composite
closed-loop system eigenvalues (µ) from the eigenvalues (λi)
of the closed-loop control area model. Since the strength of
the interconnection is preset, one can guarantee closed-loop
stability of the composite system by properly designing the
area controllers.
V. CASE STUDY
A power system, which consists of three control areas in-
terconnected through a number of tie-lines as shown in Fig. 4
is used to illustrate the proposed idea.
Area 1 Area 2
Area 3
tie-line
Fig. 4. A three-area power system.
0-7803-7322-7/02/$17.00 (c) 2002 IEEE
1255
5.
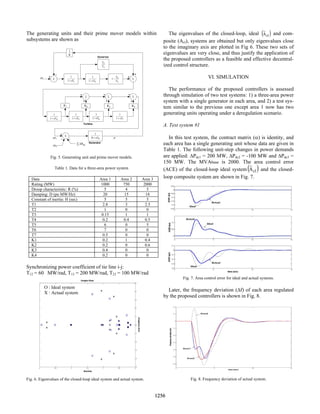
The generating unitsand their prime mover models within
subsystems are shown as
Σ
Σ Σ Σ
K1 K2 K3 K4
Σ
Σ
∆Pc
Governor
Generator
Turbine
∆f
∆PT
+
_
+
∑∆ tie
P
D
P
∆
2
1
1
sT
+
3
2
T
T
R
1
3
2
1
T
T
−
+
+
4
1
1
sT
+ 5
1
1
sT
+
+
+
+
+
+
+
6
1
1
sT
+ 7
1
1
sT
+
_
_
1
1
1
sT
+
P
sT
D +
1
Fig. 5. Generating unit and prime mover models.
Table 1. Data for a three-area power system
Data Area 1 Area 2 Area 3
Rating (MW) 1000 750 2000
Droop characteristic: R (%) 5 4 5
Damping: D (pu MW/Hz) 20 15 18
Constant of inertia: H (sec) 5 5 5
T1 2.8 3 2.5
T2 1 0 0
T3 0.15 1 1
T4 0.2 0.4 0.5
T5 6 0 5
T6 7 0 0
T7 0.5 0 0
K1 0.2 1 0.4
K2 0.2 0 0.6
K3 0.4 0 0
K4 0.2 0 0
Synchronizing power coefficient of tie line i-j:
T12 = 60 MW/rad, T13 = 200 MW/rad, T23 = 100 MW/rad
Fig. 6. Eigenvalues of the closed-loop ideal system and actual system.
The eigenvalues of the closed-loop, ideal ( )
cl
A
~
and com-
posite (Acl), systems are obtained but only eigenvalues close
to the imaginary axis are plotted in Fig 6. These two sets of
eigenvalues are very close, and thus justify the application of
the proposed controllers as a feasible and effective decentral-
ized control structure.
VI. SIMULATION
The performance of the proposed controllers is assessed
through simulation of two test systems: 1) a three-area power
system with a single generator in each area, and 2) a test sys-
tem similar to the previous one except area 1 now has two
generating units operating under a deregulation scenario.
A. Test system #1
In this test system, the contract matrix (α) is identity, and
each area has a single generating unit whose data are given in
Table 1. The following unit-step changes in power demands
are applied: ∆Pdc1 = 200 MW, ∆Pdc2 = -100 MW and ∆Pdc3 =
150 MW. The MVAbase is 2000. The area control error
(ACE) of the closed-loop ideal system ( )
cl
A
~
and the closed-
loop composite system are shown in Fig. 7.
Fig. 7. Area control error for ideal and actual systems.
Later, the frequency deviation (∆f) of each area regulated
by the proposed controllers is shown in Fig. 8.
Fig. 8. Frequency deviation of actual system.
O : Ideal system
X : Actual system
0-7803-7322-7/02/$17.00 (c) 2002 IEEE
1256
6.
B. Test system#2
This test system is more realistic than the previous one.
Now area 1 has an additional generating unit identical to the
one in area 2. It is used to demonstrate the ability of the pro-
posed controllers to allocate generating units’s outputs ac-
cording to a given load following contract described as
pu
P
P
P
P
P
P
P
dc
dc
dc
G
G
G
G
−
=
∆
∆
∆
=
∆
∆
∆
∆
6
.
0
0325
.
0
0475
.
0
05
.
0
8
.
0
0
0
1
.
0
8
.
0
0
1
.
0
0
4
.
0
0
2
.
0
6
.
0
3
2
1
4
3
2
1
4
4 3
4
4 2
1
α
Later the identical changes in demands in the previous test
system are applied. Then the total change in demand for
which each area has to be responsible can be obtained as
pu
P
P
P
P
P
P
P
G
G
G
G
D
D
D
=
∆
∆
∆
∆
=
∆
∆
∆
0.06
0.0325
-
0975
.
0
1
0
0
0
0
1
0
0
0
0
1
1
4
3
2
1
3
2
1
After the simulation is completed, the changes in turbine
power (∆PT) of each unit are shown in Fig. 9.
Fig. 9. Changes in turbine power for test system #2.
The area control error and frequency deviation of each area
are shown as Fig. 10 and 11 respectively.
Fig. 10. Area control error for test system #2
Fig. 11. Frequency deviation for test system #2.
VII. CONCLUSION
This paper proposes a decentralized controller for the load
frequency control operated as a load following service. Decen-
tralization is achieved by developing a model for the interface
variables, which is a combination of frequencies of other sub-
systems. To account for the modeling uncertainties, a local
Kalman filter is designed to estimate each subsystem’s own
and interface variables. The controller uses these estimates,
optimizes a given performance index, and allocates generat-
ing units’s outputs according to a deregulation scenario. The
performance of the proposed controllers is assessed through
eigenanalysis and simulation of two test systems, each con-
sisting of a three-area power system. The first system has one
generator in each area, and the second has one area with two
units operating under a deregulation scenario. It is shown that
the proposed technique gives good results.
VIII. REFERENCES
[1] C. E. Fosha, Jr. and O. I. Elgerd, “The Megawatt-Frequency Control
Problem: A New Approach Via Optimal Control Theory,” IEEE Trans-
actions on Power Systems, vol. 89, no. 4, pp. 563-577, April 1970.
[2] M. L. Kothari, N. Sinha and M. Rafi, “Automatic Generation Control of
an Interconnected Power System Under Deregulated Environment,”
Power Quality’ 98, pp. 95-102, 1998.
[3] R. D. Christie and A. Bose, “Load Frequency Control Issues in Power
System Operations after Deregulation”, IEEE Transaction on Power
Systems, Vol. 11, No. 3, pp. 1191-1200, August 1996.
[4] R. D. Christie and A. Bose, “Load Frequency Control In Hybrid Elec-
tric Power Markets,” Proceedings of the 1996 IEEE International Con-
ference on Control Applications, pp. 432-436, September, 1996.
[5] J. B. Burl, Linear Optimal Control, Addison Wesley Longman, Inc.,
1999.
[6] G. H. Golub and A.F. Van Loan, “Matrix Computations,” 2nd
edition,
Baltimore: The John Hopkins university Press, 1989.
IV. BIOGRAPHIES
Dulpichet Rerkpreedapong received his MSEE from the CSEE Depart-
ment, West Virginia University in 1999. He is currently working towards a
Ph.D. in Electrical Engineering at WVU. His research interests are in power
systems control and operation, and power systems restructuring.
Ali Feliachi received the MS and PhD degree in electrical engineering
from Georgia Tech in 1979 and 1983 respectively. He joined the faculty of
Electrical and Computer Engineering at West Virginia University in January
1984 where he is now a Full Professor and the holder of the endowed Electric
Power Systems Chair position. His research interests are in modeling,
simulation, control and estimation of large-scale systems with emphasis on
electric power systems.
0-7803-7322-7/02/$17.00 (c) 2002 IEEE
1257
![This work was sponsored in part by National Science Foundation under
grant ECS-9870041 and in part by US DOE/EPSCoR WV State Implementa-
tion Award.
The authors are with the Lane Department of Computer Science & Elec-
trical Engineering, West Virginia University, Morgantown, WV 26506.
Decentralized Load Frequency Control for
Load Following Services
Dulpichet Rerkpreedapong, Student Member, IEEE, and Ali Feliachi, Senior Member, IEEE
Abstract--This paper proposes a decentralized controller for
the load frequency control operated as a load following service.
Decentralization is achieved by developing a model for the inter-
face variables, which consist of frequencies of other subsystems.
To account for the modeling uncertainties, a local Kalman filter
is designed to estimate each subsystem’s own and interface vari-
ables. The controller uses these estimates, optimizes a given per-
formance index, and allocates generating units’s outputs accord-
ing to a deregulation scenario. Two test systems are given to
illustrate the proposed methodologies.
Index Terms--Load frequency control, Automatic generation
control, Decentralized control, Kalman filter, Estimation, Ancil-
lary services, Deregulation.
I. INTRODUCTION
HE power system consists of several interconnected con-
trol areas where each one is traditionally responsible for
its native load and scheduled interchanges with neighboring
areas. Load frequency control (LFC) or automatic generation
control (AGC) is the mechanism by which the energy balance
is maintained. Under deregulation, such a mechanism can be
used as a load following service operated by the regulating
units according to a given contract. The regulating unit in a
control area changes may change its output to match the
power demands in other areas, as the contract desires.
Conventionally, the area control error (ACE), which is a
combination of a frequency error (∆f) and a tie-line power
error (∆Ptie), reflects the control area’s performance, and is
used as the input to the load frequency controllers. Such con-
trollers are PI (Proportional-Integral) controllers whose pa-
rameters are tuned using lengthy simulations and trial-and-
error approaches. Several optimization techniques have been
proposed to solve this problem, but they require information
about the entire system rather than local information [1-2].
This paper proposes a completely decentralized LFC
scheme for load following services. A model for the interface
variables, which consist of frequencies of other control areas
or subsystems, is developed. To account for the modeling
uncertainties, a local Kalman filter is designed to estimate
each subsystem’s own and interface variables from only local
measurements, namely area frequency and tie-line power. The
deregulation scenario considered here assumes that generat-
ing units in each area supply a portion of the regulated power
according to their load following contracts [3-4]. Therefore,
the parameters of the proposed controllers are simultaneously
designed to control the generated power of each generating
unit to meet contractual requirement. The effectiveness of the
proposed controllers is demonstrated using two test systems,
each consisting of a three-area power system. The first system
has one generator in each area, and the second has one area
with two units operating under a deregulation scenario.
II. DYNAMIC MODEL
A large interconnected power system consists of a number
of subsystems or control areas. Each area can be modeled in
great details depending on the generators models and their
prime movers. But, to illustrate the proposed idea, a simple
dynamic model, shown in Fig. 1, is presented in this section.
The test system has a more elaborate model.
Hi
sT
+
1
1
Ti
sT
+
1
1
+ +
Di
P
∆
Ti
P
∆
∑∆
j
ij
tie
P
Pi
i sT
D +
1
i
R
1
i
f
∆
i
B
+
i
ACE
i
Ci u
P =
∆
Vi
P
∆
Governor T urbine
Fig. 1. Block diagram of the ith-generating unit.
PTi: turbine power PVi: governor valve
PCi: governor set point PDi: power demand
fi: frequency ΑCEi: Area control error
Ptie,ij: tie-line power between area i and j
∆: deviation from nominal values
The state space model for this system is given by:
Di
i
i
i
i
i
i
i
i P
F
z
G
u
B
x
A
x ∆
+
+
+
=
& (1)
where
∑
−
−
−
−
−
=
≠
=
0
1
0
0
0
0
0
0
2
0
0
1
0
1
0
0
1
1
0
0
1
0
1
1
i
N
i
j
j
ij
Hi
Hi
i
Ti
Ti
Pi
Pi
Pi
i
i
B
T
T
T
R
T
T
T
T
T
D
A
π
,
=
0
0
1
0
0
Hi
i T
B
T
0-7803-7322-7/02/$17.00 (c) 2002 IEEE
1252
0-7803-7322-7/02/$17.00 © 2002 IEEE](https://image.slidesharecdn.com/decentralizedlfc1-250320122355-ea1def85/85/Decentralized-LFC-in-all-detail-link-pdf-1-320.jpg)
![This work was sponsored in part by National Science Foundation under
grant ECS-9870041 and in part by US DOE/EPSCoR WV State Implementa-
tion Award.
The authors are with the Lane Department of Computer Science & Elec-
trical Engineering, West Virginia University, Morgantown, WV 26506.
Decentralized Load Frequency Control for
Load Following Services
Dulpichet Rerkpreedapong, Student Member, IEEE, and Ali Feliachi, Senior Member, IEEE
Abstract--This paper proposes a decentralized controller for
the load frequency control operated as a load following service.
Decentralization is achieved by developing a model for the inter-
face variables, which consist of frequencies of other subsystems.
To account for the modeling uncertainties, a local Kalman filter
is designed to estimate each subsystem’s own and interface vari-
ables. The controller uses these estimates, optimizes a given per-
formance index, and allocates generating units’s outputs accord-
ing to a deregulation scenario. Two test systems are given to
illustrate the proposed methodologies.
Index Terms--Load frequency control, Automatic generation
control, Decentralized control, Kalman filter, Estimation, Ancil-
lary services, Deregulation.
I. INTRODUCTION
HE power system consists of several interconnected con-
trol areas where each one is traditionally responsible for
its native load and scheduled interchanges with neighboring
areas. Load frequency control (LFC) or automatic generation
control (AGC) is the mechanism by which the energy balance
is maintained. Under deregulation, such a mechanism can be
used as a load following service operated by the regulating
units according to a given contract. The regulating unit in a
control area changes may change its output to match the
power demands in other areas, as the contract desires.
Conventionally, the area control error (ACE), which is a
combination of a frequency error (∆f) and a tie-line power
error (∆Ptie), reflects the control area’s performance, and is
used as the input to the load frequency controllers. Such con-
trollers are PI (Proportional-Integral) controllers whose pa-
rameters are tuned using lengthy simulations and trial-and-
error approaches. Several optimization techniques have been
proposed to solve this problem, but they require information
about the entire system rather than local information [1-2].
This paper proposes a completely decentralized LFC
scheme for load following services. A model for the interface
variables, which consist of frequencies of other control areas
or subsystems, is developed. To account for the modeling
uncertainties, a local Kalman filter is designed to estimate
each subsystem’s own and interface variables from only local
measurements, namely area frequency and tie-line power. The
deregulation scenario considered here assumes that generat-
ing units in each area supply a portion of the regulated power
according to their load following contracts [3-4]. Therefore,
the parameters of the proposed controllers are simultaneously
designed to control the generated power of each generating
unit to meet contractual requirement. The effectiveness of the
proposed controllers is demonstrated using two test systems,
each consisting of a three-area power system. The first system
has one generator in each area, and the second has one area
with two units operating under a deregulation scenario.
II. DYNAMIC MODEL
A large interconnected power system consists of a number
of subsystems or control areas. Each area can be modeled in
great details depending on the generators models and their
prime movers. But, to illustrate the proposed idea, a simple
dynamic model, shown in Fig. 1, is presented in this section.
The test system has a more elaborate model.
Hi
sT
+
1
1
Ti
sT
+
1
1
+ +
Di
P
∆
Ti
P
∆
∑∆
j
ij
tie
P
Pi
i sT
D +
1
i
R
1
i
f
∆
i
B
+
i
ACE
i
Ci u
P =
∆
Vi
P
∆
Governor T urbine
Fig. 1. Block diagram of the ith-generating unit.
PTi: turbine power PVi: governor valve
PCi: governor set point PDi: power demand
fi: frequency ΑCEi: Area control error
Ptie,ij: tie-line power between area i and j
∆: deviation from nominal values
The state space model for this system is given by:
Di
i
i
i
i
i
i
i
i P
F
z
G
u
B
x
A
x ∆
+
+
+
=
& (1)
where
∑
−
−
−
−
−
=
≠
=
0
1
0
0
0
0
0
0
2
0
0
1
0
1
0
0
1
1
0
0
1
0
1
1
i
N
i
j
j
ij
Hi
Hi
i
Ti
Ti
Pi
Pi
Pi
i
i
B
T
T
T
R
T
T
T
T
T
D
A
π
,
=
0
0
1
0
0
Hi
i T
B
T
0-7803-7322-7/02/$17.00 (c) 2002 IEEE
1252
0-7803-7322-7/02/$17.00 © 2002 IEEE](https://image.slidesharecdn.com/decentralizedlfc1-250320122355-ea1def85/75/Decentralized-LFC-in-all-detail-link-pdf-1-2048.jpg)
![[ ]T
i
G 0
2
0
0
0 π
−
= ,
T
Pi
i
T
F
−
= 0
0
0
0
1
∫
∑ ∆
∆
∆
∆
=
≠
=
i
N
i
j
j
ij
tie
Vi
Ti
i
T
i ACE
P
P
P
f
x
1
,
, ∑ ∆
⋅
=
≠
=
N
i
j
j
j
ij
i f
T
z
1
xi: State variables of the ith area
ui: Input of the ith area, zi: Interface variables
Tij: Synchronizing power coefficient of tie-line i-j
TPi: Generator’s time constant
TTi: Turbine’s time constant, THi: Governor’s time constant
Ri: Droop characteristic, Di: Damping coefficient
N: Number of interconnected areas
III. CONTROL DESIGN
The proposed controllers are designed for a given state
space model using an LQR (linear quadratic regulator) ap-
proach. It is known that the LQR has good gain and phase
stability margins, but an accurate model is needed and all of
its state variables are essential for its implementation. This is
not suitable for a decentralized control structure because of
the interface variables. In this paper, local state feedback
gains (Ki) are designed using LQR, but an additional feed-
forward gain (KDi) is separately designed to cancel the effects
of the interfaces [5].
A. Control Design with Available State and Interface
Variables
In this section, it is assumed that both state and interface
variables are available for feedback. Then, using the state
space model (1), a controller (ui) is designed as:
i
Di
xi
i
Di
i
i
i z
K
u
z
K
x
K
u +
=
+
−
= (2)
where
KDi: Interface cancellation gain
Ki : Stabilizing feedback gain, xi
u : Stabilizing input
then the closed loop system is expressed by:
( ) Di
i
i
i
Di
i
xi
i
i
i
i P
F
z
G
K
B
u
B
x
A
x ∆
+
+
+
+
=
& (3)
The gain (KDi) interfaces are designed later to cancel the in-
terface variables. Hence, the closed-loop system now has the
form:
Di
i
xi
i
i
i
i P
F
u
B
x
A
x ∆
+
+
=
& (4)
For a load frequency control problem, a non-zero set point,
i.e., steady state condition, is present when there is a change
in power demand (∆PDi). The set point is given by:
Di
i
o
i
i
o
i
i
o
i P
F
u
B
x
A
x ∆
+
+
=
= 0
& (5)
yielding:
o
i
i x
x = (6)
o
Ci
o
i
o
xi P
u
u ∆
=
= (7)
Define o
i
i
i x
x
x −
=
′ (8)
o
i
xi
i u
u
u −
=
′ (9)
Substitute eq. (8) and (9) into (4), a new system is obtained:
i
i
i
i
i u
B
x
A
x ′
+
′
=
′
& (10)
Subsequently, the controller parameters (Ki) in (2) are
designed using LQR with the following performance index.
( )
∫ ′
′
+
′
′
=
∞
0
dt
u
r
u
x
Q
x
J i
i
T
i
i
i
T
i
i (11)
where
Ji: Performance index of the ith subsystem
Qi : System weighting matrix
ri: Input weighting matrix
The optimal controller is:
i
i
i x
K
u ′
−
=
′ (12)
or o
i
i
o
i
i
i
xi x
K
u
x
K
u +
+
−
= (13)
In a deregulated power system, the generated power from
generating units will be allocated according to given load
following contracts shown as
∆
∆
∆
=
∆
∆
∆
dcm
dc
dc
nm
n
n
m
m
Gn
G
G
P
P
P
P
P
P
M
4
4
4
4 3
4
4
4
4 2
1
O
M
2
1
2
1
2
22
21
1
12
11
2
1
α
α
α
α
α
α
α
α
α
α
(14)
where
∆PGi: Required change in pu MW of the ith generating unit
∆Pdcj : Change in demand of the jth distribution company
αij: Contract factor that indicates ratio of required change
in pu MW of the ith generating unit to change in de-
mand (∆Pdcj) of the jth distribution company
∆
∆
∆
=
∆
∆
∆
Gn
G
G
N
DN
D
D
P
P
P
P
P
P
M
L
M
O
M
L
M
2
1
2
1
2
1
0
0
0
0
0
0
β
β
β
(15)
[ ] i
k
i ×
= 1
1
1
1 L
β (16)
∆PDi : Total change in demand for which the ith area are
responsible
ki: Number of generation units of the ith area
Consequently, designing the controller parameters (Ki)
must also satisfy contract-based constraints. At a desired set
point,
0-7803-7322-7/02/$17.00 (c) 2002 IEEE
1253](https://image.slidesharecdn.com/decentralizedlfc1-250320122355-ea1def85/85/Decentralized-LFC-in-all-detail-link-pdf-2-320.jpg)
![o
i
i
o
Gi
o
Ci
o
i x
K
P
P
u −
=
∆
=
∆
= (17)
( ) Di
i
i
i
i
o
i P
F
K
B
A
x ∆
−
−
= −1
(18)
where
o
i
x : Set point of state variables
o
i
u : Set point of inputs
The input weighting matrix (ri) used for designing Ki will
be selected by “lsqnonlin”, a search routine embedded in the
optimization toolbox in MATLAB, to satisfy eq. (17) and
(18).
Load following
Contracts
(αij)
∆Pdi βi (List of generating
units of each area)
∆PGi, ∆PDi
Lsqnonlin
System
parameters
Ai, Bi, Fi
ri, Ki
Fig. 2. Flowchart of determination of control parameters (Ki).
Next, the interface cancellation gain (KDi) is designed to
cancel the effects of the interface on the integral of the area
control error, which is one of the state variables.
∫ =
= i
i
i
i x
C
ACE
y
~
~ (19)
The effect of the interface on the considered output ( i
y
~ ) is
( ) ( ) ( ) i
i
Di
i
i
i
i
i
zi z
G
K
B
K
B
A
C
y +
−
−
=
∞ −1
~
~ (20)
then the interface cancellation gain (KDi) is selected to make
eq. (20) equals to zero:
( ) ( ) i
i
i
i
i
Di
i
i
i
i
i G
K
B
A
C
K
B
K
B
A
C 1
1 ~
~ −
−
−
−
=
− (21)
( )
[ ] ( ) i
i
i
i
i
i
i
i
i
i
Di G
K
B
A
C
B
K
B
A
C
K 1
1
1 ~
~ −
−
−
−
−
−
= (22)
From eq. (21), interface cancellation gain (KDi), however, can
be obtained as far as the number of inputs are not less than
that of the outputs.
B. Control Design with Estimation of State and Interface
Variables
In an interconnected power system, not all the state vari-
ables are measurable, and the interface variables cannot be
obtained from local measurements. In this paper, a local
Kalman filter is used to overcome this limitation by estimat-
ing the required state and interface variables using only avail-
able measurements at the expense of some performance deg-
radation. The structure of the proposed controller using esti-
mates obtained from a Kalman filter is illustrated in Fig. 3.
Subsystem
(area #i)
Kalman
Filter
-Ki
+
KDi
ui(t) = ∆PCi
zi(t)
yi(t)
wi(t) vi(t)
zi(t)
^
^
xi(t)
xi(t)
PDi
Fig. 3. Decentralized control structure for the ith subsystem.
wi : Plant noise, vi: Measurement noise
ui: Control input, yi: Output
To design a Kalman filter that will estimate both local and
interface variables a dynamical model for these variables is
desired. This model is obtained by introducing the dynamics
of the interface variable (zi), a combination of the deviations
of frequencies from the other areas, in the following form:
fi
i w
z =
& (23)
where wfi is a fictitious white noise. The reason for this as-
sumption comes from the nature of the area frequencies
whose deviations keep oscillating around zero, and are
bounded when NERC’s performance standards are met.
However, the variance of the fictitious noise must be properly
chosen to increase the accuracy of the above model. In this
paper, the value of this variance is chosen at 0.001 by trial-
and-error.
Augmenting the model given by (1) by adding the interface
dynamics given by (23) gives the following model:
Di
i
i
i
i
i
i
i
i P
F
W
G
u
B
x
A
x ∆
+
+
+
=
& (24)
i
i
i
i v
x
C
y +
= (25)
where
=
i
i
i
z
x
x ,
=
fi
i
i
w
w
W ,
=
0
0
i
i
i
G
A
A ,
=
0
i
i
B
B ,
=
0
i
i
F
F
T
i
G
=
1
0
0
0
0
0
0
0
0
1
0
0
,
=
1
0
0
0
0
0
1
0
0
0
0
0
0
0
1
i
C , [ ]
0
i
i C
C =
i
x : Augmented state vector
A Kalman filter, based on (24) and (25), is designed to
estimate the augmented state vector. It is given by:
Di
i
i
i
i
i
i
i
i
i
i P
F
y
L
u
B
x
A
z
x
x ∆
+
+
+
=
= ˆ
ˆ
ˆ
ˆ
ˆ
&
&
&
(26)
0-7803-7322-7/02/$17.00 (c) 2002 IEEE
1254](https://image.slidesharecdn.com/decentralizedlfc1-250320122355-ea1def85/85/Decentralized-LFC-in-all-detail-link-pdf-3-320.jpg)
![i
i
i
i C
L
A
A −
=
ˆ (27)
where Li is the Kalman gain that can be determined by a
MATLAB function called “KALMAN.”
The full dynamical model of the ith subsystem including
the dynamics of the actual system in (1) and the Kalman es-
timator in (26) is expressed in (28).
Di
i
i
i
i
i
i
i
i
i
i
i
i
i
i
i
P
F
F
z
G
u
B
B
x
x
A
C
L
A
x
x
∆
+
+
+
=
0
ˆ
ˆ
0
ˆ
&
&
(28)
In Fig. 3, the input of the subsystem using the estimates of
state variables and interface is defined as
i
Di
i
i
i z
K
x
K
u ˆ
ˆ +
−
= (29)
IV. PERFORMANCE ANALYSIS
The stability of the entire interconnected system, called
here the composite or actual system, when the proposed con-
trollers are implemented, is of a major concern rather than
that of individual subsystems. The composite system has the
following state-space model and control input:
D
P
F
Bu
Ax
x ∆
+
+
=
& (30)
Kx
u −
= (31)
where
T
T
N
T
T
T
N
T
T
x
x
x
x
x
x
x
=
&
L
&
&
&
L
&
& ˆ
ˆ
ˆ
2
1
2
1
[ ]T
N
u
u
u
u L
2
1
= , [ ]T
DN
D
D
D P
P
P
P ∆
∆
∆
=
∆ L
2
1
=
N
N
N
N
N
N
N
N
A
C
L
A
C
L
A
C
L
A
G
G
G
A
G
G
G
A
A
ˆ
0
0
0
0
0
ˆ
0
0
0
0
0
ˆ
0
0
0
0
0
0
0
0
0
2
2
2
1
1
1
2
1
2
2
21
1
12
1
L
L
M
O
M
M
O
M
L
L
L
L
O
M
M
O
M
M
L
L
T
T
N
T
N
T
T
T
T
B
B
B
B
B
B
B
=
L
L
O
M
O
M
M
M
L
L
0
0
0
0
0
0
0
0
2
2
1
1
j
ij
i
ij S
T
G
G = , [ ]
4
4 3
4
4 2
1
L
j
x
of
rows
of
number
j
S 0
0
0
1
=
=
N
NxN
K
K
K
K
L
O
M
M
L
0
0
0
0
0 2
1
, [ ]
Di
i
i K
K
K −
=
The system matrix (A) can be written as
G
A
A
~
~
+
= (32)
where
A
~
: Ideal system matrix without interface consideration, i.e.,
A
A =
~
where any 0
=
ij
G
G
~
: Interface matrix
The closed loop system is:
D
cl
D P
F
x
A
P
F
x
BK
A
x ∆
+
=
∆
+
−
= )
(
& (33)
( ) G
A
G
BK
A
A cl
cl
~
~
~
~
+
=
+
−
= (34)
The performance of the composite closed-loop system (Acl)
is analyzed based on its eigenvalues. Let µ be any eigenvalue
of the composite closed-loop system, i.e. an eigenvalue of Acl,
and λi be the ith eigenvalue of cl
A
~
. The objective of this sec-
tion is to estimate the maximum departure of µ from the ei-
genvalues of cl
A
~
. For this purpose let:
{ }
n
cl diag
D
T
A
T ~
2
1
1
,
,
,
~
λ
λ
λ L
=
=
−
(35)
then
Γ
+
=
+
= −
−
−
D
T
G
T
T
A
T
T
A
T cl
cl
~
~ 1
1
1
(36)
Gershgorin Circle Theorem [6] states:
∑ Γ
≤
−
∈
=
ℑ
=
n
j
ij
i
i d
C
d
~
1
: λ (37)
i
ℑ : Gershgorin disk’s region
C : Complex domain
ij
Γ : (i-j) entity of the matrix Γ
From Gershgorin’s theorem, a Gershgorin disk’s region
gives an estimate of the maximum departure of the composite
closed-loop system eigenvalues (µ) from the eigenvalues (λi)
of the closed-loop control area model. Since the strength of
the interconnection is preset, one can guarantee closed-loop
stability of the composite system by properly designing the
area controllers.
V. CASE STUDY
A power system, which consists of three control areas in-
terconnected through a number of tie-lines as shown in Fig. 4
is used to illustrate the proposed idea.
Area 1 Area 2
Area 3
tie-line
Fig. 4. A three-area power system.
0-7803-7322-7/02/$17.00 (c) 2002 IEEE
1255](https://image.slidesharecdn.com/decentralizedlfc1-250320122355-ea1def85/85/Decentralized-LFC-in-all-detail-link-pdf-4-320.jpg)
![B. Test system #2
This test system is more realistic than the previous one.
Now area 1 has an additional generating unit identical to the
one in area 2. It is used to demonstrate the ability of the pro-
posed controllers to allocate generating units’s outputs ac-
cording to a given load following contract described as
pu
P
P
P
P
P
P
P
dc
dc
dc
G
G
G
G
−
=
∆
∆
∆
=
∆
∆
∆
∆
6
.
0
0325
.
0
0475
.
0
05
.
0
8
.
0
0
0
1
.
0
8
.
0
0
1
.
0
0
4
.
0
0
2
.
0
6
.
0
3
2
1
4
3
2
1
4
4 3
4
4 2
1
α
Later the identical changes in demands in the previous test
system are applied. Then the total change in demand for
which each area has to be responsible can be obtained as
pu
P
P
P
P
P
P
P
G
G
G
G
D
D
D
=
∆
∆
∆
∆
=
∆
∆
∆
0.06
0.0325
-
0975
.
0
1
0
0
0
0
1
0
0
0
0
1
1
4
3
2
1
3
2
1
After the simulation is completed, the changes in turbine
power (∆PT) of each unit are shown in Fig. 9.
Fig. 9. Changes in turbine power for test system #2.
The area control error and frequency deviation of each area
are shown as Fig. 10 and 11 respectively.
Fig. 10. Area control error for test system #2
Fig. 11. Frequency deviation for test system #2.
VII. CONCLUSION
This paper proposes a decentralized controller for the load
frequency control operated as a load following service. Decen-
tralization is achieved by developing a model for the interface
variables, which is a combination of frequencies of other sub-
systems. To account for the modeling uncertainties, a local
Kalman filter is designed to estimate each subsystem’s own
and interface variables. The controller uses these estimates,
optimizes a given performance index, and allocates generat-
ing units’s outputs according to a deregulation scenario. The
performance of the proposed controllers is assessed through
eigenanalysis and simulation of two test systems, each con-
sisting of a three-area power system. The first system has one
generator in each area, and the second has one area with two
units operating under a deregulation scenario. It is shown that
the proposed technique gives good results.
VIII. REFERENCES
[1] C. E. Fosha, Jr. and O. I. Elgerd, “The Megawatt-Frequency Control
Problem: A New Approach Via Optimal Control Theory,” IEEE Trans-
actions on Power Systems, vol. 89, no. 4, pp. 563-577, April 1970.
[2] M. L. Kothari, N. Sinha and M. Rafi, “Automatic Generation Control of
an Interconnected Power System Under Deregulated Environment,”
Power Quality’ 98, pp. 95-102, 1998.
[3] R. D. Christie and A. Bose, “Load Frequency Control Issues in Power
System Operations after Deregulation”, IEEE Transaction on Power
Systems, Vol. 11, No. 3, pp. 1191-1200, August 1996.
[4] R. D. Christie and A. Bose, “Load Frequency Control In Hybrid Elec-
tric Power Markets,” Proceedings of the 1996 IEEE International Con-
ference on Control Applications, pp. 432-436, September, 1996.
[5] J. B. Burl, Linear Optimal Control, Addison Wesley Longman, Inc.,
1999.
[6] G. H. Golub and A.F. Van Loan, “Matrix Computations,” 2nd
edition,
Baltimore: The John Hopkins university Press, 1989.
IV. BIOGRAPHIES
Dulpichet Rerkpreedapong received his MSEE from the CSEE Depart-
ment, West Virginia University in 1999. He is currently working towards a
Ph.D. in Electrical Engineering at WVU. His research interests are in power
systems control and operation, and power systems restructuring.
Ali Feliachi received the MS and PhD degree in electrical engineering
from Georgia Tech in 1979 and 1983 respectively. He joined the faculty of
Electrical and Computer Engineering at West Virginia University in January
1984 where he is now a Full Professor and the holder of the endowed Electric
Power Systems Chair position. His research interests are in modeling,
simulation, control and estimation of large-scale systems with emphasis on
electric power systems.
0-7803-7322-7/02/$17.00 (c) 2002 IEEE
1257](https://image.slidesharecdn.com/decentralizedlfc1-250320122355-ea1def85/85/Decentralized-LFC-in-all-detail-link-pdf-6-320.jpg)